Executive Summary
Investment Thesis: ADP is a dominant payroll processor with a fortress moat built on switching costs and regulatory complexity. However, at 26-28x earnings with 7% growth, margin expansion limits reached, and alarming 170% debt surge, the stock trades at a full valuation offering minimal margin of safety.
Business Classification: Stalwart (large-cap, 7-10% growth, mature business)
Current Valuation Assessment:
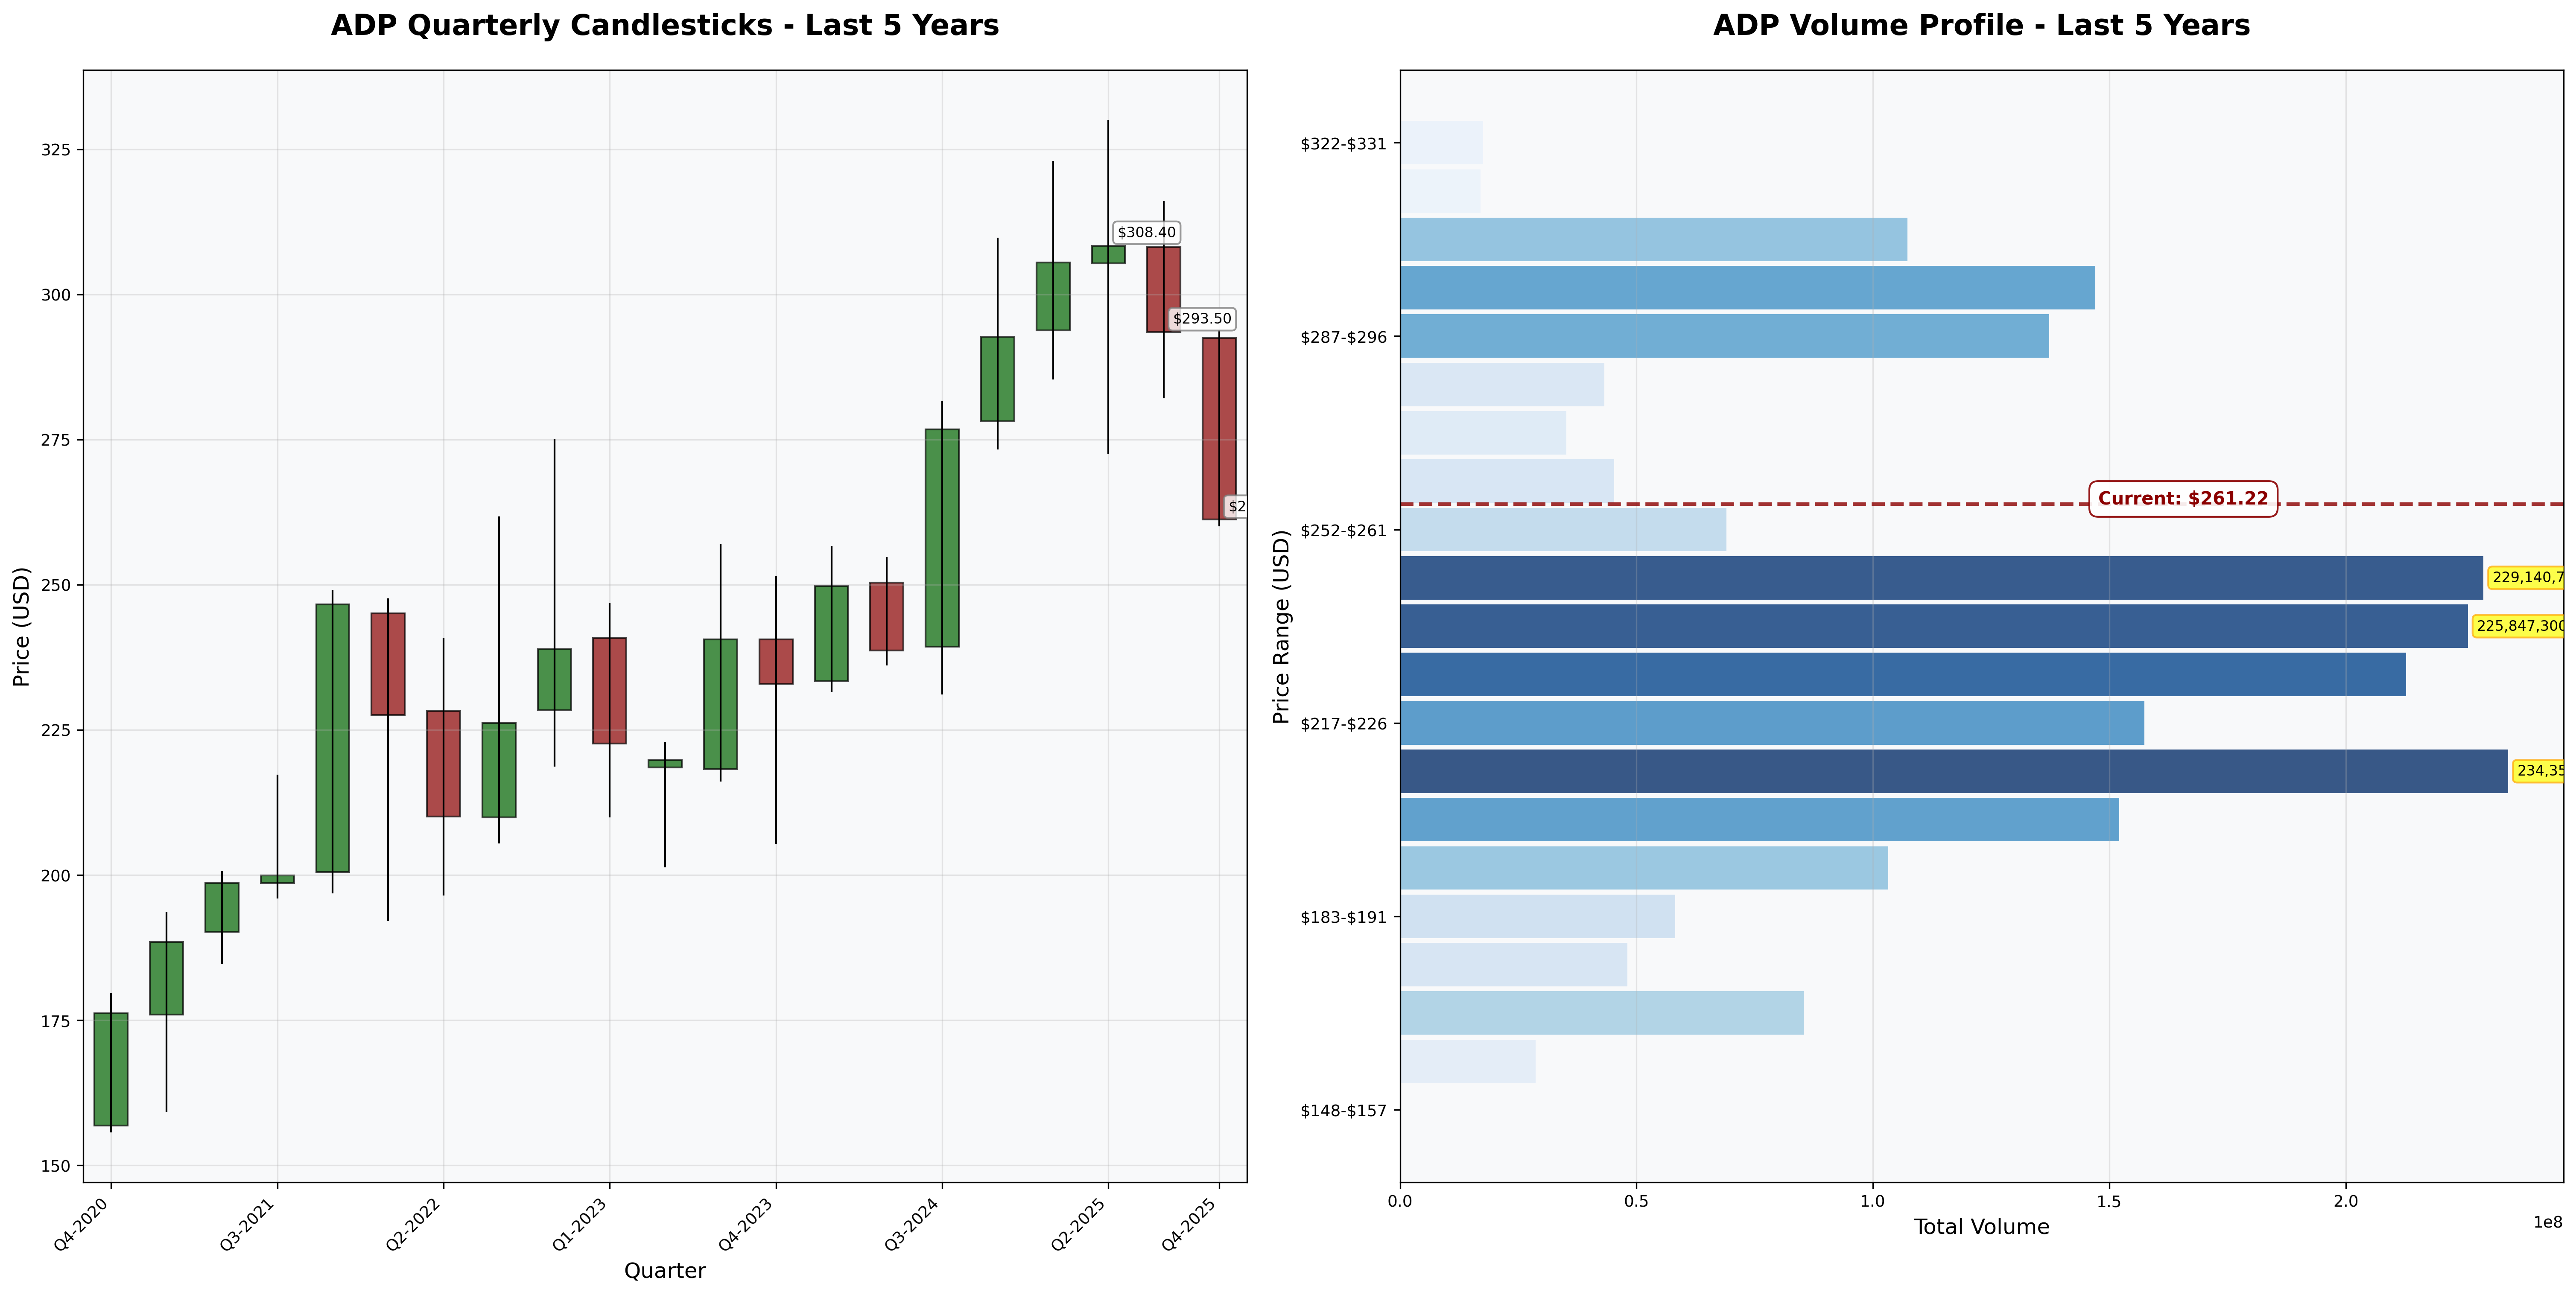
- Current Price: $261
- Estimated Intrinsic Value: $220-$240
- Margin of Safety: -8% to -12% (insufficient)
- Recommendation: HOLD / AVOID
Recommended Entry Zones:
- Aggressive Entry: < $210 (20%+ margin)
- Standard Entry: $210-$220 (15% margin)
- Hold/Avoid: > $220
Business Overview
What They Do (2-Minute Test)
ADP processes payroll for 1 in 6 American workers—41 million people globally. Companies outsource their payroll, tax compliance, benefits administration, and HR management to ADP. Customers pay because payroll mistakes create legal liability, employee dissatisfaction, and regulatory penalties. ADP handles complexity so businesses don’t have to.
Competitive Position & Moat Analysis
Primary Moat Type: Switching Costs + Regulatory Complexity
Moat Strength: ⭐⭐⭐⭐☆ (4/5)
Key Moat Factors:
- Mission-critical switching costs: Migrating payroll systems risks operational disruption, making retention rates extremely high
- Regulatory expertise: 76 years navigating 50+ state tax codes and evolving compliance creates genuine barriers to entry
- Float advantage: Client funds held temporarily generate interest income that scales with customer base
- Operational scale: 1M+ clients enable cost advantages smaller competitors cannot match
Moat Durability:
- Status: Narrowing - Cloud-native competitors (Workday, Gusto) winning share with superior UX
- Key Threat: Legacy technology systems becoming competitive liability if modernization lags
Industry Dynamics
50-Year Outlook: Payroll outsourcing remains viable—regulatory complexity increases over time, favoring specialists. Cloud transition is the format change, not an existential threat.
Key Trends:
- Shift to cloud-based HCM accelerating enterprise migration
- Gig economy growth requiring more sophisticated payroll solutions
- Competitive intensity from well-funded fintech challengers limiting pricing power
Quantitative Checklist
Defensive Investor Criteria:
| Criterion | Requirement | Actual | Pass/Fail |
|---|---|---|---|
| Earnings Stability | Positive 10 years | 10/10 years | ✅ |
| Dividend Record | Some payment | $5.80/share | ✅ |
| Earnings Growth | +33% in 10 years | +65% (FY15-25) | ✅ |
| P/E Ratio | < 15x | 26.2x | ❌ |
| P/B Ratio | < 1.5x | 20.1x | ❌ |
| P/E × P/B | < 22.5 | 526 | ❌ |
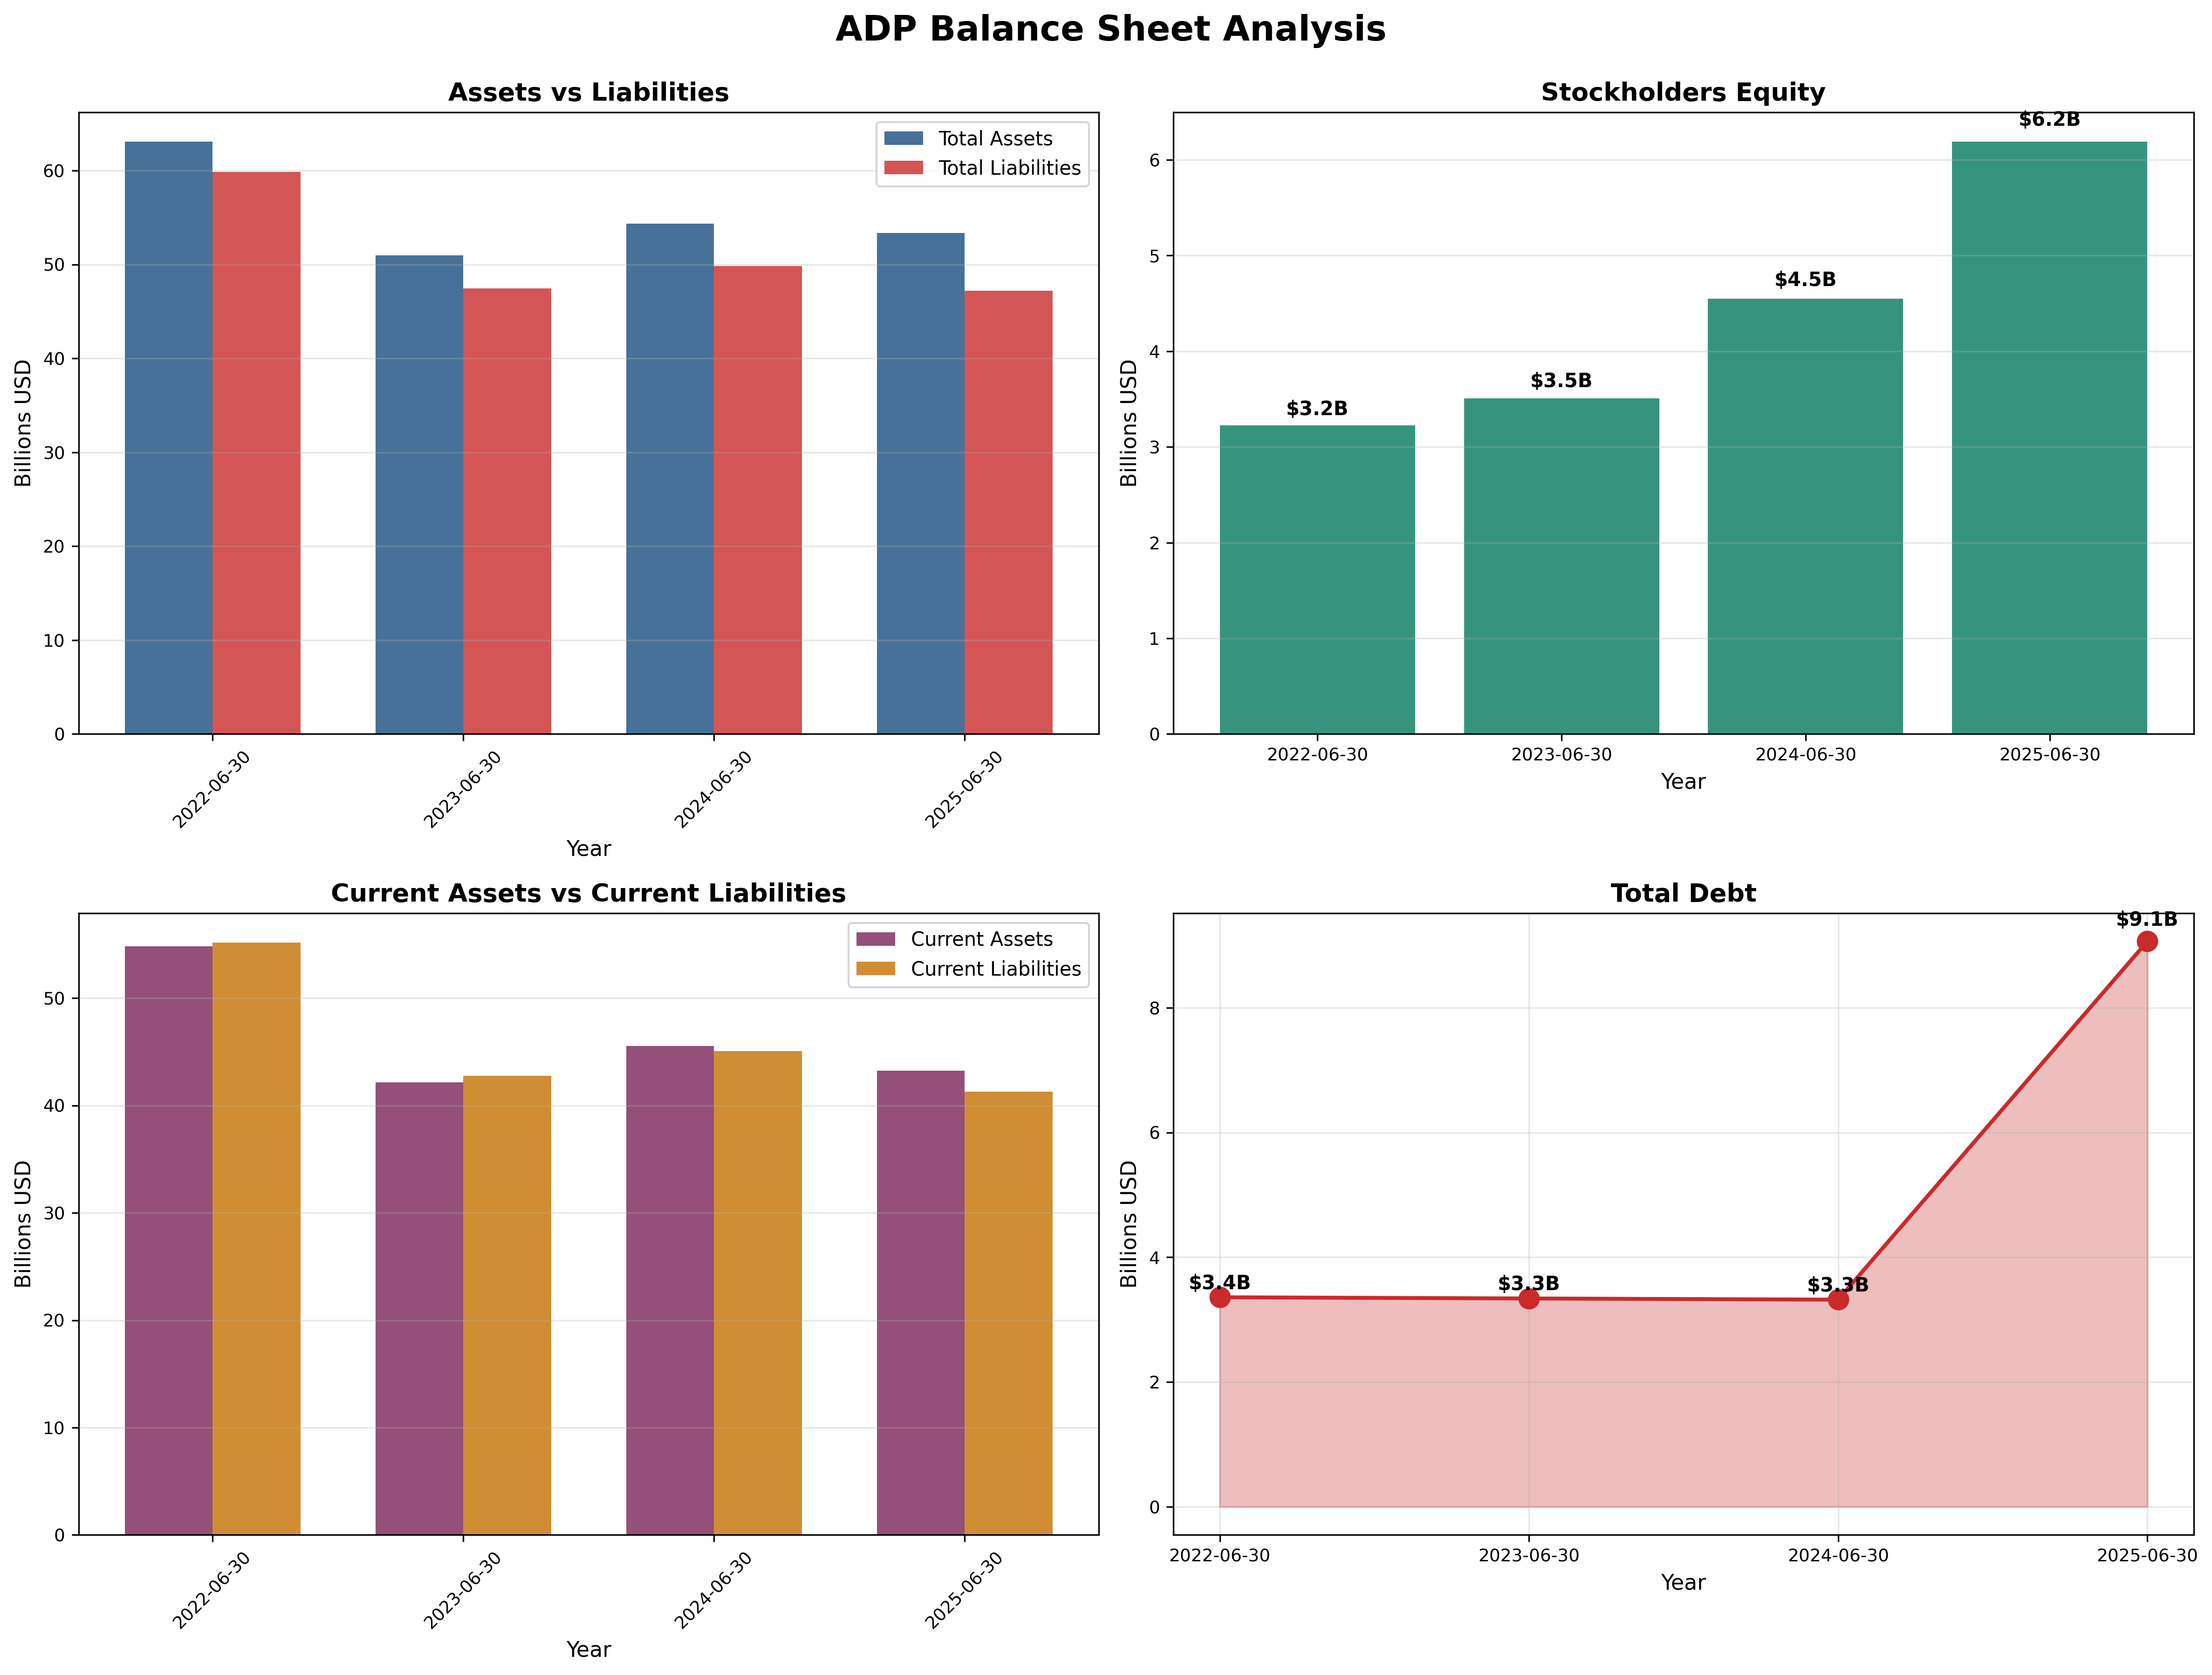
| Current Ratio | > 2.0 | 1.05x | ❌ |
| Debt vs NCA | Debt < NCA | $9.1B vs $5.3B | ❌ |
Quantitative Score: 3/8 criteria met
Analysis: ADP passes quality tests (earnings stability, dividend record, growth) but fails all valuation and balance sheet criteria. This is a high-quality business at an expensive price with deteriorating financial strength.
Financial Analysis with Critical Assessment
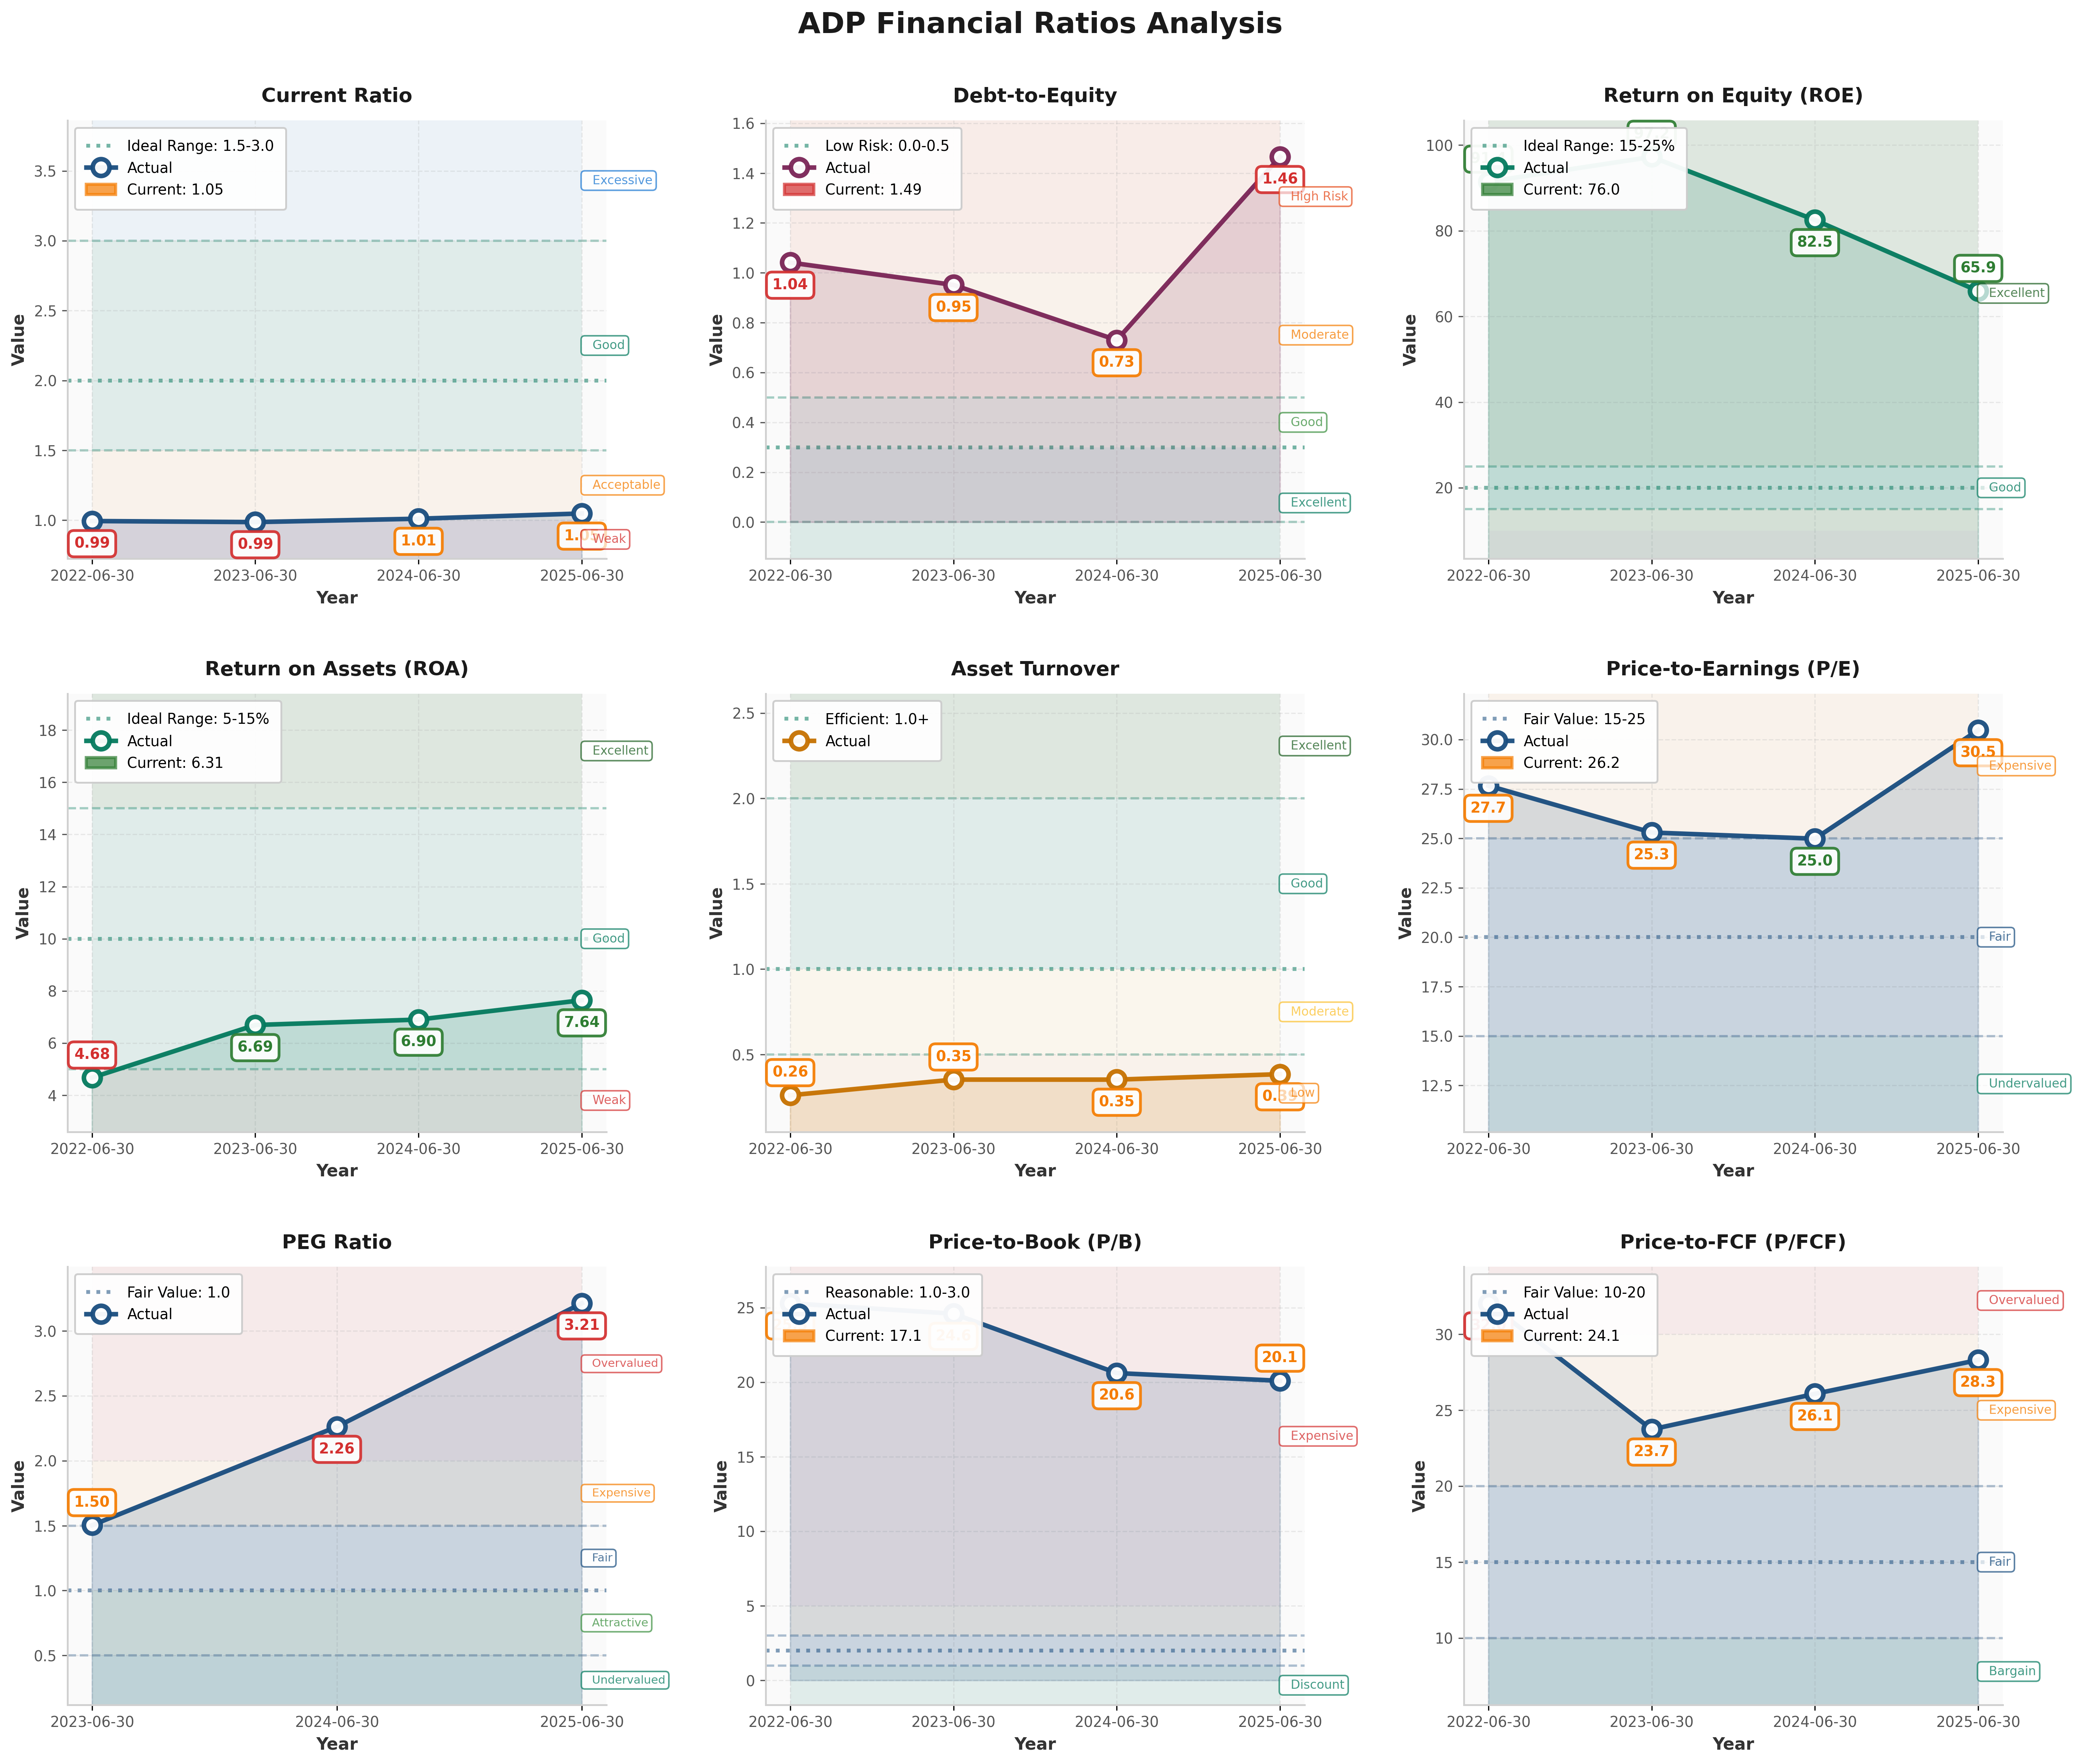
Balance Sheet Strength
Key Metrics:
- Current Ratio: 1.05 (target > 2.0) - ❌
- Debt-to-Equity: 1.49 (target < 0.5) - ❌
- Interest Coverage: ~15x (target > 5x) - ✅
Assessment: Major red flag. Debt exploded from $3.3B to $9.1B in one year (+170%), purpose undisclosed. Current ratio below 1.5 signals tight liquidity. Cash flows support debt servicing, but Graham would reject this leverage for an asset-light business.
Earnings Quality & Consistency
Stability Test: Positive earnings in 10/10 of past 10 years ✅
Owner Earnings Calculation:
Net Income: $4.1B
+ D&A: ~$0.7B
- Maintenance Capex: ~($0.6B)
- Working Capital Needs: ~($0.2B)
= Owner Earnings: ~$4.0B
Owner Earnings Yield: 3.8% ($4.0B / $106B market cap)
Quality Assessment: Excellent earnings consistency with no red flags. However, 3.8% owner earnings yield is barely above risk-free rates—insufficient compensation for equity risk.
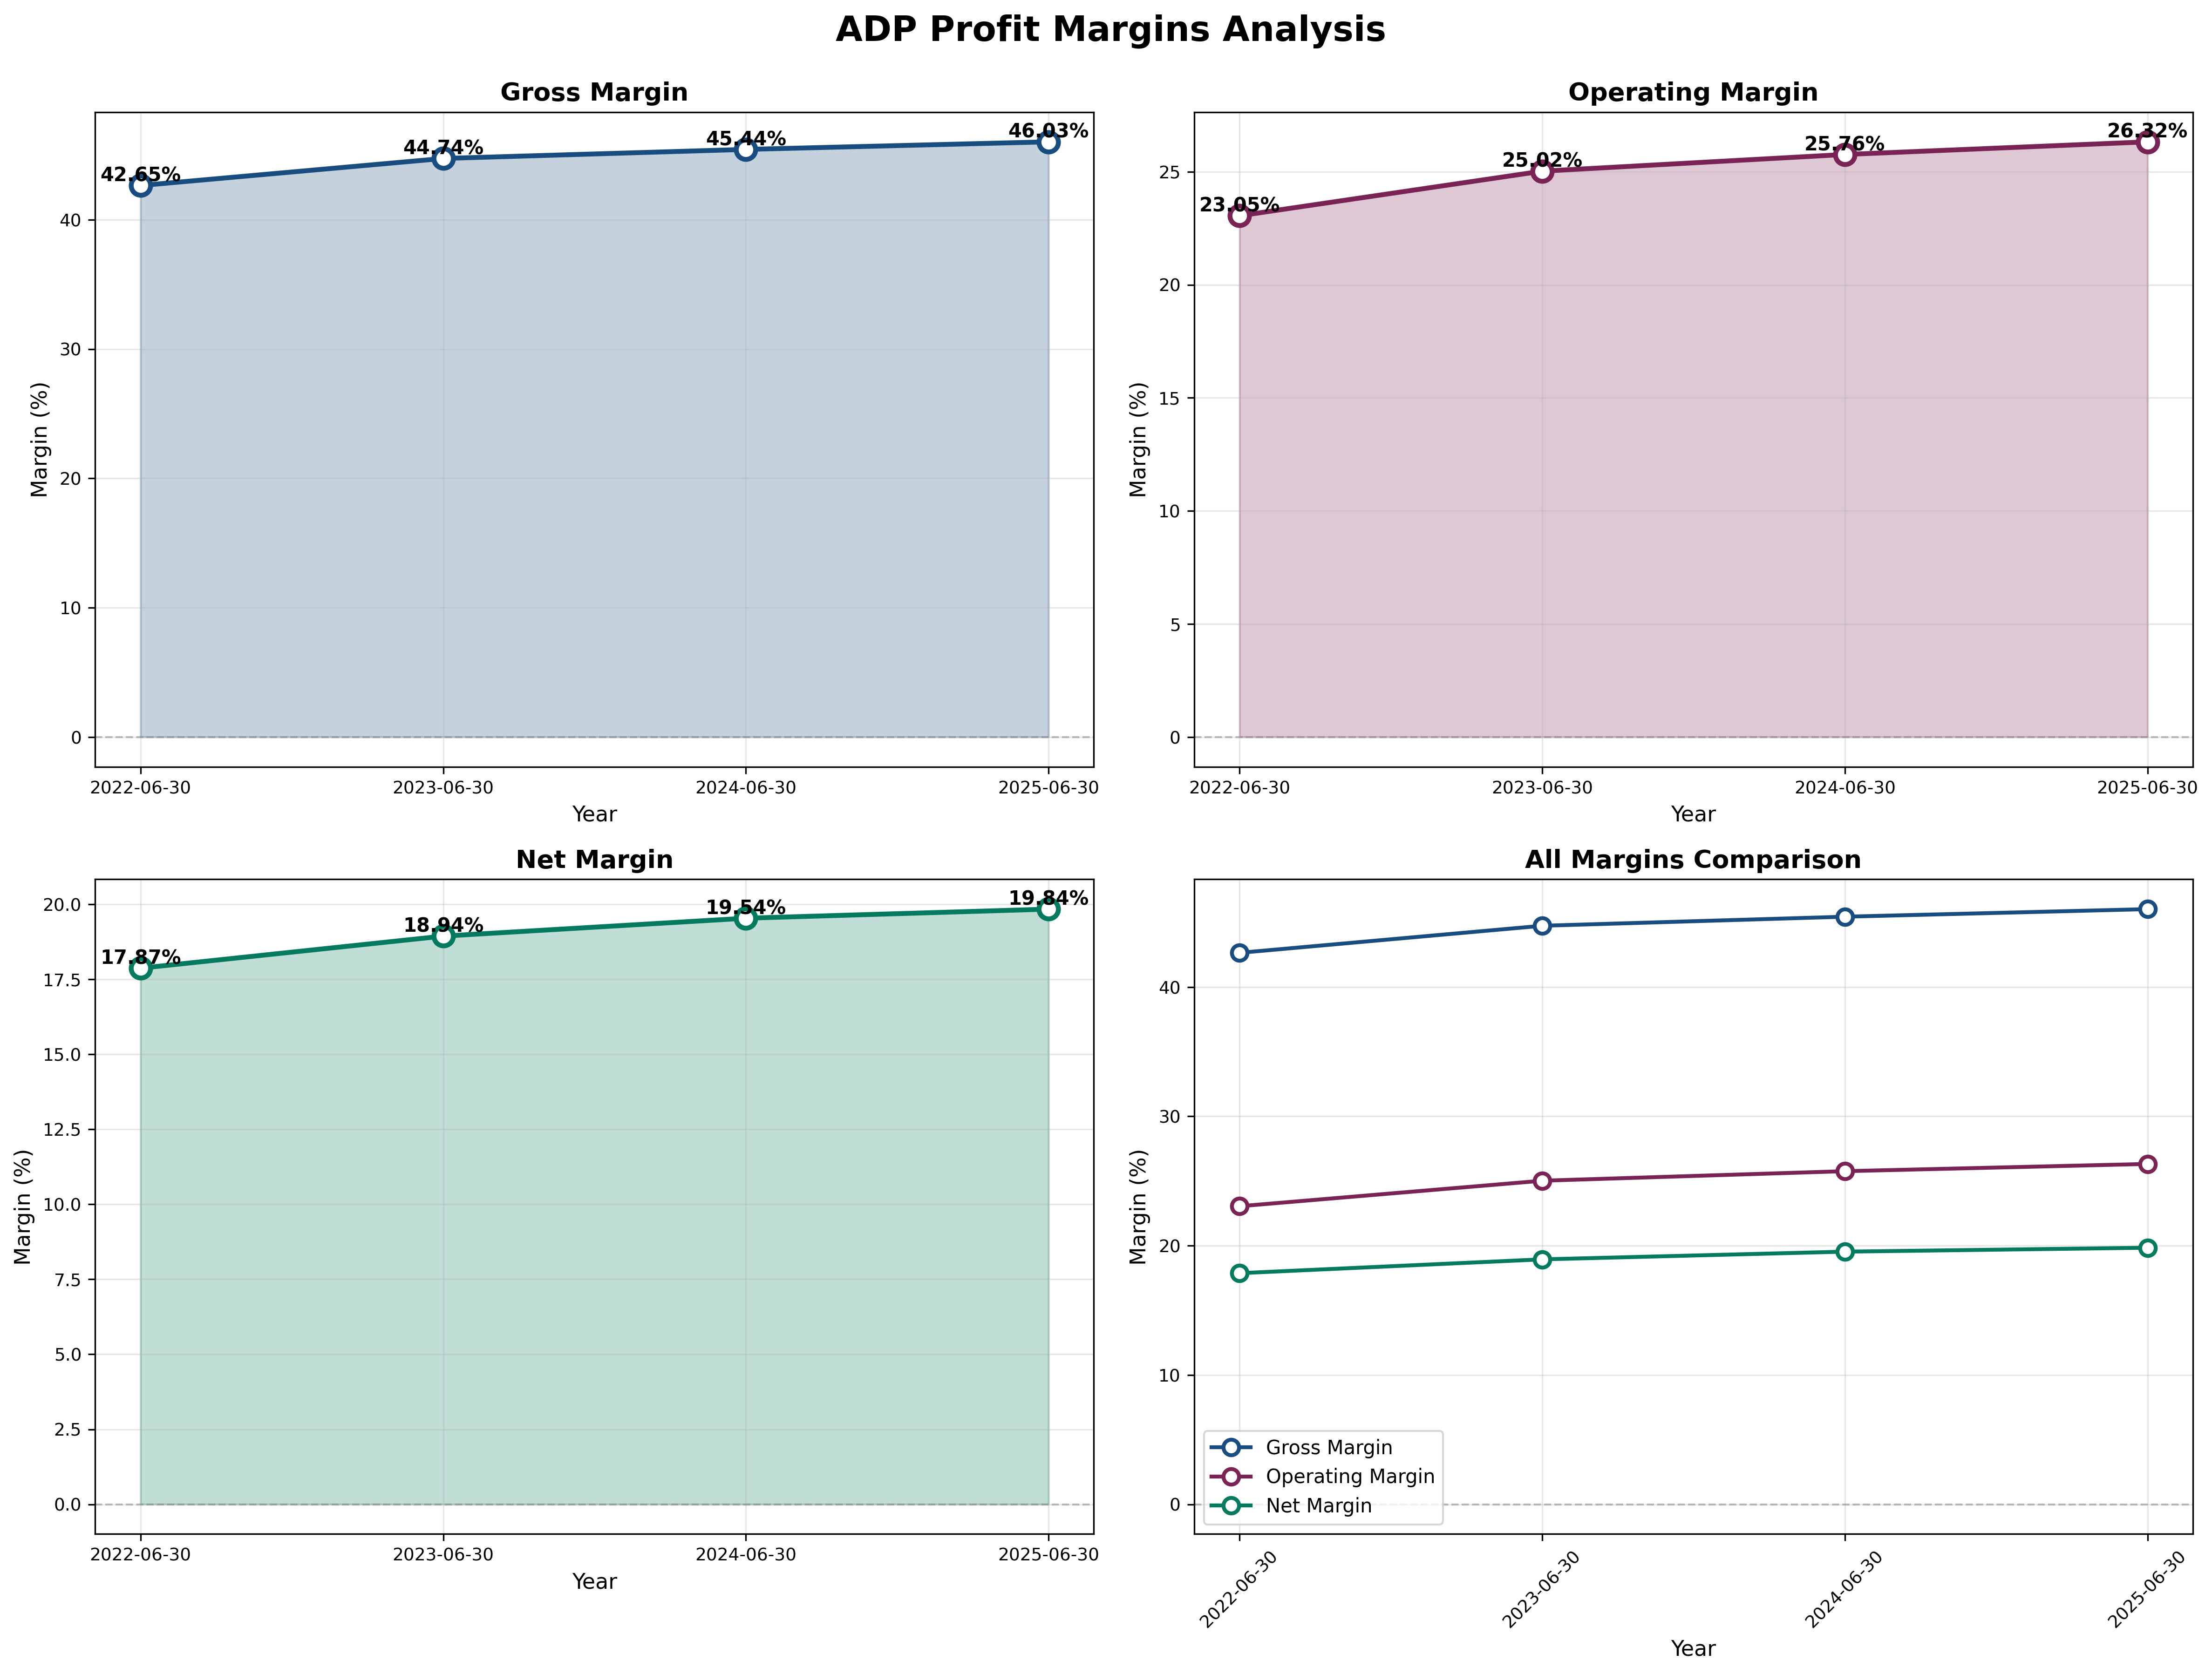
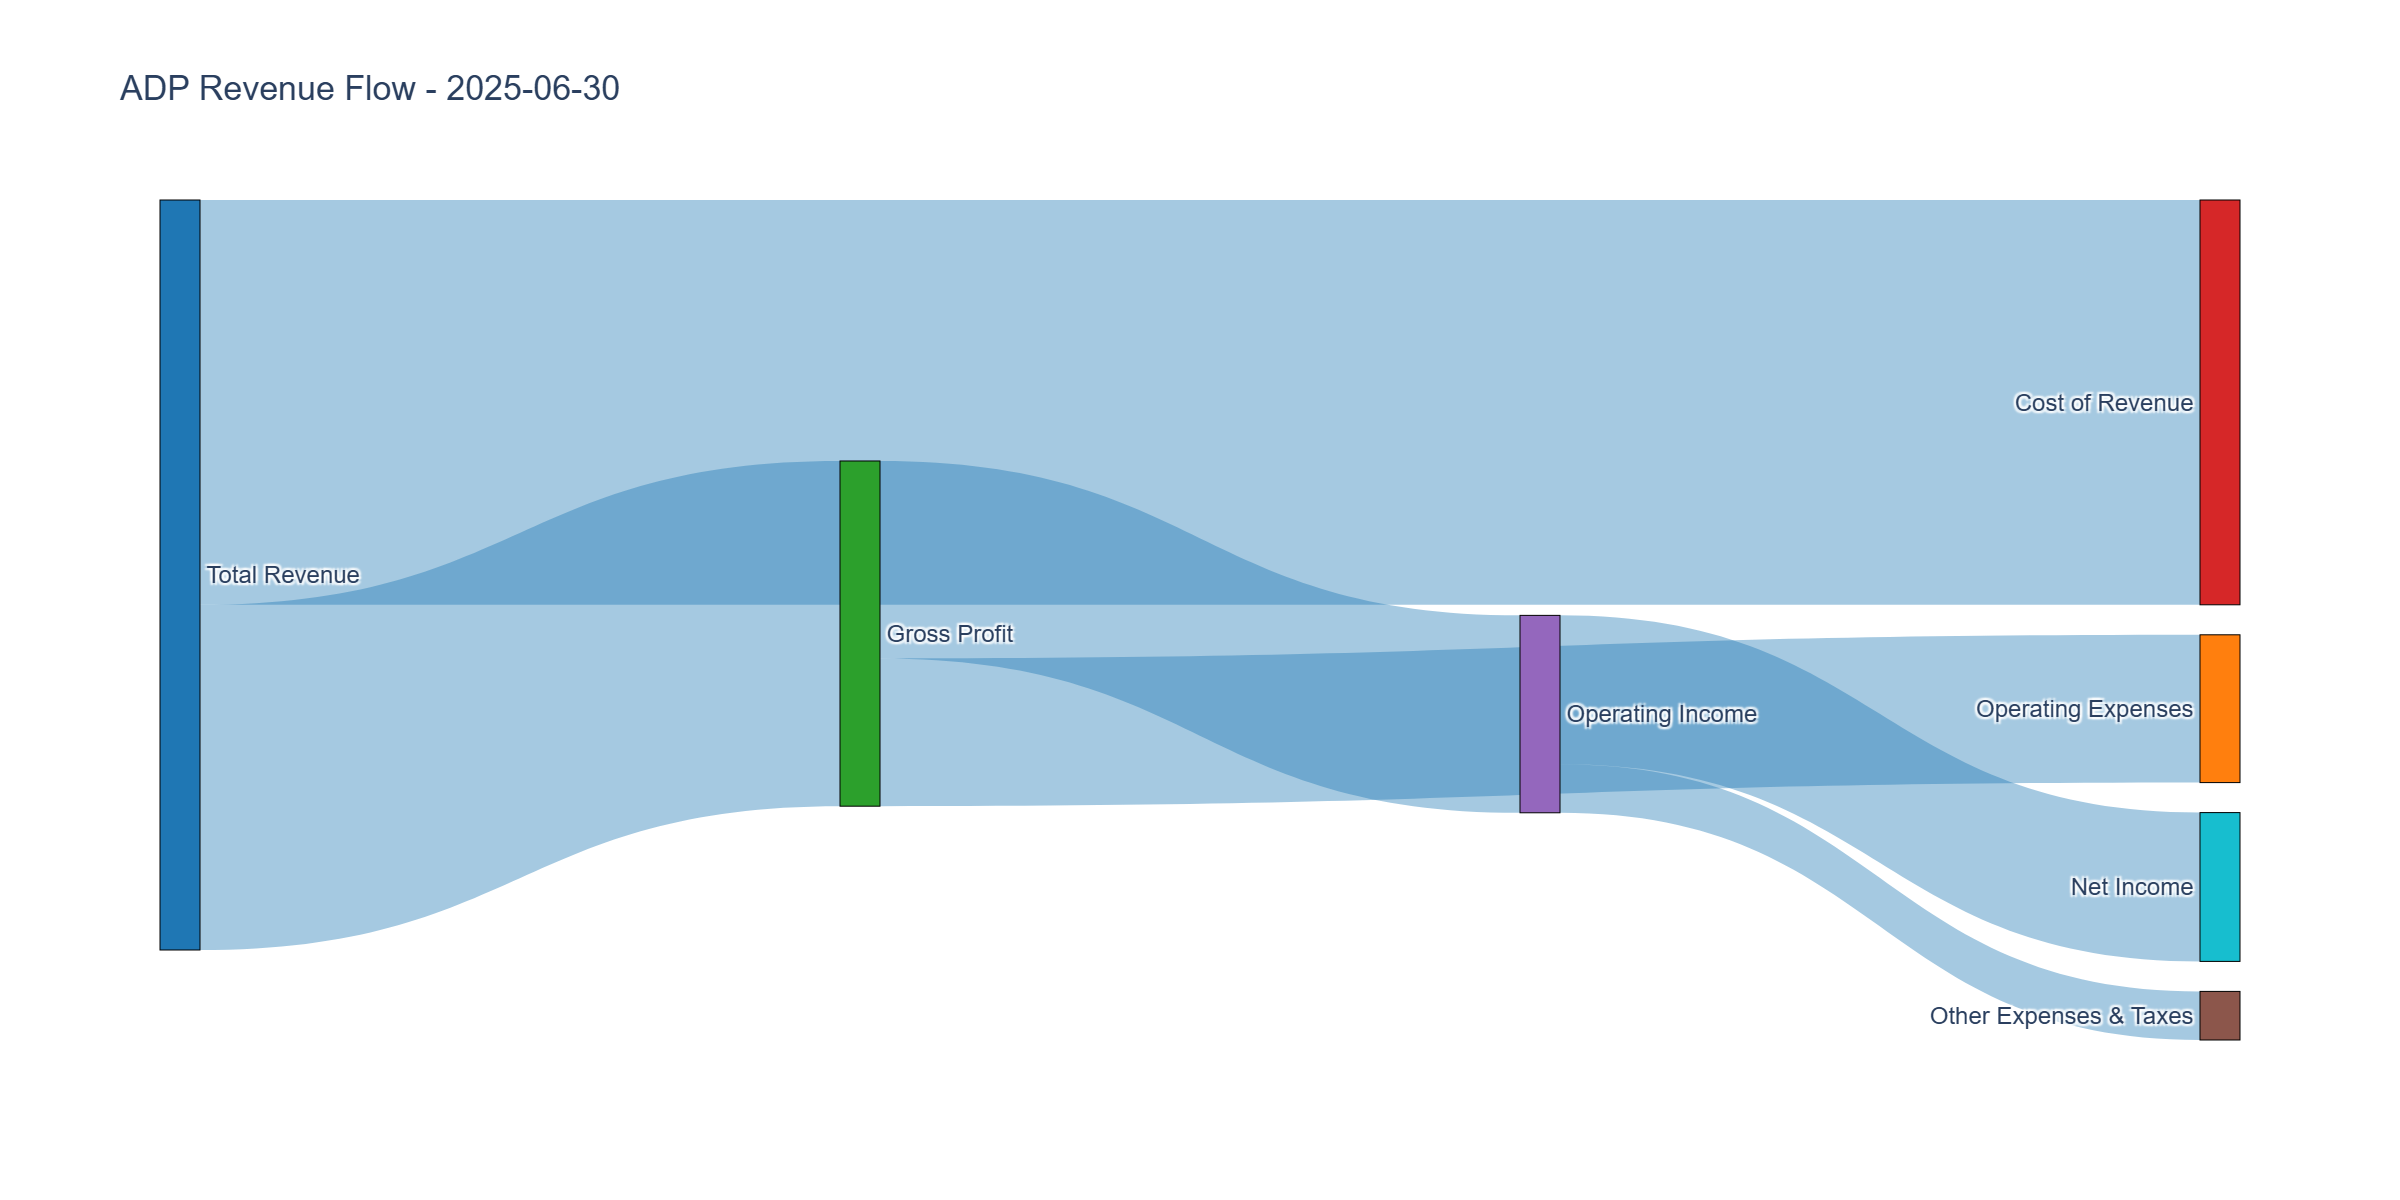
Income Statement Analysis
Key Metrics:
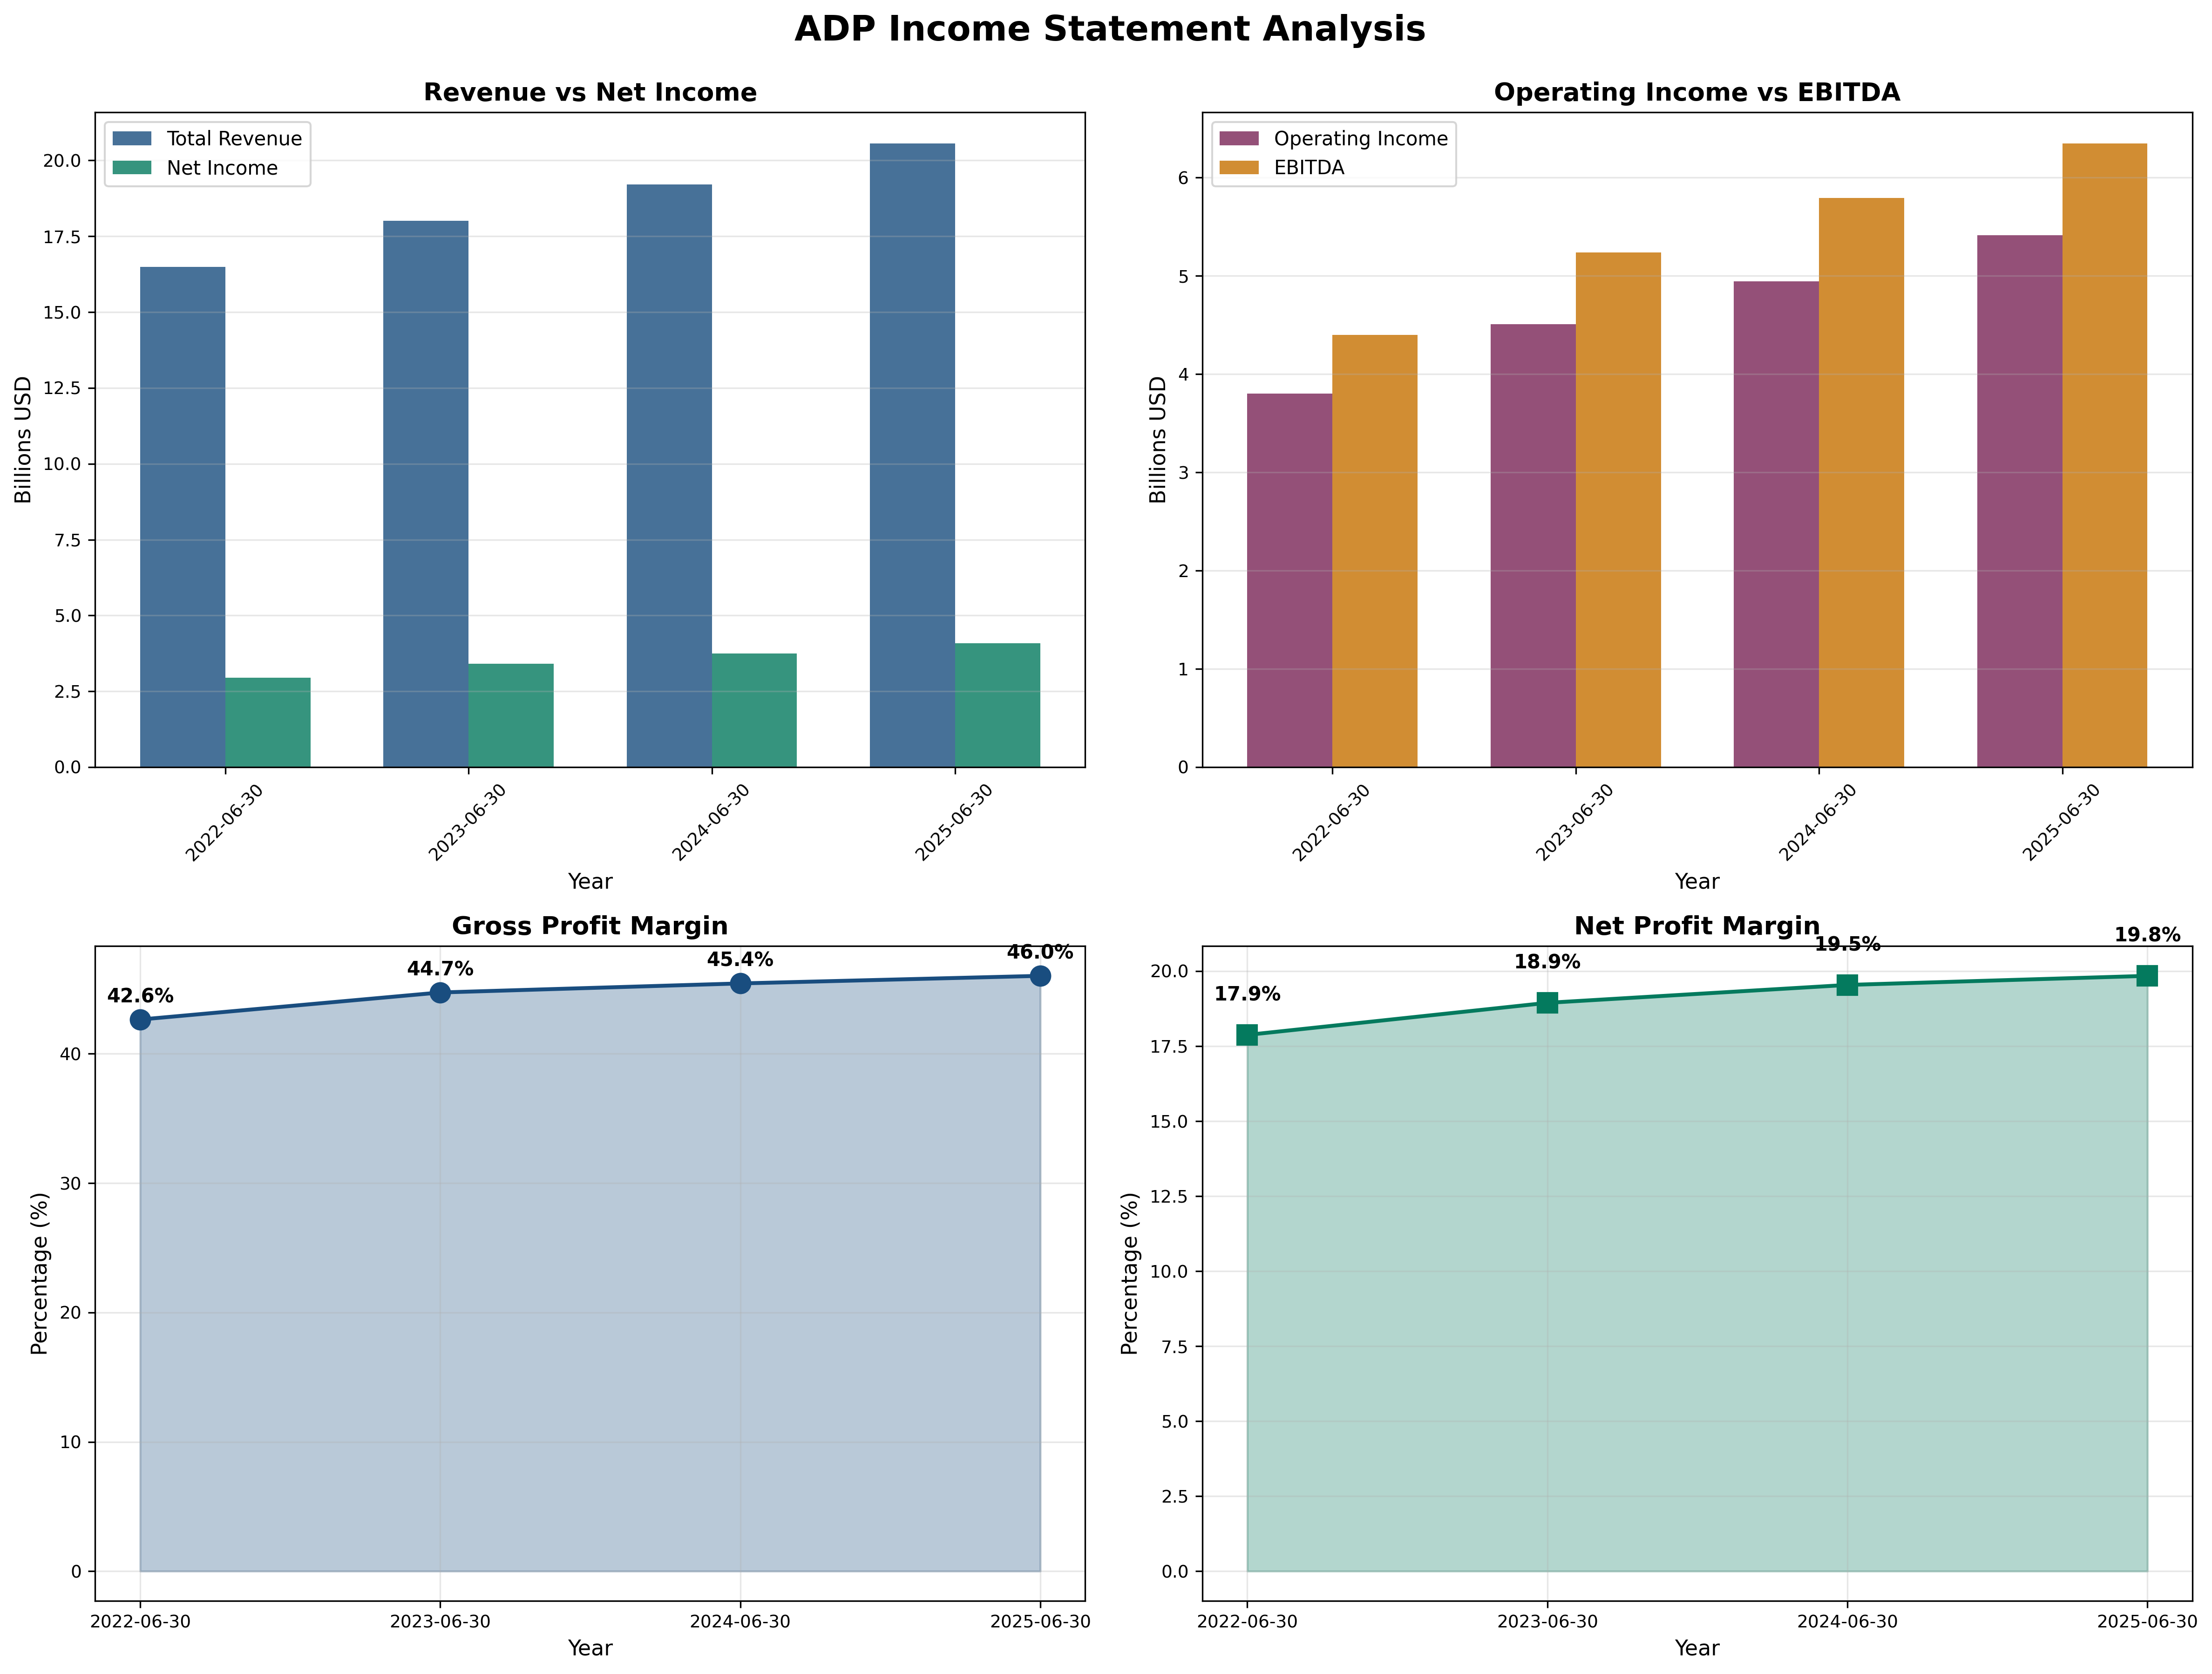
- Revenue Growth (3Y CAGR): 7.1%
- Gross Margin: 46.0% (trend: ↑)
- Operating Margin: 26.3% vs Industry ~25%
- Net Margin: 19.8%
Assessment: Solid margin expansion (+330 bps operating margin in 3 years) reflects genuine efficiency gains. However, runway limited—ADP is not a 70%+ margin software business. Future growth must come from volume, not pricing power, which faces competitive pressure.
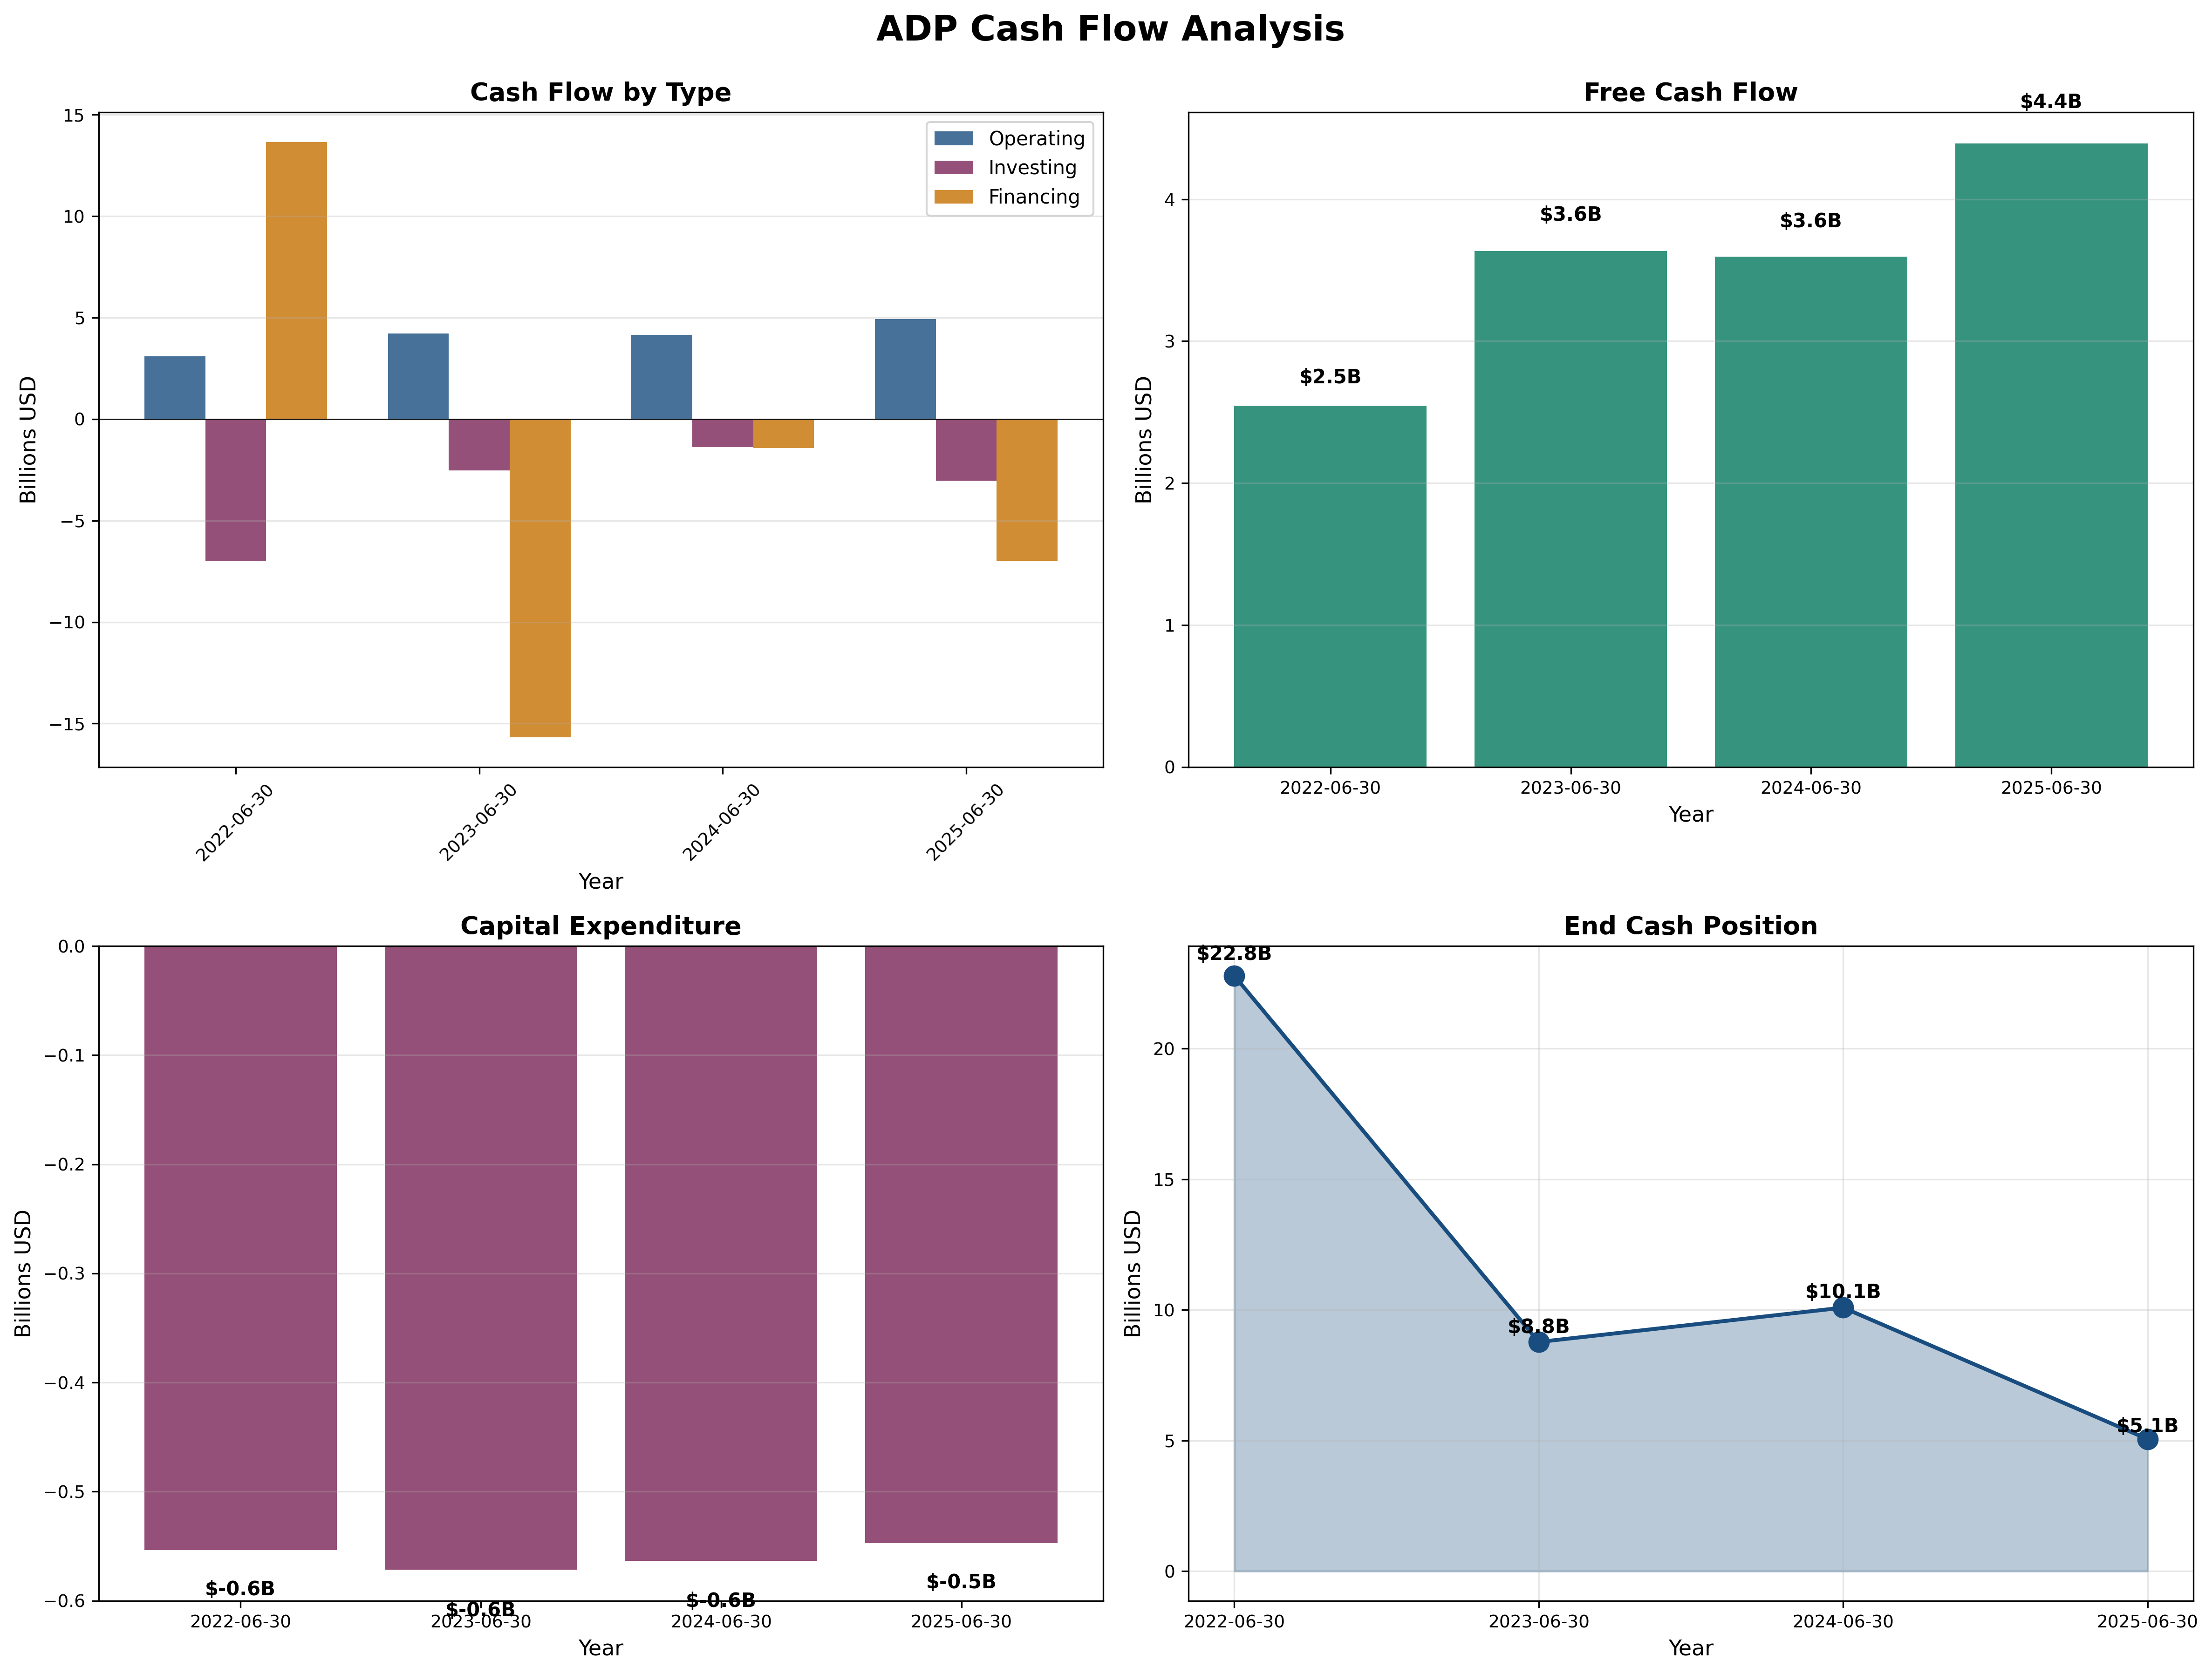
Cash Flow Generation
Key Metrics:
- OCF / Net Income: 1.22 (target > 1.0) ✅
- FCF Margin: 21.5%
- Capital Intensity: 3% of revenue
Assessment: World-class cash conversion. FCF grew from $2.5B to $4.4B (+76% in 3 years). This is ADP’s crown jewel—predictable, high-margin, asset-light cash generation.
Profitability Metrics
Returns:
- ROE: 65.9% (target > 15%) ✅
- ROIC: ~55% (target > 12%) ✅
Assessment: Excellent absolute returns but concerning 31-point ROE decline (96% → 66%) in 3 years. Management struggling to reinvest capital at historical rates—classic sign of business maturity and diminishing opportunities.
Financial Ratios Analysis
Valuation Multiples:
- P/E: 26.2x (vs. historical avg: ~22x, industry: 25-28x)
- P/B: 20.1x (vs. historical avg: ~10-12x)
- P/FCF: 24.1x (vs. historical avg: ~20x)
- EV/EBITDA: ~18x
PEG Ratio:
- P/E Ratio: 26.2x
- Growth Rate: 7-8%
- PEG: 3.21 (< 1.0 is attractive) ❌
Combined Metric:
- P/E × P/B = 526 (should be < 22.5) ❌
Capital Allocation Assessment
Management Quality Grade: B
Key Factors:
- Insider Ownership: <5% (low skin in game)
- Buyback Discipline: Poor (repurchasing at 26x+ earnings)
- Reinvestment ROIC: Declining from 96% to 66%
- Red Flags: Unexplained $5.8B debt surge, opaque capital deployment
Assessment: Dividend Aristocrat pedigree (49 years) demonstrates commitment, but recent decisions questionable. Buying back stock at premium valuations destroys shareholder value. Debt surge without disclosure erodes trust.
Valuation & Intrinsic Value
Multiple Methods Summary:
| Method | Intrinsic Value | Weight |
|---|---|---|
| Owner Earnings (8.5+2g formula) | $215 | 30% |
| DCF (Conservative 8% growth) | $230 | 30% |
| PEG-Based Fair Value (PEG=1.3) | $240 | 20% |
| Graham Number √(22.5×EPS×BVPS) | $171 | 20% |
Weighted Intrinsic Value: $220
Valuation Range:
- Conservative: $180 (recession scenario, 6% growth)
- Base Case: $230 (7-8% steady growth)
- Optimistic: $300 (AI-driven margin expansion)
Current Price: $261 Margin of Safety: -12% vs Base Case ❌
Risk Assessment
Key Risks (Top 3)
- Technology disruption - Cloud-native competitors with superior UX eroding market share, particularly in SMB segment
- Economic sensitivity - Recessions reduce employment and client spending; float income vulnerable to rate cuts
- Debt overhang - Unexplained $5.8B debt increase with declining ROE suggests poor capital allocation or hidden problems
Worst Case Scenario: Recession triggers client losses, PEO margin collapse, and debt servicing pressure. Stock could revert to $180-200 (15-20x depressed earnings).
Market Sentiment
Current Sentiment: Optimism (trading near all-time highs, premium valuation maintained despite growth deceleration)
Contrarian Signal: Not yet maximum pessimism. Stock has held up despite warning signs. A genuine value opportunity emerges at $200-220 range during market correction or earnings disappointment.
Investment Recommendation
Current Assessment
Valuation: PEG = 3.21 | P/E = 26.2x vs Industry 25-28x Verdict: Overvalued
Margin of Safety: -12% ❌ Insufficient (<25% minimum required)
Entry Zones
| Zone | Price | Action |
|---|---|---|
| 🟢 Strong Buy | < $210 | 20%+ margin |
| 🟡 Buy | $210-$220 | 15-20% margin |
| 🟠 Hold | $220-$250 | 5-15% margin |
| 🔴 Avoid | > $250 | < 5% margin |
Current Price: $261 → Recommendation: AVOID
Expected Returns
- Bull Case (+15%): AI-driven efficiency gains expand margins to 30%; float income surges; stock reaches $300
- Base Case (+3%): Single-digit earnings growth, stable multiples; stock drifts to $270 over 2 years
- Bear Case (-25%): Recession exposes operating leverage; debt concerns emerge; multiple contracts to 20x at $200
Final Investment Conclusion
Overall Grade: B
Category Scores:
- Business Quality: 8/10 (strong moat but narrowing)
- Financial Strength: 6/10 (cash flows excellent, balance sheet deteriorating)
- Management Quality: 6/10 (track record solid, recent decisions questionable)
- Valuation: 3/10 (expensive on all metrics)
- Margin of Safety: 2/10 (trading above fair value)
Final Verdict: HOLD (existing) / AVOID (new buyers)
Investment Thesis Summary
Business Quality: ADP owns a high-quality franchise with durable switching costs and regulatory complexity moats. The business will exist and generate cash for decades. However, the moat is narrowing as cloud-native competitors gain share, and mature market dynamics limit growth to mid-single digits.
Valuation: At $261 (26x earnings, PEG 3.2), you’re paying top-dollar for a good—not great—stalwart. Graham’s formula suggests fair value at $171; DCF models point to $220-240. The market is pricing in perfection with minimal room for error.
Risks: Three major concerns: (1) unexplained $5.8B debt surge signals poor capital allocation or undisclosed issues; (2) ROE collapse from 96% to 66% shows diminishing reinvestment returns; (3) competitive threats from Workday, Gusto, and fintech challengers accelerating. Owner earnings yield of 3.8% barely exceeds Treasury yields—insufficient risk premium.
Catalysts: Wait for: market correction driving price to $210 range; debt clarity from management; or revenue growth re-acceleration to 10%+. Patient investors will get a better entry.
Framework Checklist
- ❌ Quantitative: No margin of safety—trading 12% above fair value
- ✅ Moat: Durable competitive advantages, though narrowing
- ❌ Management: Shareholder-friendly history, but recent capital allocation questionable
- ❌ Contrarian: No maximum pessimism opportunity—trading at premium multiples
- ✅ Simplicity: Business model easily understood—payroll processing with high retention
Would I hold this for 10+ years if the market closed tomorrow? Yes, but only if bought at $210 or below. At $261, risk/reward is asymmetric to the downside. Quality business, wrong price.