Executive Summary
Investment Thesis: Salesforce dominates CRM software with a wide moat built on switching costs and ecosystem lock-in. The company transformed from growth-obsessed (2% margins) to profitability-focused (20% margins) in three years while generating $12.4B in free cash flow. However, at 37x earnings with 8% revenue growth, valuation offers minimal margin of safety.
Business Classification: Stalwart (large company, 8-10% growth)
Current Valuation Assessment:
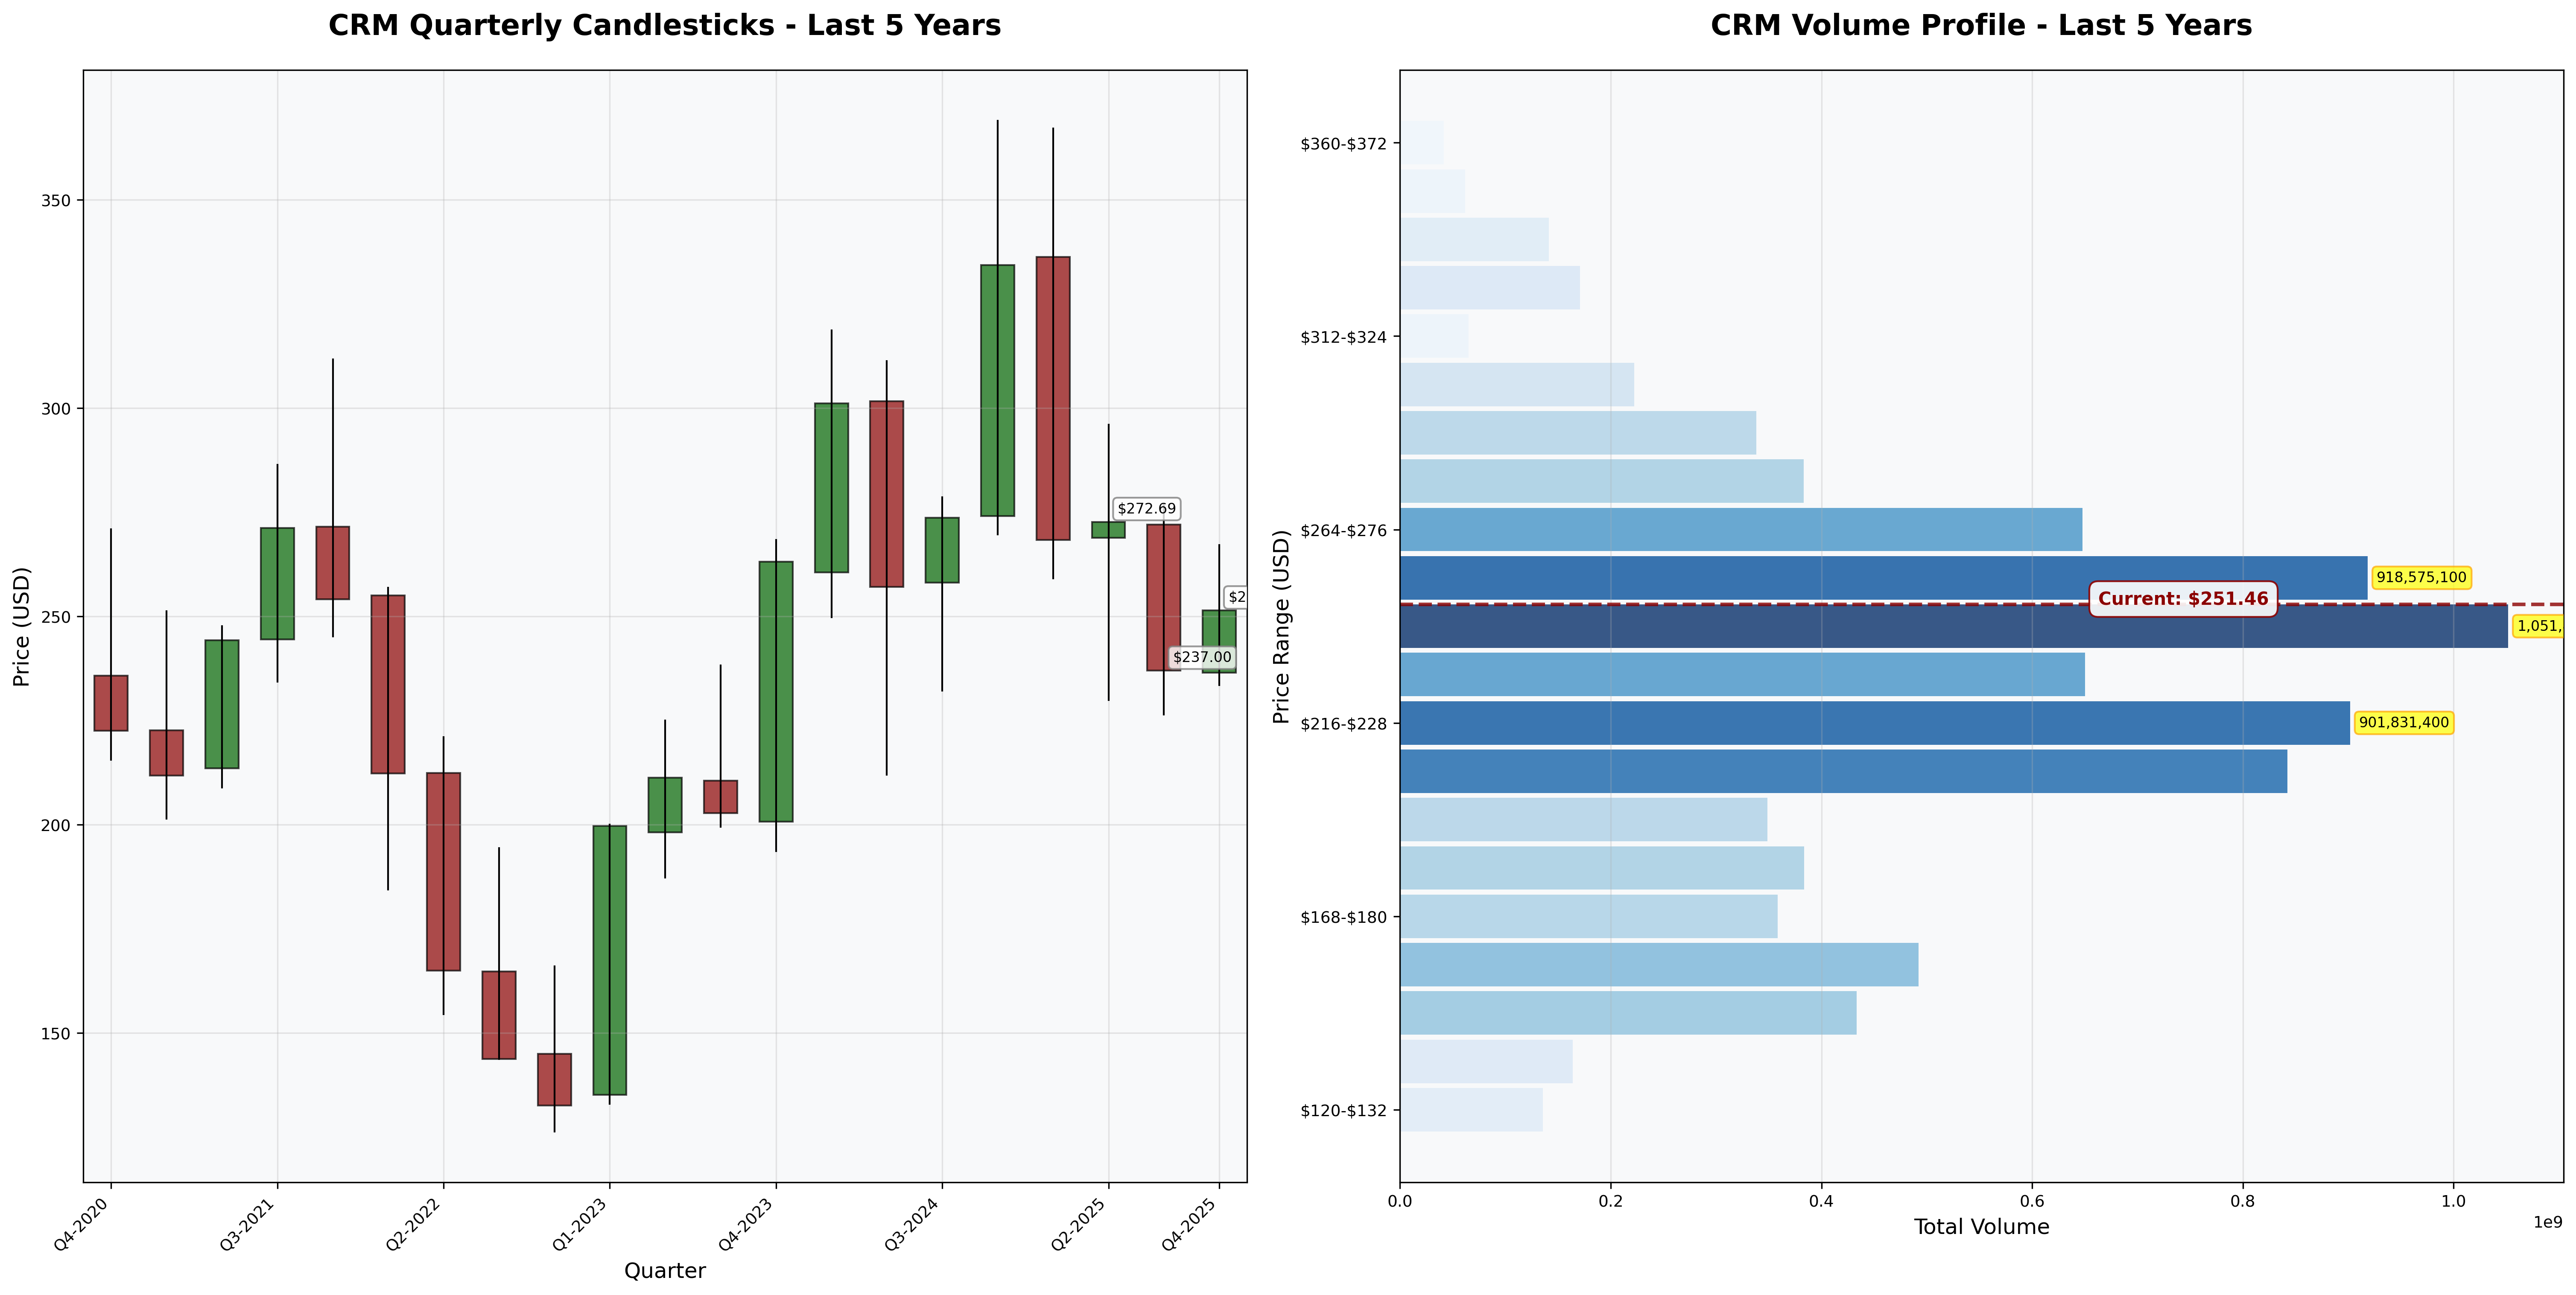
- Current Price: $251.46
- Estimated Intrinsic Value: $250-270
- Margin of Safety: ~0-5%
- Recommendation: HOLD (if owned) / WAIT (if buying)
Recommended Entry Zones:
- Aggressive Entry: < $210 (20%+ margin)
- Standard Entry: $210-$230 (15% margin)
- Hold/Avoid: > $245
Business Overview
What They Do (2-Minute Test)
Salesforce sells cloud-based customer relationship management (CRM) software to 150,000+ businesses. Companies use it to manage sales pipelines, customer service, marketing campaigns, and analytics. Customers buy because: (1) it’s mission-critical to daily operations, (2) their data lives in the system, (3) switching costs are prohibitive, (4) AppExchange ecosystem has 7,000+ integrated apps.
Competitive Position & Moat Analysis
Primary Moat Type: Switching Costs + Network Effects
Moat Strength: ⭐⭐⭐⭐½ (out of 5)
Key Moat Factors:
- Switching Costs: Migrating years of customer data, custom workflows, and trained users creates 6-12 month disruption risk nobody wants to take (95%+ retention)
- Ecosystem Lock-In: 7,000+ third-party apps on AppExchange create network effects—more apps attract more customers, which attracts more developers
- Data Gravity: Historical customer data becomes increasingly valuable and irreplaceable over time
- Scale Economies: 20% market share enables R&D investment ($6B annually) competitors can’t match
Moat Durability:
- Status: Stable—high switching costs are durable, but Microsoft Dynamics (Office 365 bundling) is gaining mid-market share
- Key Threat: AI disruption—if AI eliminates manual CRM data entry and enables simpler alternatives, moat narrows
Industry Dynamics
50-Year Outlook: CRM software will exist in some form—businesses always need customer data management. However, AI could radically simplify interfaces and reduce pricing power.
Key Trends:
- Cloud migration driving 10-12% annual CRM market growth
- AI integration (agents, automation, predictive analytics) becoming table stakes
- Market saturation in Fortune 500; growth depends on mid-market expansion and upselling
Quantitative Checklist
Defensive Investor Criteria:
| Criterion | Requirement | Actual | Pass/Fail |
|---|---|---|---|
| Earnings Stability | Positive 10 years | 10/10 years | ✅ |
| Dividend Record | Some payment | $0.40/share (0.16% yield) | ✅ |
| Earnings Growth | +33% in 10 years | +280% (2015-2025) | ✅ |
| P/E Ratio | < 15x | 36.5x | ❌ |
| P/B Ratio | < 1.5x | 4.1x | ❌ |
| P/E × P/B | < 22.5 | 149.7 | ❌ |
| Current Ratio | > 2.0 | 1.12 | ❌ |
| Debt vs NCA | Debt < NCA | Pass (net cash position) | ✅ |
Quantitative Score: 4/8 criteria met
Analysis: Salesforce fails Graham’s valuation filters (P/E, P/B) but passes business quality tests (earnings stability, growth, balance sheet strength). This is a high-quality business trading at a premium—acceptable for Buffett-style quality investing, unacceptable for Graham-style deep value.
Financial Analysis with Critical Assessment
Balance Sheet Strength
Key Metrics:
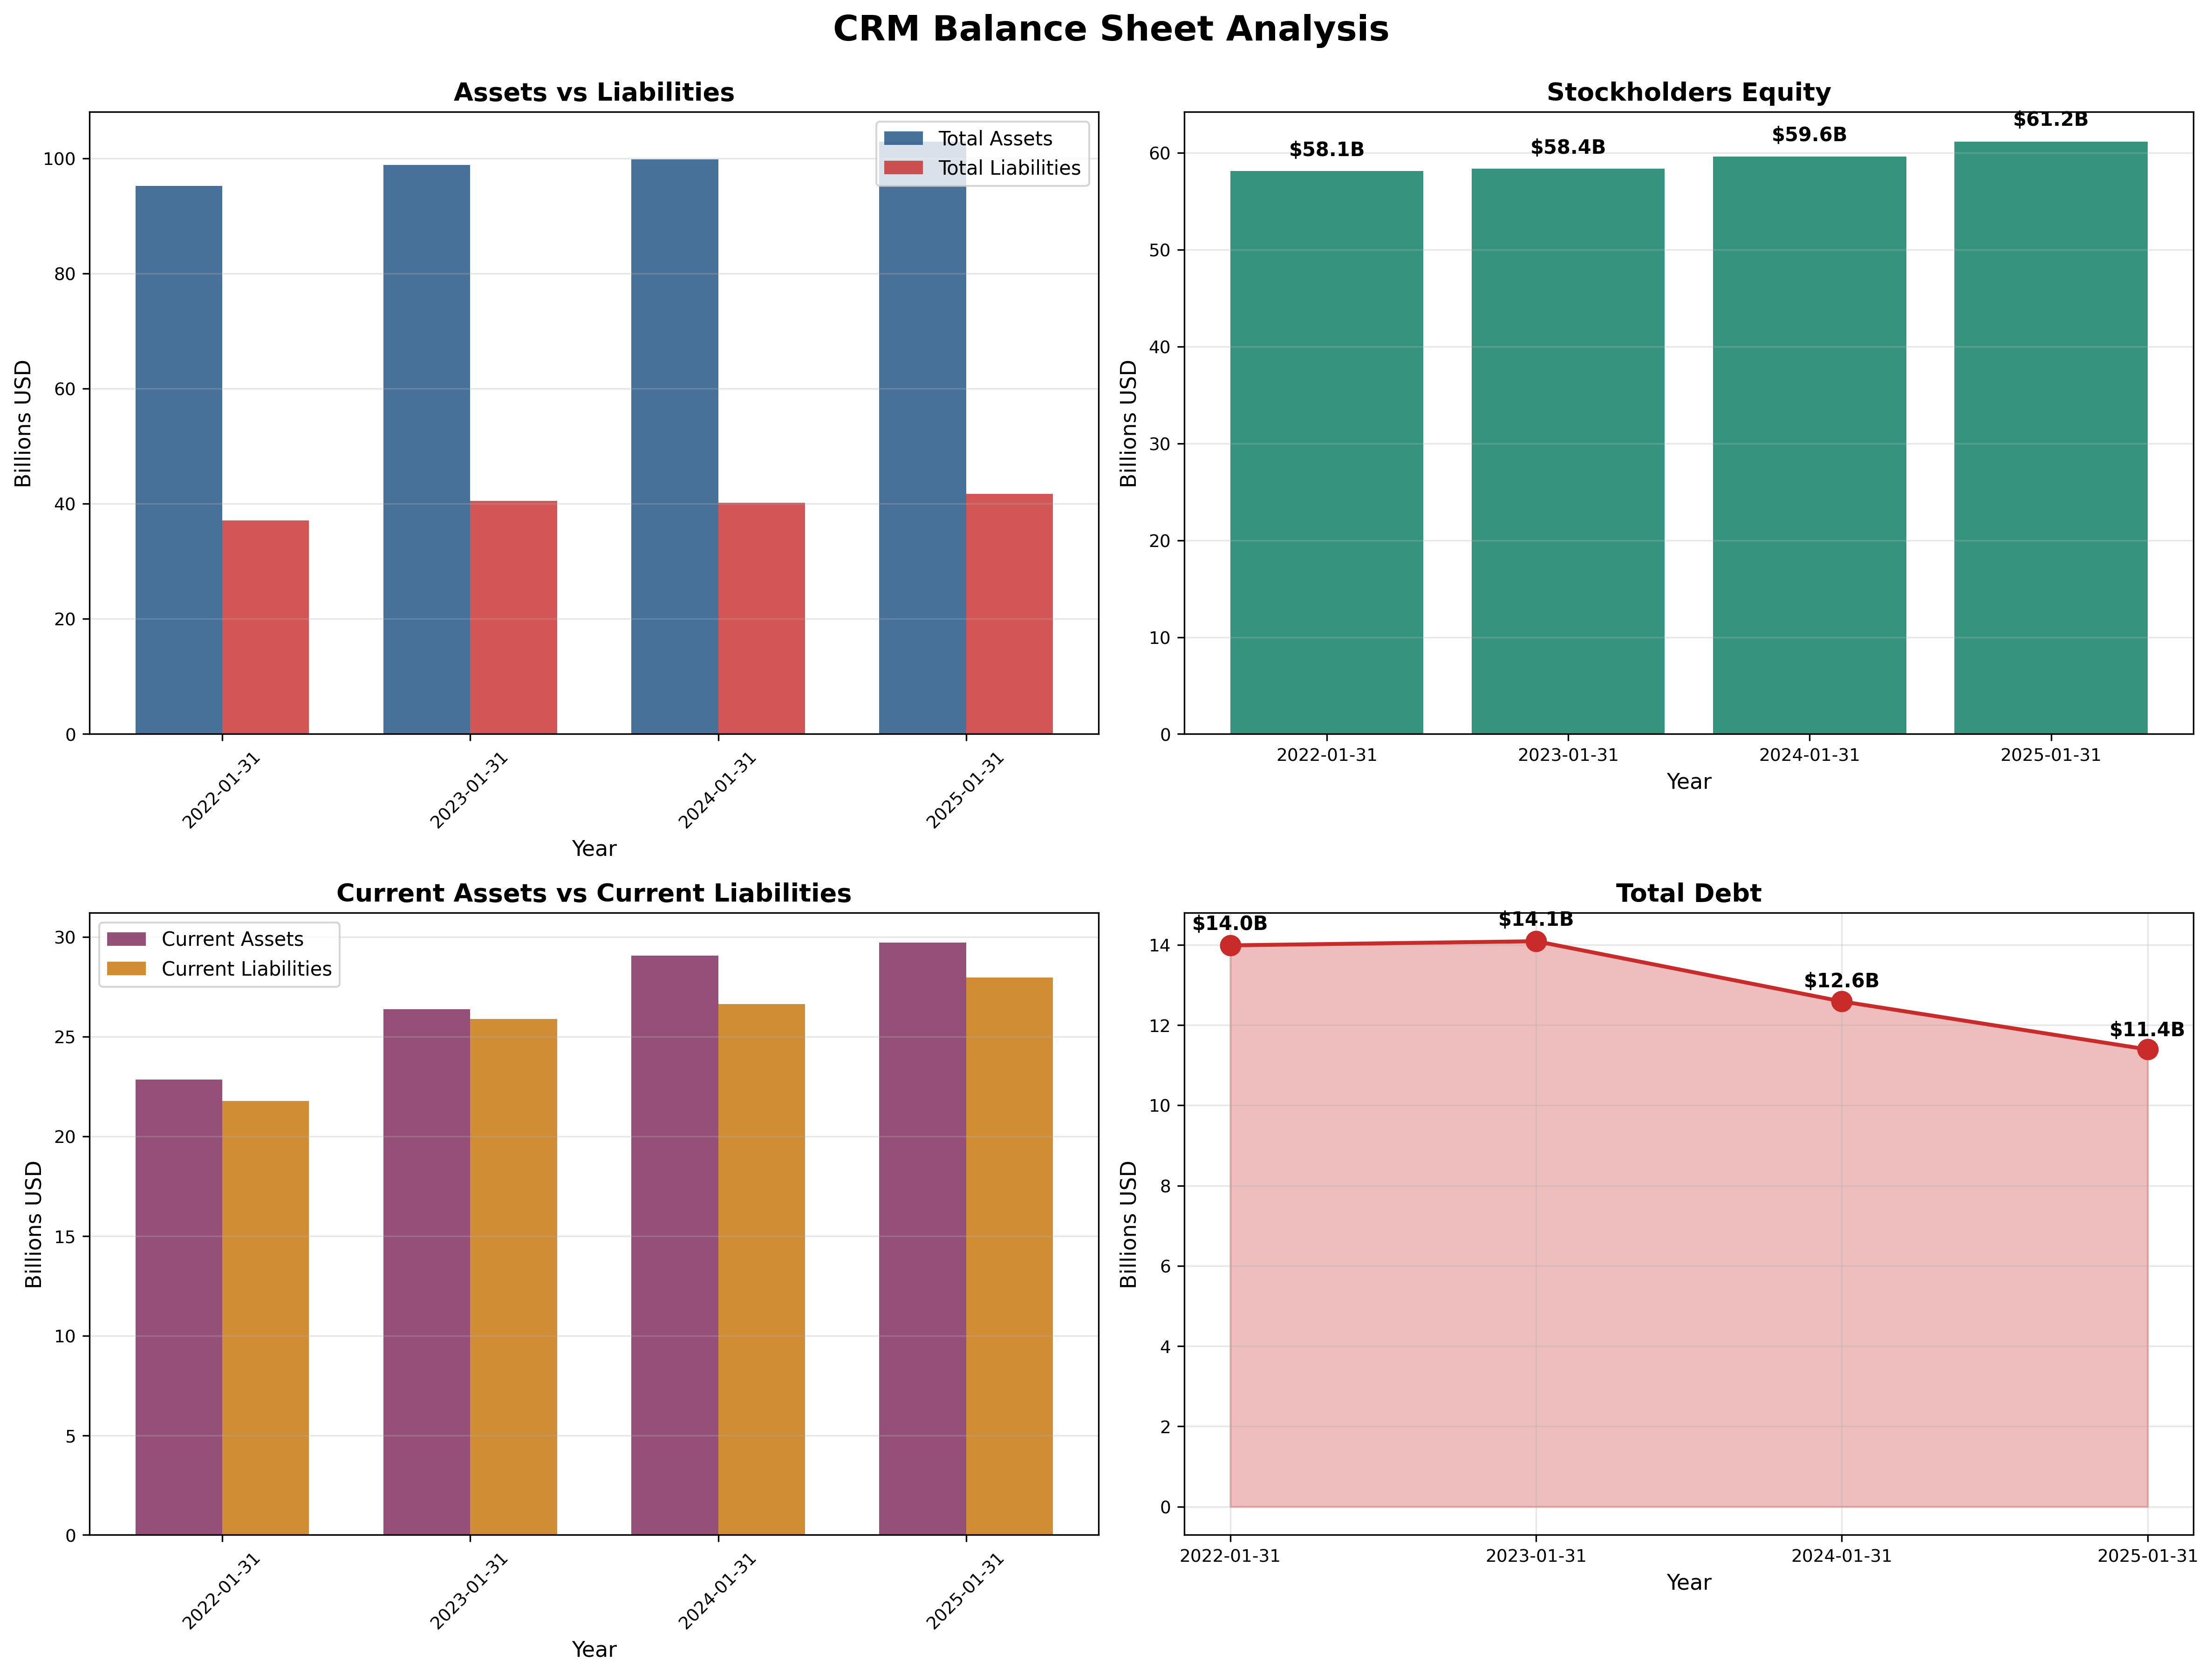
- Current Ratio: 1.12 (target > 2.0) - ❌ (acceptable for SaaS; deferred revenue inflates liabilities)
- Debt-to-Equity: 0.19 (target < 0.5) - ✅
- Interest Coverage: >10x (target > 5x) - ✅
- Net Cash: $2.5B (cash exceeds debt)
Assessment: Fortress balance sheet. Debt declining from $14B to $11.4B over three years. Only concern is $50B+ goodwill from acquisitions (Slack, Tableau)—if business deteriorates, impairment risk exists. Financial strength grade: A-
Earnings Quality & Consistency
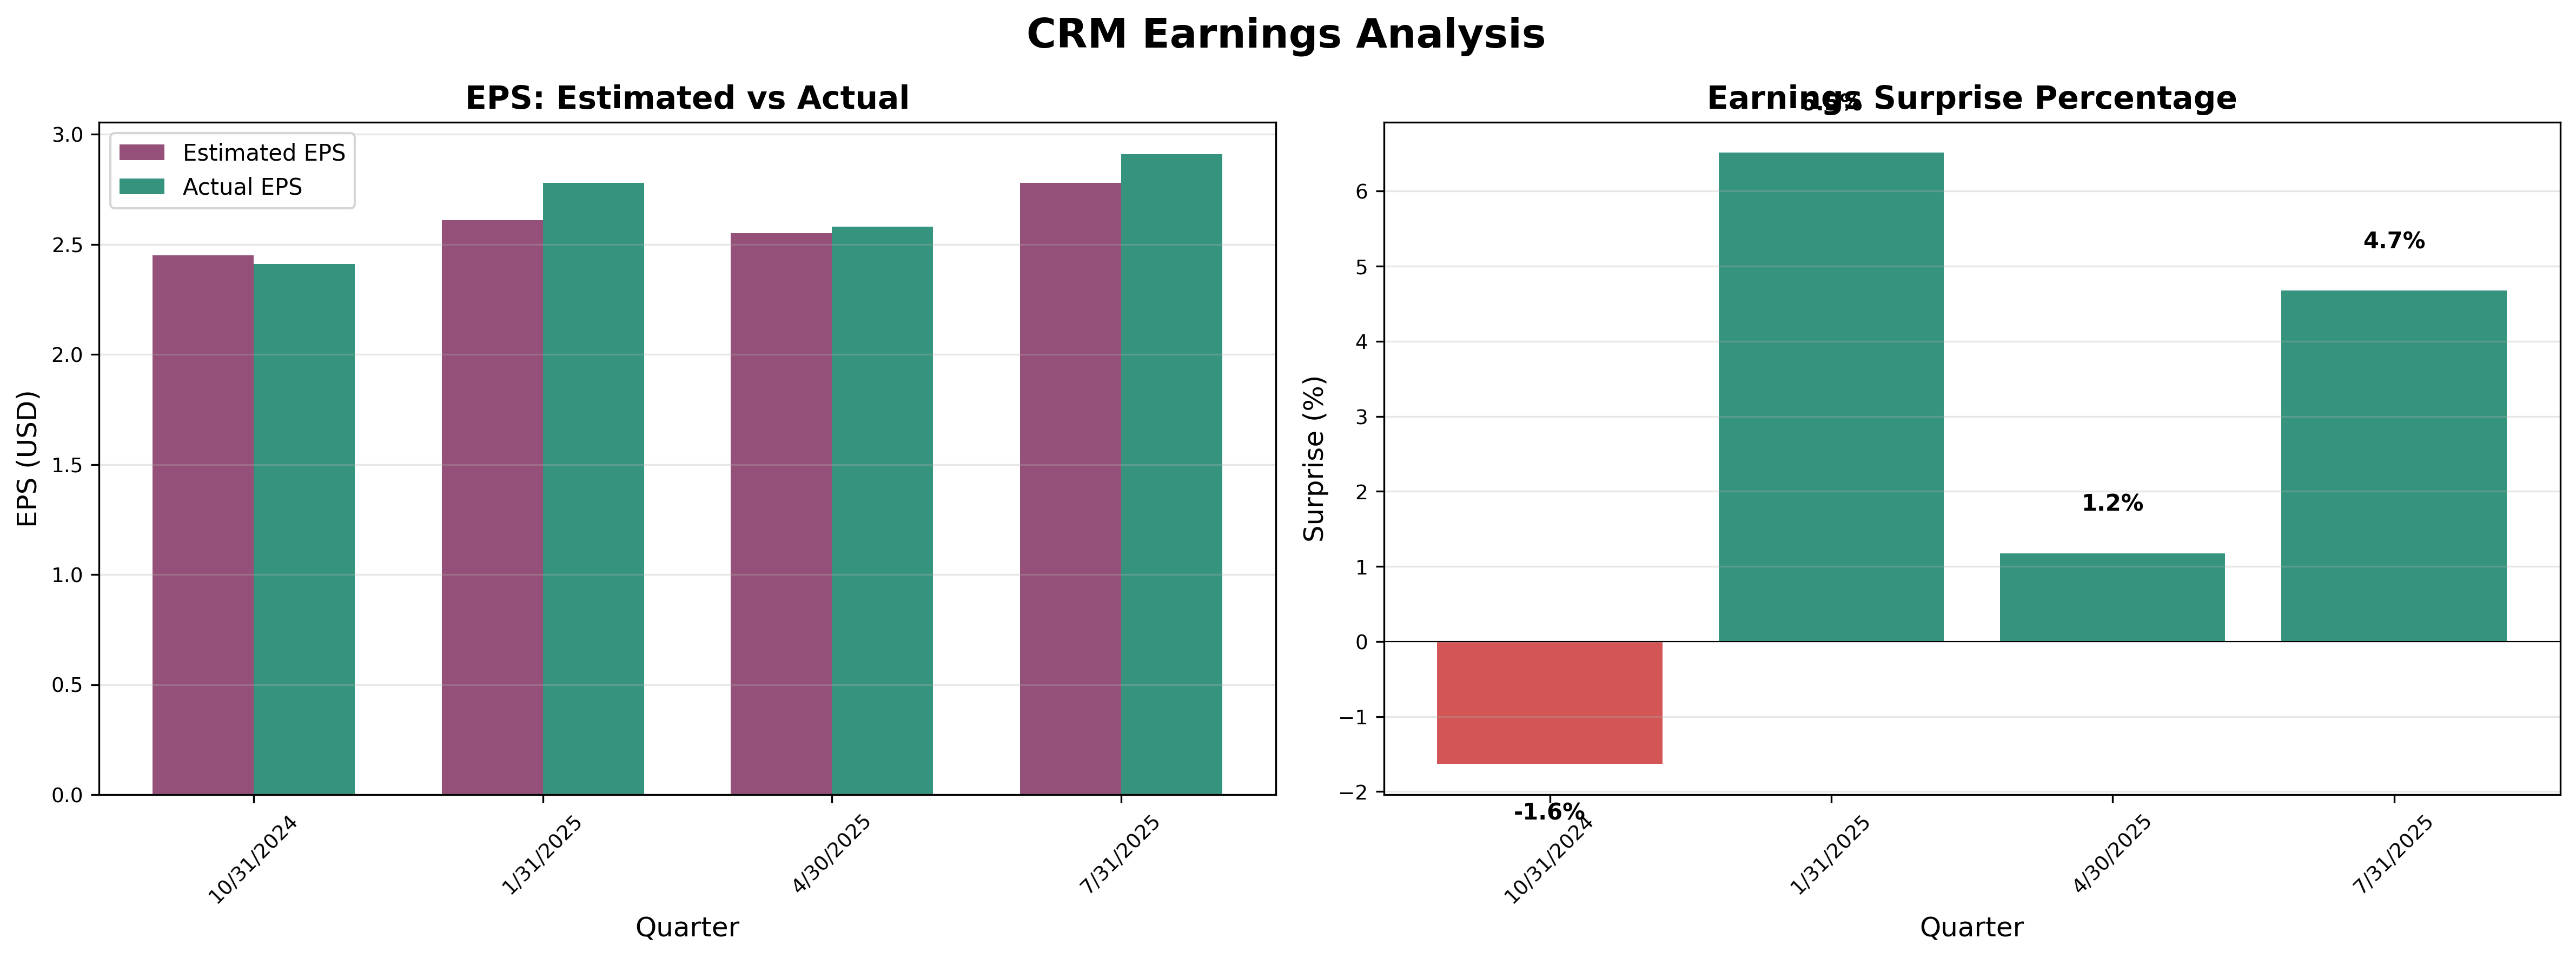
Stability Test: Positive earnings in 10/10 of past 10 years ✅
Owner Earnings Calculation:
Net Income:              $6.3B
+ D&A:                   $3.2B
- Maintenance Capex:    ($0.7B)
- Working Capital:      ($0.5B)
= Owner Earnings:        $8.3B
Owner Earnings Yield: 3.4% ($8.3B / $243B market cap)
Quality Assessment: Earnings quality is excellent—consistently beating expectations, no accounting gimmicks, strong cash conversion. However, 3.4% yield is below the 10% minimum value investors prefer, indicating full valuation.
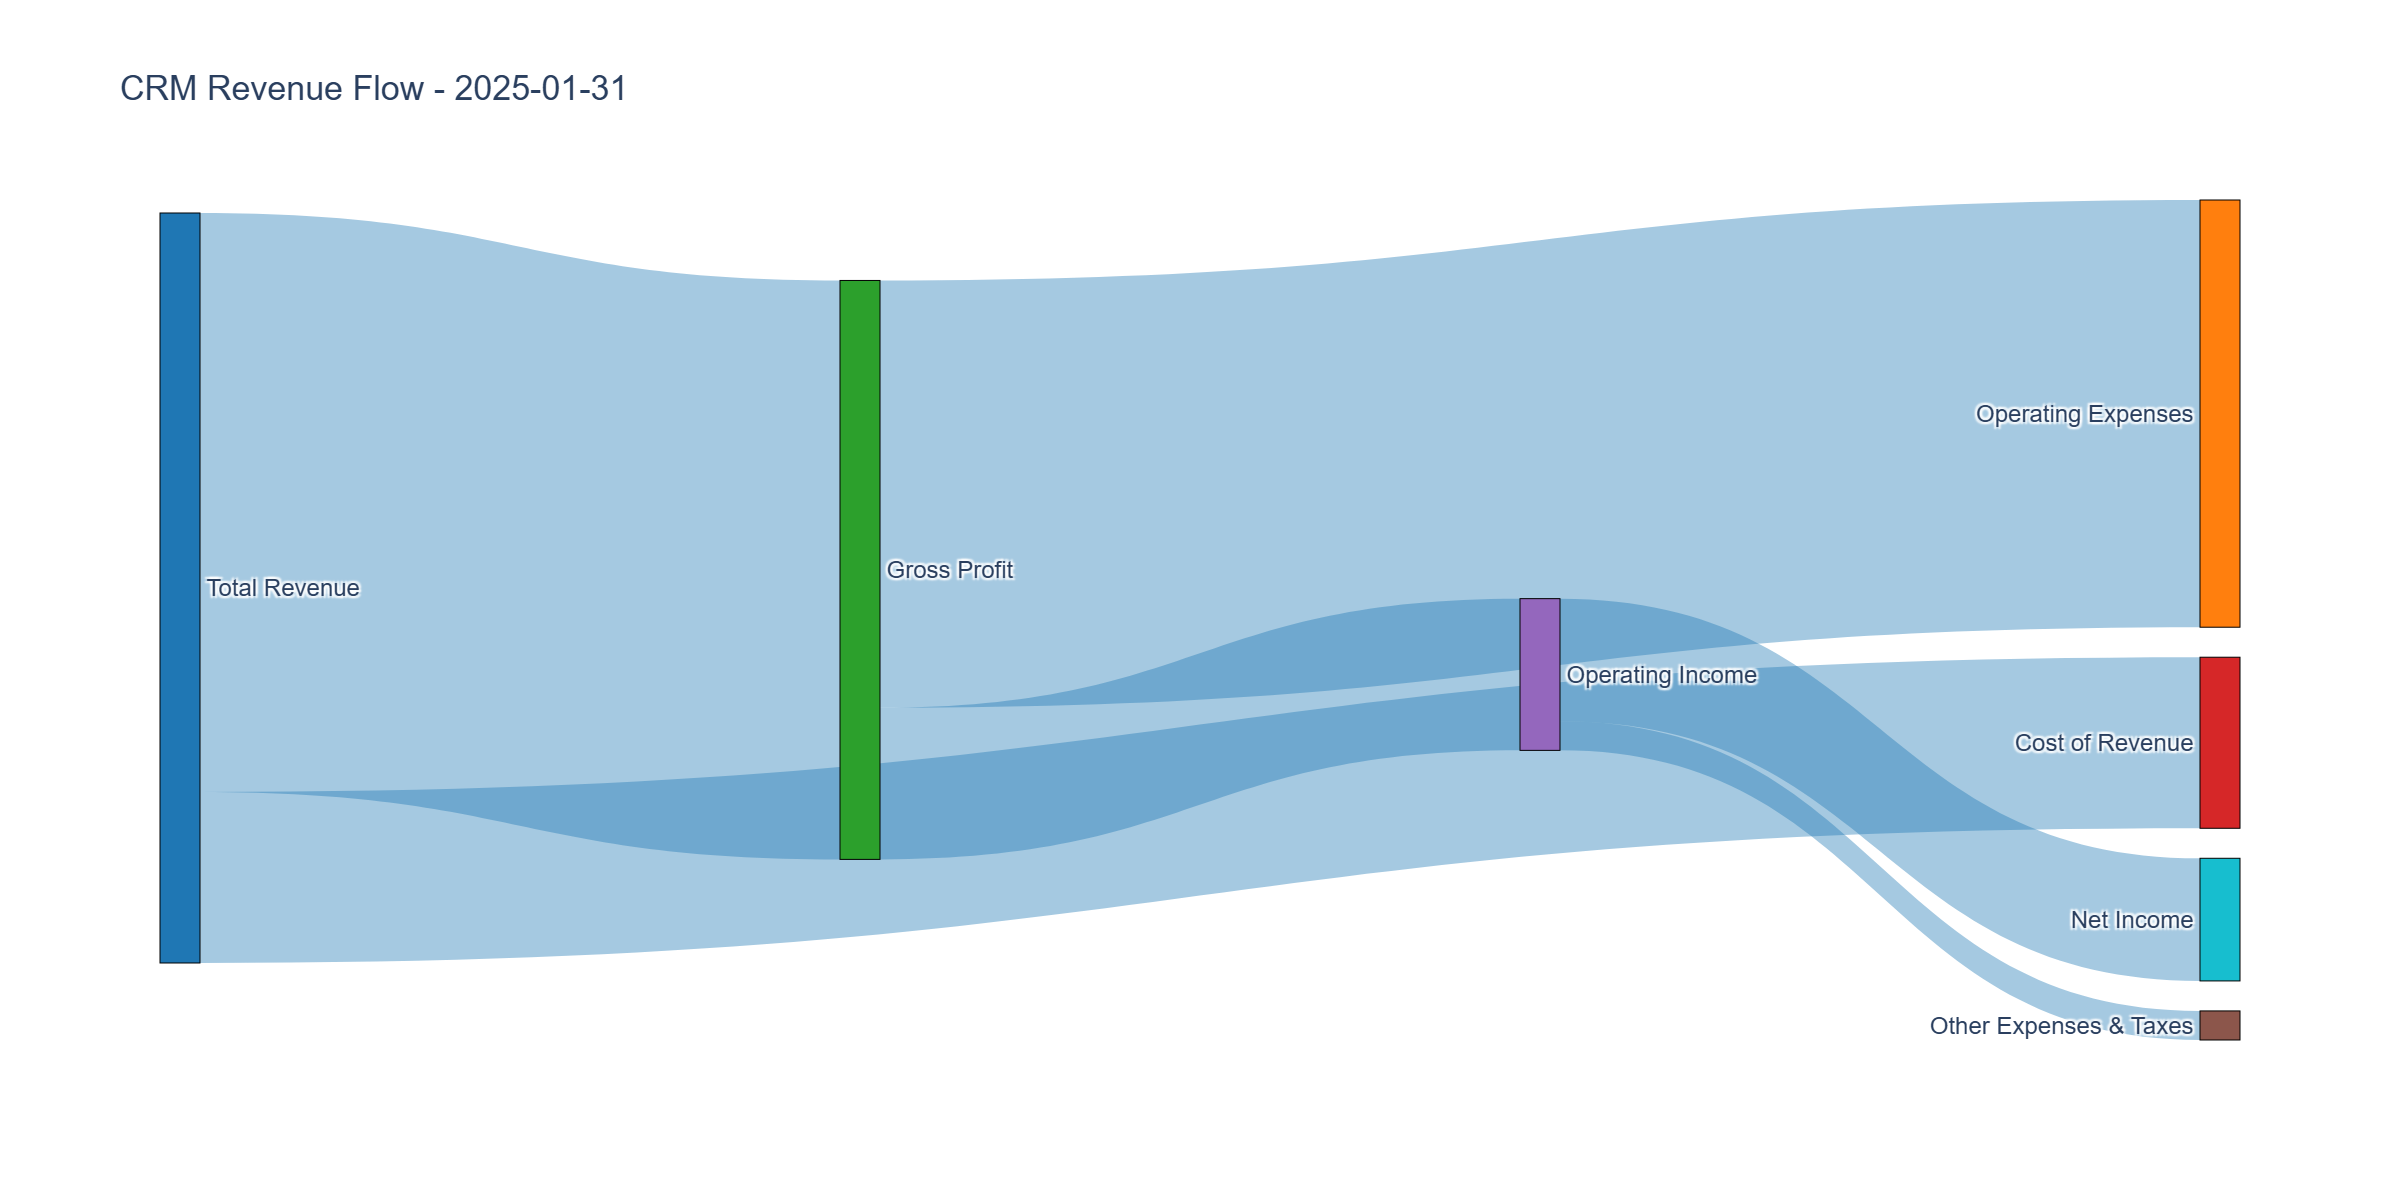
Income Statement Analysis
Key Metrics:
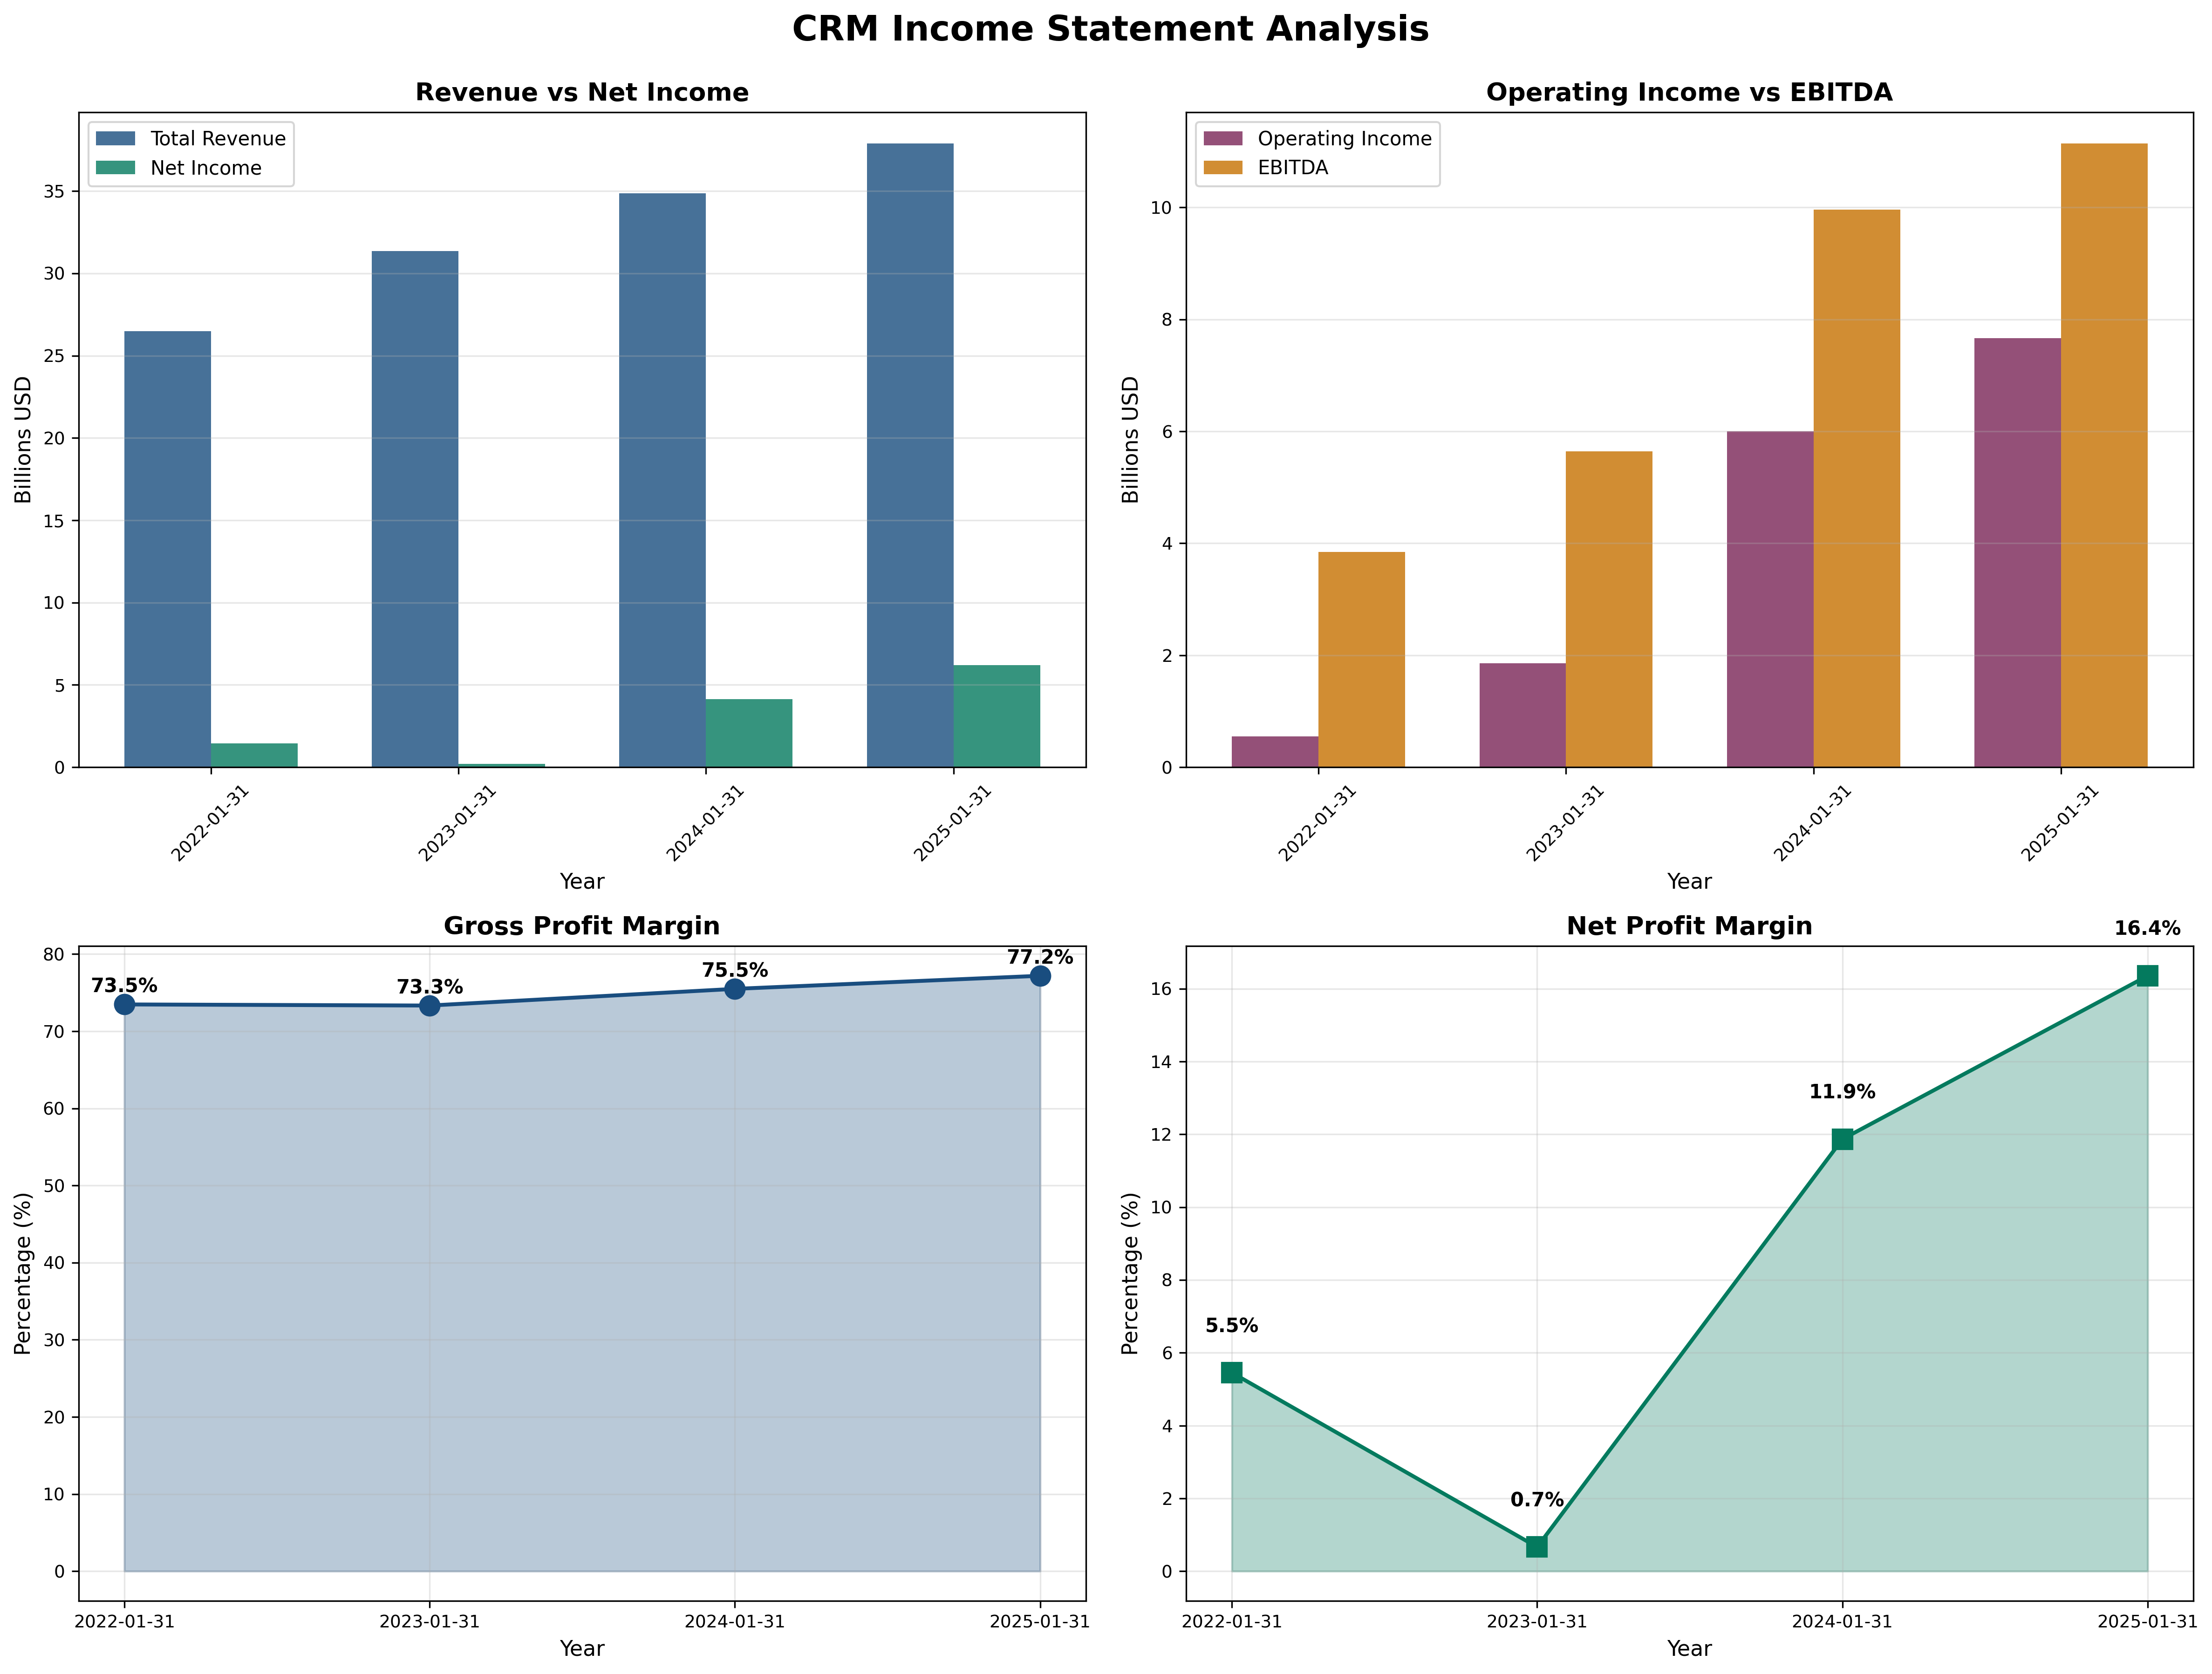
- Revenue Growth (5Y CAGR): 13% → slowing to 8% currently
- Gross Margin: 77% (trend: ↑ from 73%)
- Operating Margin: 20% vs Industry 15-20%
- Net Margin: 16% (improved from 1% in 2022)
Assessment: The headline story is margin expansion: operating margin exploded from 2% → 20% in three years following activist pressure. Management demonstrated ability to convert scale into profits. Risk: margins likely at peak (matches Microsoft, Adobe); further expansion unlikely. Slowing revenue growth (8%) raises questions about durability.
Cash Flow Generation
Key Metrics:
- OCF / Net Income: 2.0 (target > 1.0) ✅
- FCF Margin: 33% (elite territory)
- Capital Intensity: <2% of revenue (asset-light)
Assessment: This is where Salesforce shines. FCF grew from $5.3B → $12.4B (+134%) while revenue grew 45%—powerful operating leverage. Converting 33% of revenue to FCF ranks with Microsoft (40%) and Adobe (35%). Management using cash for debt reduction and modest buybacks.

Profitability Metrics
Returns:
- ROE: 11.2% (target > 15%) ❌ Improving trajectory; was 0.4% in 2023
- ROIC: ~15% (target > 12%) ✅
Assessment: Returns improving as margins expand but still below elite threshold. Asset-light model with minimal capital requirements is a structural advantage—every dollar of FCF is available for shareholders rather than reinvestment.

Financial Ratios Analysis
Valuation Multiples:
- P/E: 36.5x (vs. historical avg: 50x, industry: 30x)
- P/B: 4.1x (vs. historical avg: 5x)
- P/FCF: 19.6x (vs. historical avg: 25x)
- EV/EBITDA: 21.8x
PEG Ratio:
- P/E Ratio: 36.5
- Growth Rate: 8%
- PEG: 4.6 (>2.0 = overvalued)
Combined Metric:
- P/E × P/B = 149.7 (should be < 22.5 per Graham)
Analysis: By traditional metrics, CRM is expensive. PEG of 4.6 suggests paying too much for growth. However, P/FCF of 19.6x is reasonable for a business generating 33% FCF margins. The disconnect between P/E-based and cash flow-based valuations reflects earnings quality.

Capital Allocation Assessment
Management Quality Grade: B+
Key Factors:
- Insider Ownership: <5% (founder-led but modest ownership)
- Buyback Discipline: Inconsistent—bought high during peaks, not aggressive at lows
- Reinvestment ROIC: ~15% (solid)
- Red Flags: Yes—large acquisitions at peak valuations (Slack $27.7B, Tableau $15.7B) with mixed ROI; recent insider selling ($19M sold vs $865K purchased)
Assessment: Marc Benioff built an exceptional franchise and demonstrated operational discipline (margin expansion) but has overpaid for acquisitions at market peaks. The Slack acquisition looks questionable in hindsight. Recent margin focus is encouraging but capital allocation on M&A remains a concern.
Valuation & Intrinsic Value
Multiple Methods Summary:
| Method | Intrinsic Value | Weight | Rationale |
|---|---|---|---|
| DCF (10% discount rate) | $265 | 40% | Appropriate for predictable FCF |
| P/FCF (22x fair multiple) | $282 | 30% | Reflects elite cash generation |
| PEG-Based (assuming 1.5 fair) | $185 | 10% | Too conservative for quality |
| Graham Formula (8.5+2g) | $169 | 20% | Floor value for deep value |
Weighted Intrinsic Value: $255
Valuation Range:
- Conservative: $220 (worst case scenario)
- Base Case: $255 (most likely)
- Optimistic: $285 (best case with re-acceleration)
Current Price: $251.46 Margin of Safety: ~1% vs Base Case
Verdict: Trading at approximate fair value with minimal margin of safety.
Risk Assessment
Key Risks (Top 3)
Revenue Growth Deceleration: Growth slowing to 8% makes 36x P/E difficult to justify—if growth falls below 5%, multiple compression could drive 20-30% decline even with stable earnings.
AI Disruption: AI could enhance CRM (Salesforce’s bet with Einstein) or eliminate need for manual CRM systems entirely—new AI-native platforms could disrupt within 5-10 years.
Margin Sustainability: Operating margins expanded 2% → 20%; likely at peak with limited further expansion—any contraction from competition or AI investment would disappoint expectations.
Worst Case Scenario: Growth slows to 3-5%, margins compress to 15%, multiple falls to 25x P/E → fair value drops to $150-170 (40% downside risk).
Market Sentiment
Current Sentiment: Neutral—stock range-bound between $216-372 over past year, no euphoria or panic.
Contrarian Signal: Not a contrarian opportunity. No maximum pessimism creating buying opportunity; equally, no euphoria suggesting selling urgency. Market correctly prices this as a good business at fair value.
Investment Recommendation
Current Assessment
Valuation: PEG = 4.6 | P/E = 36.5x vs Industry 30x Verdict: Fair Value to Slightly Overvalued
Margin of Safety: ~1% ❌ Insufficient
Entry Zones
| Zone | Price | Action | Margin |
|---|---|---|---|
| 🟢 Strong Buy | < $210 | Accumulate | 20%+ margin |
| 🟡 Buy | $210-$230 | Build position | 10-20% margin |
| 🟠 Hold | $230-$280 | Hold existing | 0-10% margin |
| 🔴 Avoid/Trim | > $280 | Reduce exposure | Overvalued |
Current Price: $251.46 → Recommendation: HOLD / WAIT
Expected Returns
- Bull Case (+15% annually): Revenue growth re-accelerates to 10%, margins hold at 20%, multiple expands to 30x on FCF basis
- Base Case (+7% annually): 8% revenue growth, stable margins, flat multiple—returns match earnings growth
- Bear Case (-20% over 2 years): Growth slows to 5%, margin compression to 17%, multiple contracts to 28x
Final Investment Conclusion
Overall Grade: B+ (A- Business × B Valuation)
Category Scores:
- Business Quality: 9/10 (wide moat, market leader, mission-critical)
- Financial Strength: 9/10 (fortress balance sheet, elite FCF generation)
- Management Quality: 7/10 (operational excellence, questionable M&A)
- Valuation: 5/10 (fair price, minimal margin of safety)
- Margin of Safety: 3/10 (essentially zero)
Final Verdict: HOLD (if owned) / WAIT (if buying)
Investment Thesis Summary
Business Quality: Salesforce is a canonical example of a wide-moat business—switching costs, ecosystem network effects, and data gravity create powerful retention. The operational transformation (2% → 20% margins) proves management can capitalize on scale when focused. However, at $38B revenue growing 8%, this is a maturing stalwart, not a fast grower.
Valuation: At 37x earnings with 8% growth, you’re paying full price for quality. PEG of 4.6 screams “expensive” by any growth metric. The saving grace is 33% FCF margins generating $12B+ annually—if you value cash flow over earnings, 20x FCF is more palatable. Still, minimal margin of safety means you’re buying at fair value, not at a discount.
Risks: Three material concerns: (1) growth deceleration below 5% would destroy valuation, (2) AI could disrupt CRM moats within 5-10 years, (3) margins likely at peak. The worst-case scenario—growth stalls, margins compress, multiple contracts—could result in 30-40% permanent capital loss.
Action: If you own it, hold—business quality justifies continued ownership at fair value. Set alerts to add aggressively at $210 (20% margin of safety). If buying new, be patient. This stock will offer better entries during market volatility. Set limit orders at $230 (quarter position), $215 (quarter position), $200 (half position). For 10+ year buy-and-hold investors willing to accept modest near-term returns, a small position (1-2%) is defensible but recognize you’re paying fair freight.
Framework Checklist
- ❌ Quantitative: Minimal margin of safety (~1%)
- ✅ Moat: Durable competitive advantage from switching costs and ecosystem
- ⚠️ Management: Operational discipline excellent; M&A track record mixed
- ❌ Contrarian: Not buying during pessimism; market fairly pricing quality
- ✅ Simplicity: Easy to explain—cloud CRM software with customer lock-in
Would I hold this for 10+ years if the market closed tomorrow?
Yes, but only at $210-230. At $251, I’d want better value elsewhere. Salesforce will compound nicely over decades, but starting valuation matters. The discipline of value investing is waiting for great businesses at great prices, not good businesses at fair prices. Wait for your pitch.
Interactive Visualizations
Disclaimer: This analysis is for educational purposes only and is not investment advice. Conduct your own due diligence and consult a qualified financial advisor.
Analysis Date: November 1, 2025
Current Price: $251.46
Intrinsic Value Range: $250-270
Recommendation: HOLD / WAIT
Target Entry: $210-$230
Time Horizon: 5-10+ years