Executive Summary
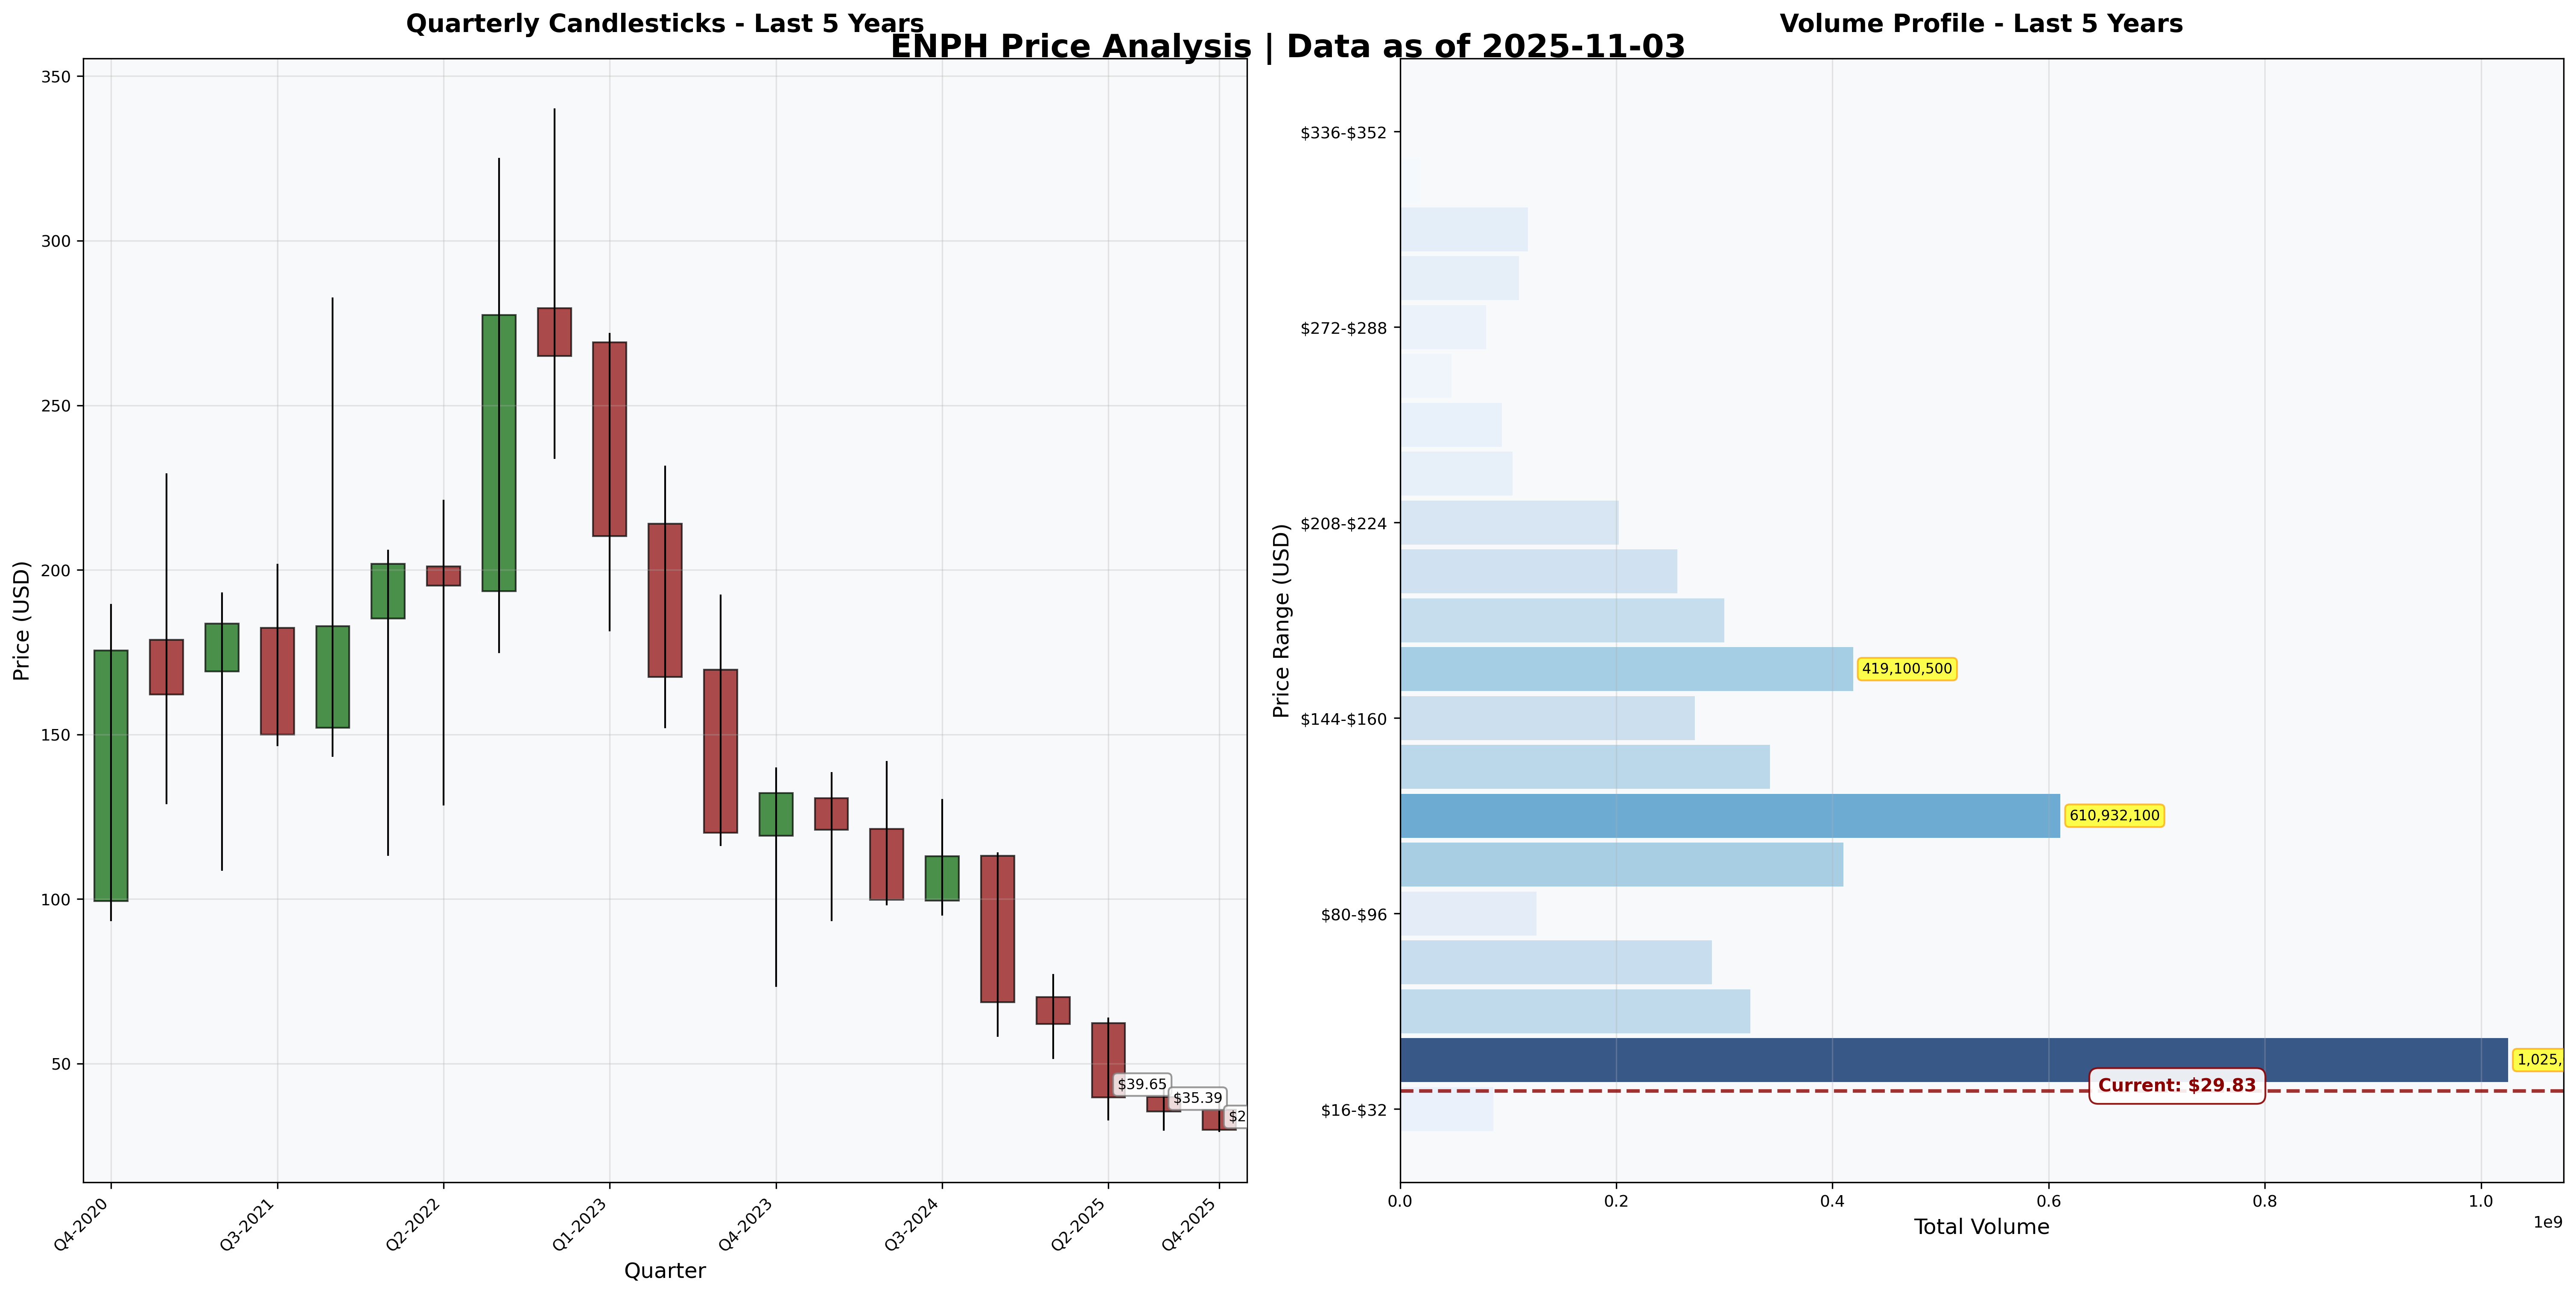
Investment Thesis: Enphase pioneered microinverter technology, converting solar panel DC power to AC at the panel level rather than centrally. The company dominates residential solar with 50%+ U.S. market share, offering superior safety, reliability, and monitoring. However, the solar industry crater—California NEM 3.0 gutted residential economics, interest rate shock killed financing, inventory glut from 2022 bubble—drove revenue down 43% ($2.3B → $1.3B) and stock down 90% ($340 → $30). At current valuation (P/FCF 8.1x, P/E 20x after 60% margin compression), this exhibits classic “maximum pessimism” characteristics. The question: cyclical bottom or structural decline?
Business Classification: Cyclical (solar demand tied to policy, rates, housing)
Current Valuation Assessment:
- Current Price: $29.83
- Estimated Intrinsic Value: $35 - $75
- Margin of Safety: +17% to +150% (IF cycle recovers)
- Recommendation: BUY (for aggressive value investors comfortable with cyclical risk)
Recommended Entry Zones:
- 🟢 Strong Buy: < $32 (current range, maximum pessimism)
- 🟡 Buy: $32 - $42 (early cycle recovery)
- 🟠 Hold: $42 - $65 (mid-cycle fair value)
- 🔴 Trim: > $75 (late cycle euphoria returning)
Business Overview
What They Do (2-Minute Test)
Enphase makes microinverters—small boxes mounted under each solar panel that convert DC electricity to AC for home use. Traditional systems use one big inverter for the entire array; Enphase puts intelligence at every panel. Benefits: (1) No single point of failure—if one panel is shaded, others work fine, (2) Panel-level monitoring and optimization, (3) Safety—no high-voltage DC on roofs. They also sell batteries (IQ Battery) for energy storage and software (Enlighten app) for system monitoring. Revenue model: Sell equipment to installers who bundle into residential solar installations. The residential solar cycle drives everything—policy changes (NEM 3.0), interest rates, housing market all impact demand.
Competitive Position & Moat Analysis
Primary Moat Type: Switching Costs + Network Effects + Cost Advantages
Moat Strength: ⭐⭐⭐⭐☆ (4 out of 5)
Key Moat Factors:
- Installer ecosystem lock-in: 2,000+ certified installers trained on Enphase systems; switching to SolarEdge/competitors requires retraining and losing monitoring platform integration
- Homeowner network effects: Enlighten app has 3.8M+ systems connected; installers prefer Enphase because homeowners know the brand and trust the platform
- Scale cost advantages: 75M+ microinverters shipped create procurement and manufacturing leverage; competitors struggle to match $40-50 unit economics
- Reliability reputation: <0.05% failure rate over 25-year warranty creates barrier—competitors with higher failure rates lose trust
Moat Durability:
- Widening: Battery attachment rate increasing (15% → 25%+), international expansion (Europe growing), service revenue emerging
- Narrowing: Technology commoditizing—Chinese competitors (Hoymiles, APSystems) offering 60% of Enphase price with “good enough” quality; string inverters improving with module-level power electronics (MLPEs)
Moat Threat: If solar becomes commoditized commodity (like TVs), price becomes only differentiator. Chinese manufacturers could compress margins from current 47% gross to 30-35% structural. Battery storage might be where value migrates, but competition intensifying (Tesla Powerwall, Generac).
Industry Dynamics
50-Year Outlook: Solar is inevitable—costs approaching zero, climate mandates accelerating. However, residential solar faces headwinds: NEM policies reducing payback, distributed generation threatening utility economics (leading to hostile policies), battery storage making grid defection viable. Winners will be vertically integrated solutions (solar + battery + EV charging + software), not standalone equipment vendors.
Key Trends: NEM 3.0 (California) slashed solar economics by 75%. High interest rates killing solar financing (PACE loans, leases). Inventory correction in progress—2024 was destocking year. IRA tax credits supporting commercial but not enough to offset residential weakness. Battery attach rates rising but margins lower than microinverters.
Quantitative Checklist
Defensive Investor Criteria:
| Criterion | Requirement | Actual | Pass/Fail |
|---|---|---|---|
| Earnings Stability | Positive 10 years | 8/10 years | ⚠️ |
| Dividend Record | Some payment | $0/share | ❌ |
| Earnings Growth | +33% in 10 years | +800% | ✅ |
| P/E Ratio | < 15x | 20.4x | ❌ |
| P/B Ratio | < 1.5x | 3.92x | ❌ |
| P/E × P/B | < 22.5 | 80.0 | ❌ |
| Current Ratio | > 2.0 | 3.53x | ✅ |
| Debt vs NCA | Debt < NCA | $1.3B vs $1.6B | ✅ |
Quantitative Score: 4/9 criteria met
Analysis: ENPH passes growth and balance sheet tests but fails valuation tests. P/E of 20x seems expensive but reflects depressed earnings (trailing, not forward). Current ratio of 3.5x is excellent—company has liquidity cushion. Debt of $1.3B vs $1.6B net current assets provides safety margin. The 800% earnings growth over 10 years proves this is a cyclical grower, not slow stalwart. Graham would note this is NOT defensive investment—it’s cyclical requiring business judgment. The current ratio and balance sheet strength provide margin of safety absent in typical cyclicals.
Financial Analysis with Critical Assessment
Balance Sheet Strength
Key Metrics:
- Current Ratio: 3.53 (target > 2.0) ✅ Excellent
- Debt-to-Equity: 1.24 (target < 0.5) ⚠️ Moderate leverage
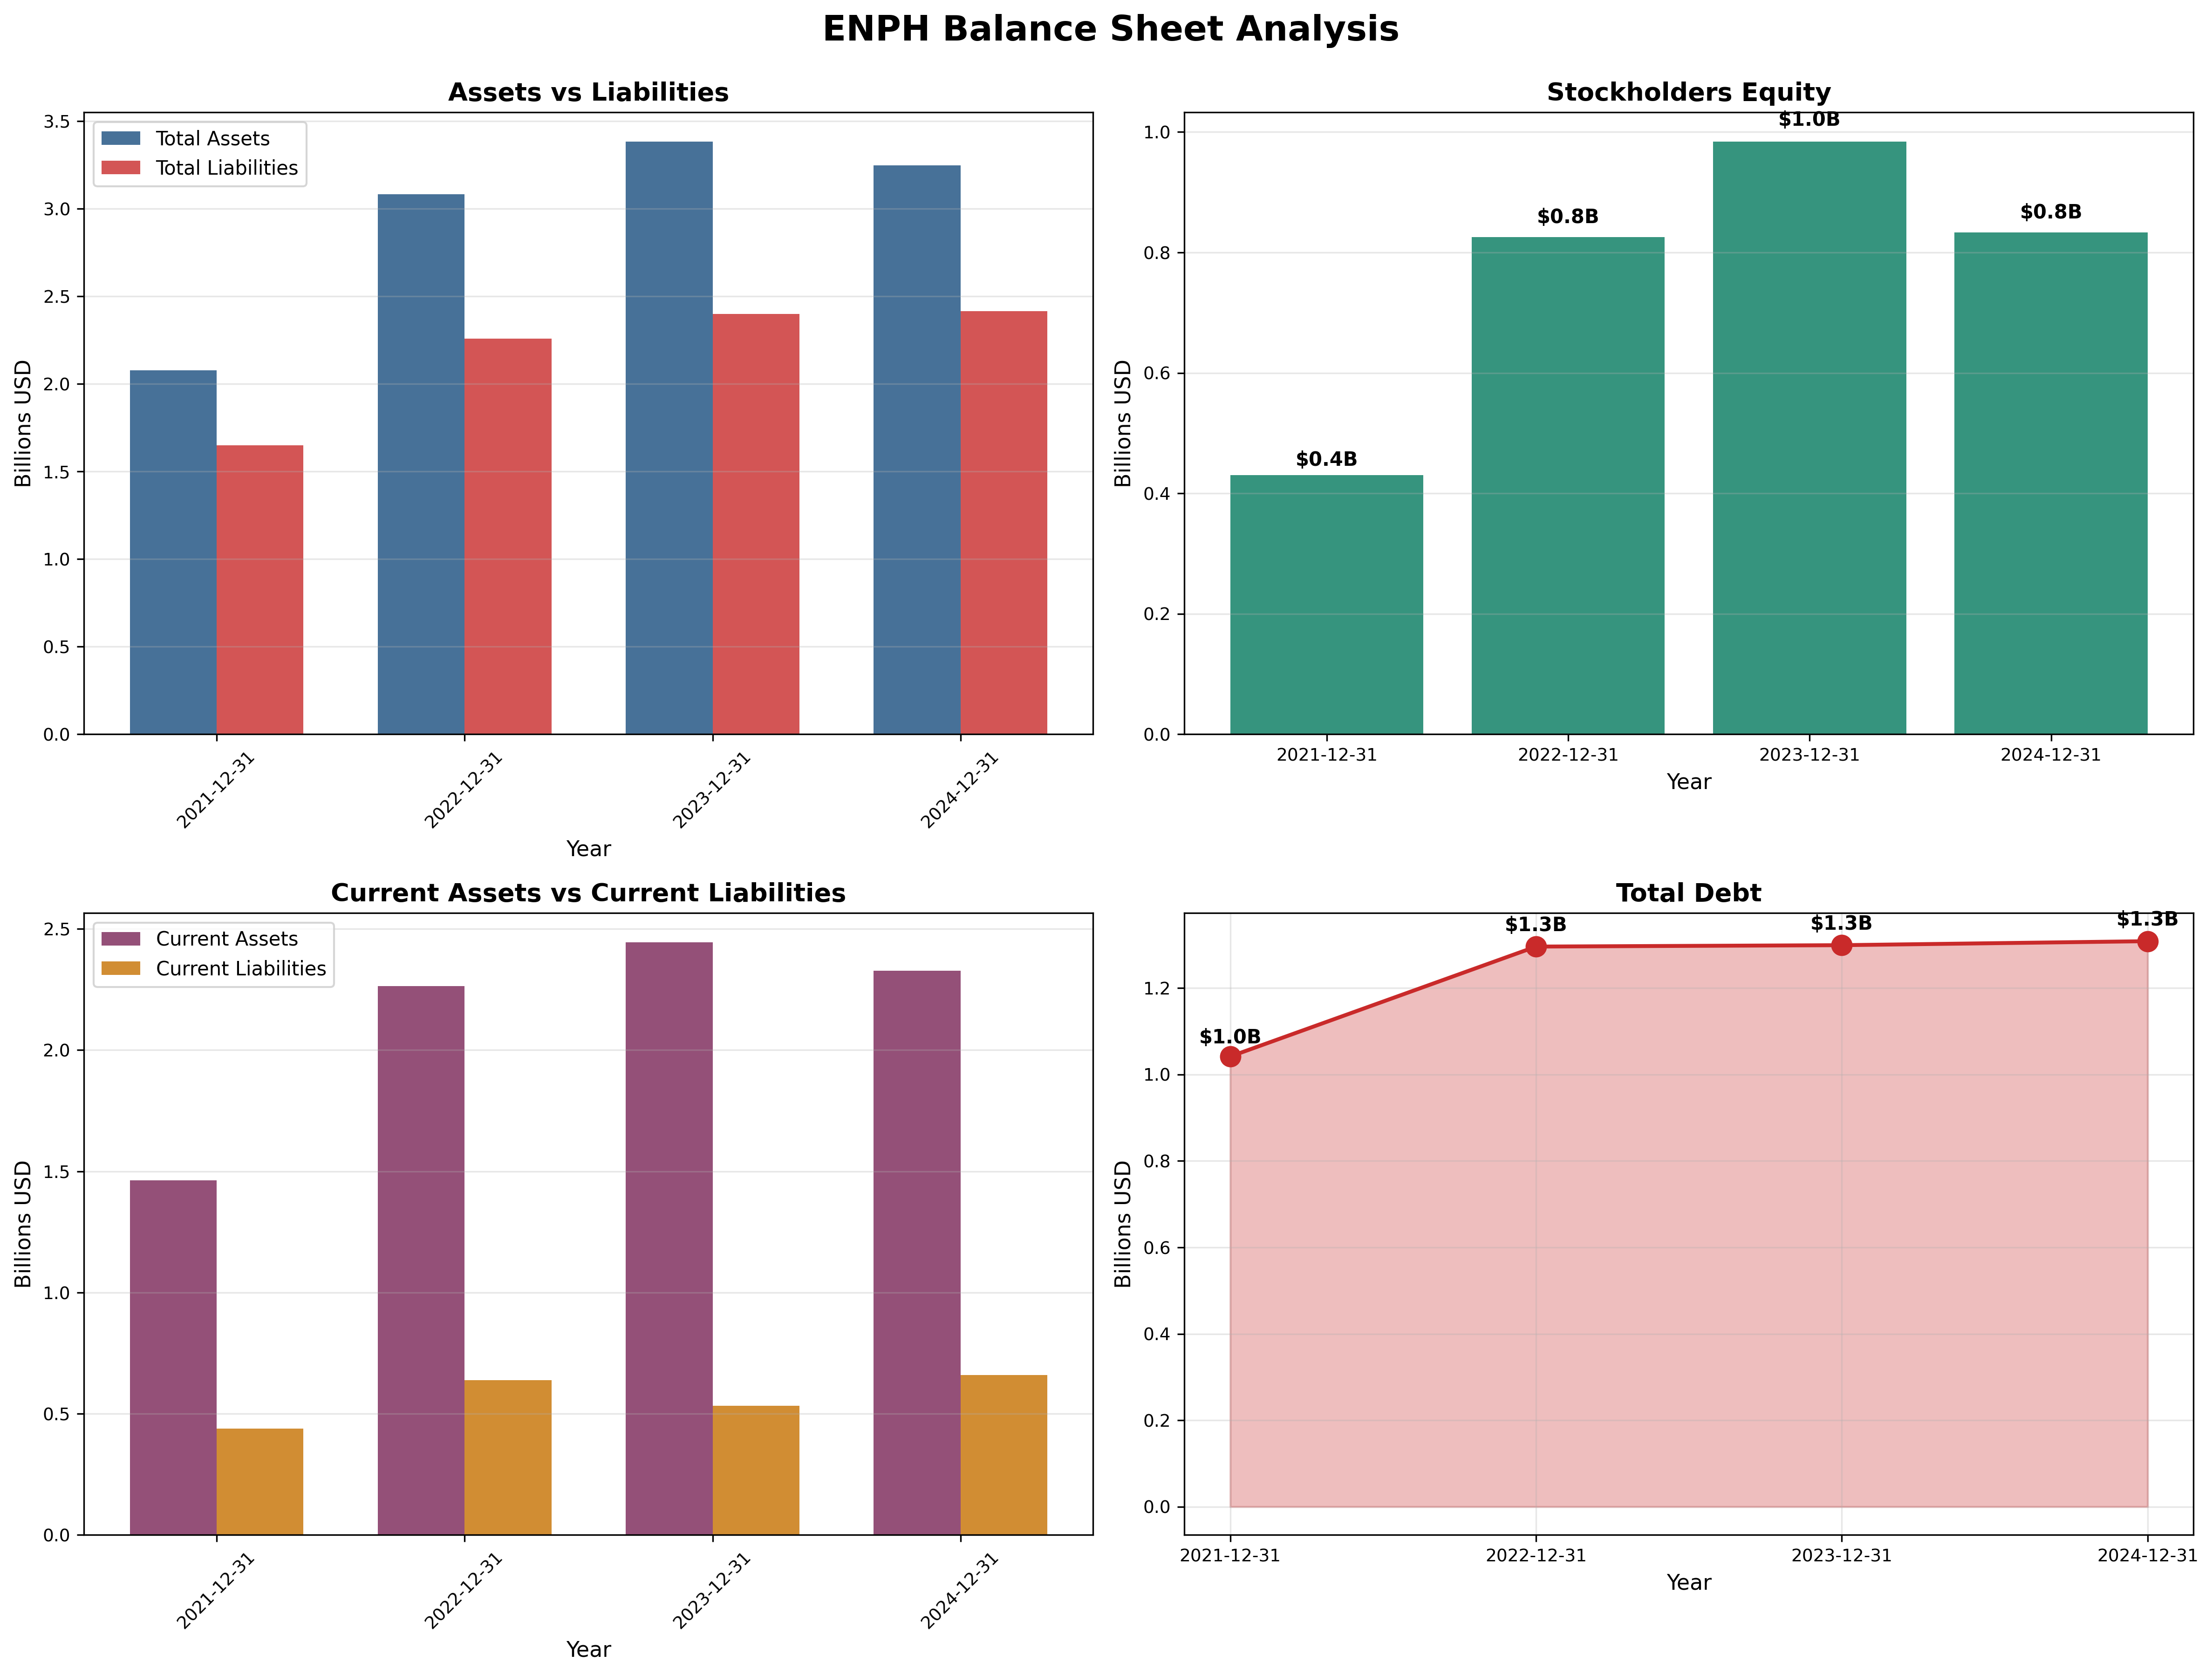
- Total Debt: $1.3B vs Equity $0.8B
- Cash: $0.5B
- Working Capital: $1.6B Substantial cushion
Assessment: The balance sheet is solid—current ratio of 3.5x and $1.6B working capital provide substantial liquidity cushion through the downturn. Total debt of $1.3B is manageable at 1.24x equity, particularly given $0.5B FCF generation even in terrible 2024. Assets grew from $2.1B to $3.3B (2021-2024) despite revenue collapse, reflecting inventory build (that became problem). The equity shrinkage from $1.0B (2023) to $0.8B (2024) reflects losses and buybacks. This is not a fortress but adequate for cyclical downturn. Bankruptcy risk: Low (<5% probability) given liquidity and positive FCF.
Earnings Quality & Consistency
Stability Test: Positive earnings in 8/10 of past 10 years ⚠️ (Early years had losses, profitable since 2019)
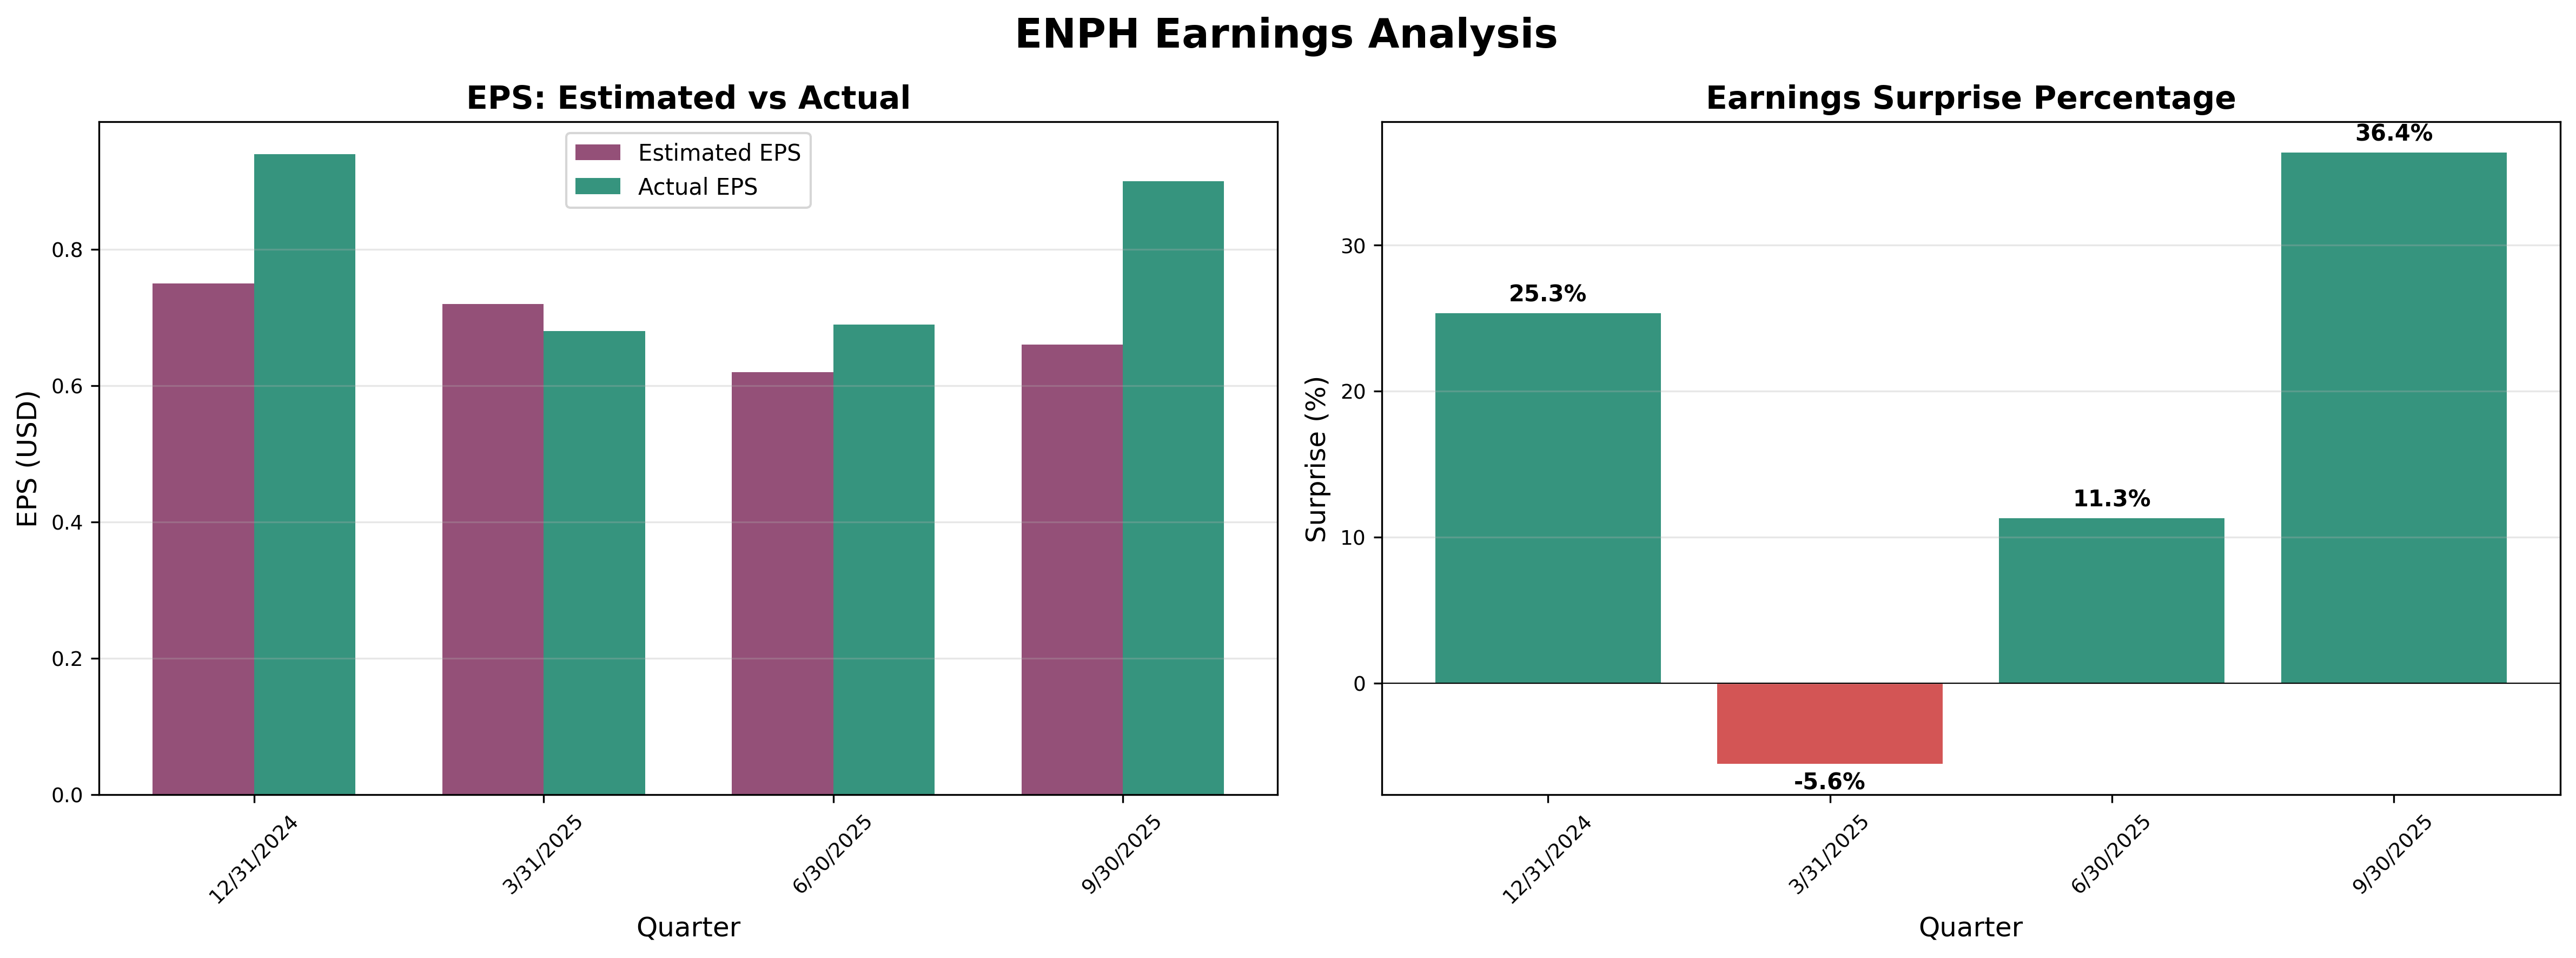
Quarterly EPS Trajectory (2024-2025):
Q4 2024: $0.95/share (beat +25.3%)
Q1 2025: $0.68/share (miss -5.6%)
Q2 2025: $0.69/share (beat +11.3%)
Q3 2025: $0.93/share (beat +36.4%)
Annual Net Income:
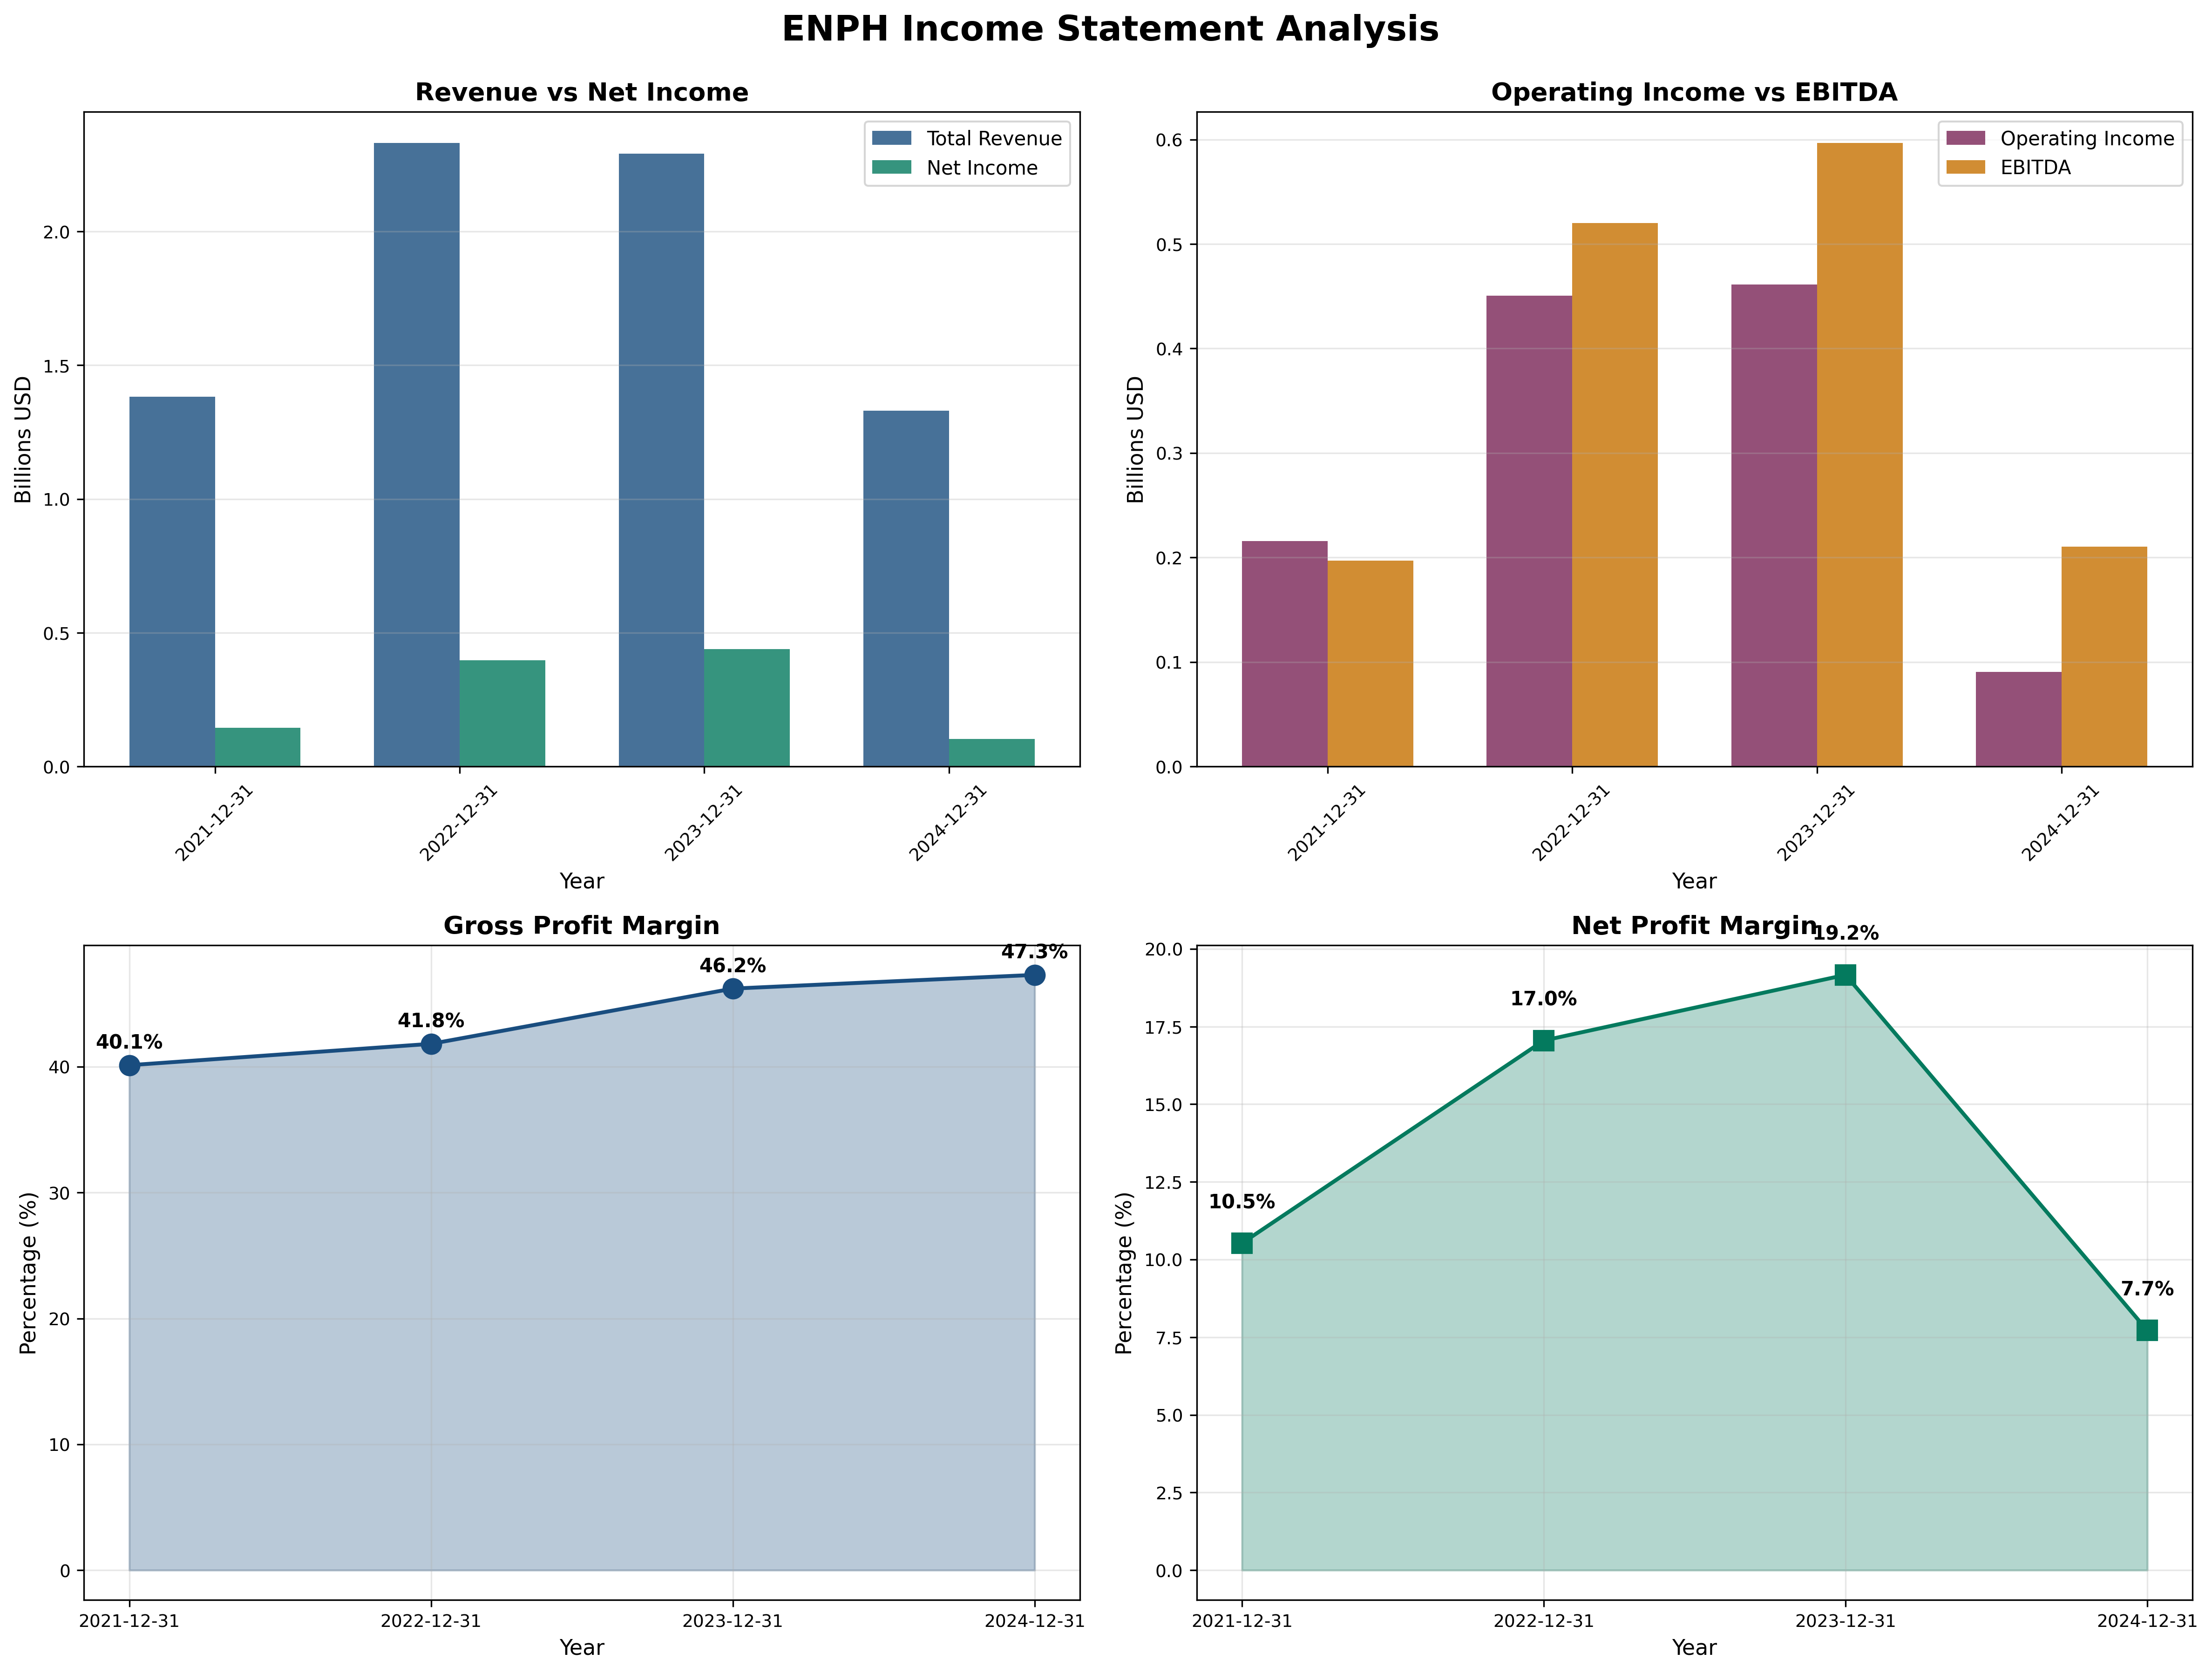
2021: $0.14B (10.5% margin)
2022: $0.41B (17.0% margin) ← Peak
2023: $0.45B (19.5% margin) ← Peak
2024: $0.10B (7.7% margin) ← Trough
Owner Earnings Calculation (2024):
Net Income:                 $0.10B
+ D&A:                      ~$0.05B
- Maintenance Capex:        ($0.01B)
- Working Capital drain:    ($0.05B)
= Owner Earnings:           $0.09B
Owner Earnings per Share: ~$1.14/share Owner Earnings Yield: $1.14 ÷ $29.83 = 3.8% (below 10% target but reasonable for cyclical trough)
Quality Assessment: Earnings collapsed 78% ($0.45B → $0.10B) as revenue fell 43%, proving high operating leverage. However, earnings remained positive through severe downturn—proof of business quality. Quarterly trajectory shows stabilization: Q1 2025 was trough at $0.68, recovered to $0.93 by Q3 2025. Consistent beats (3 of 4 quarters) suggest conservative guidance or improving operations. The 3.8% owner earnings yield seems low but reflects trough earnings; normalized $0.40B earnings implies 10%+ yield at current price.
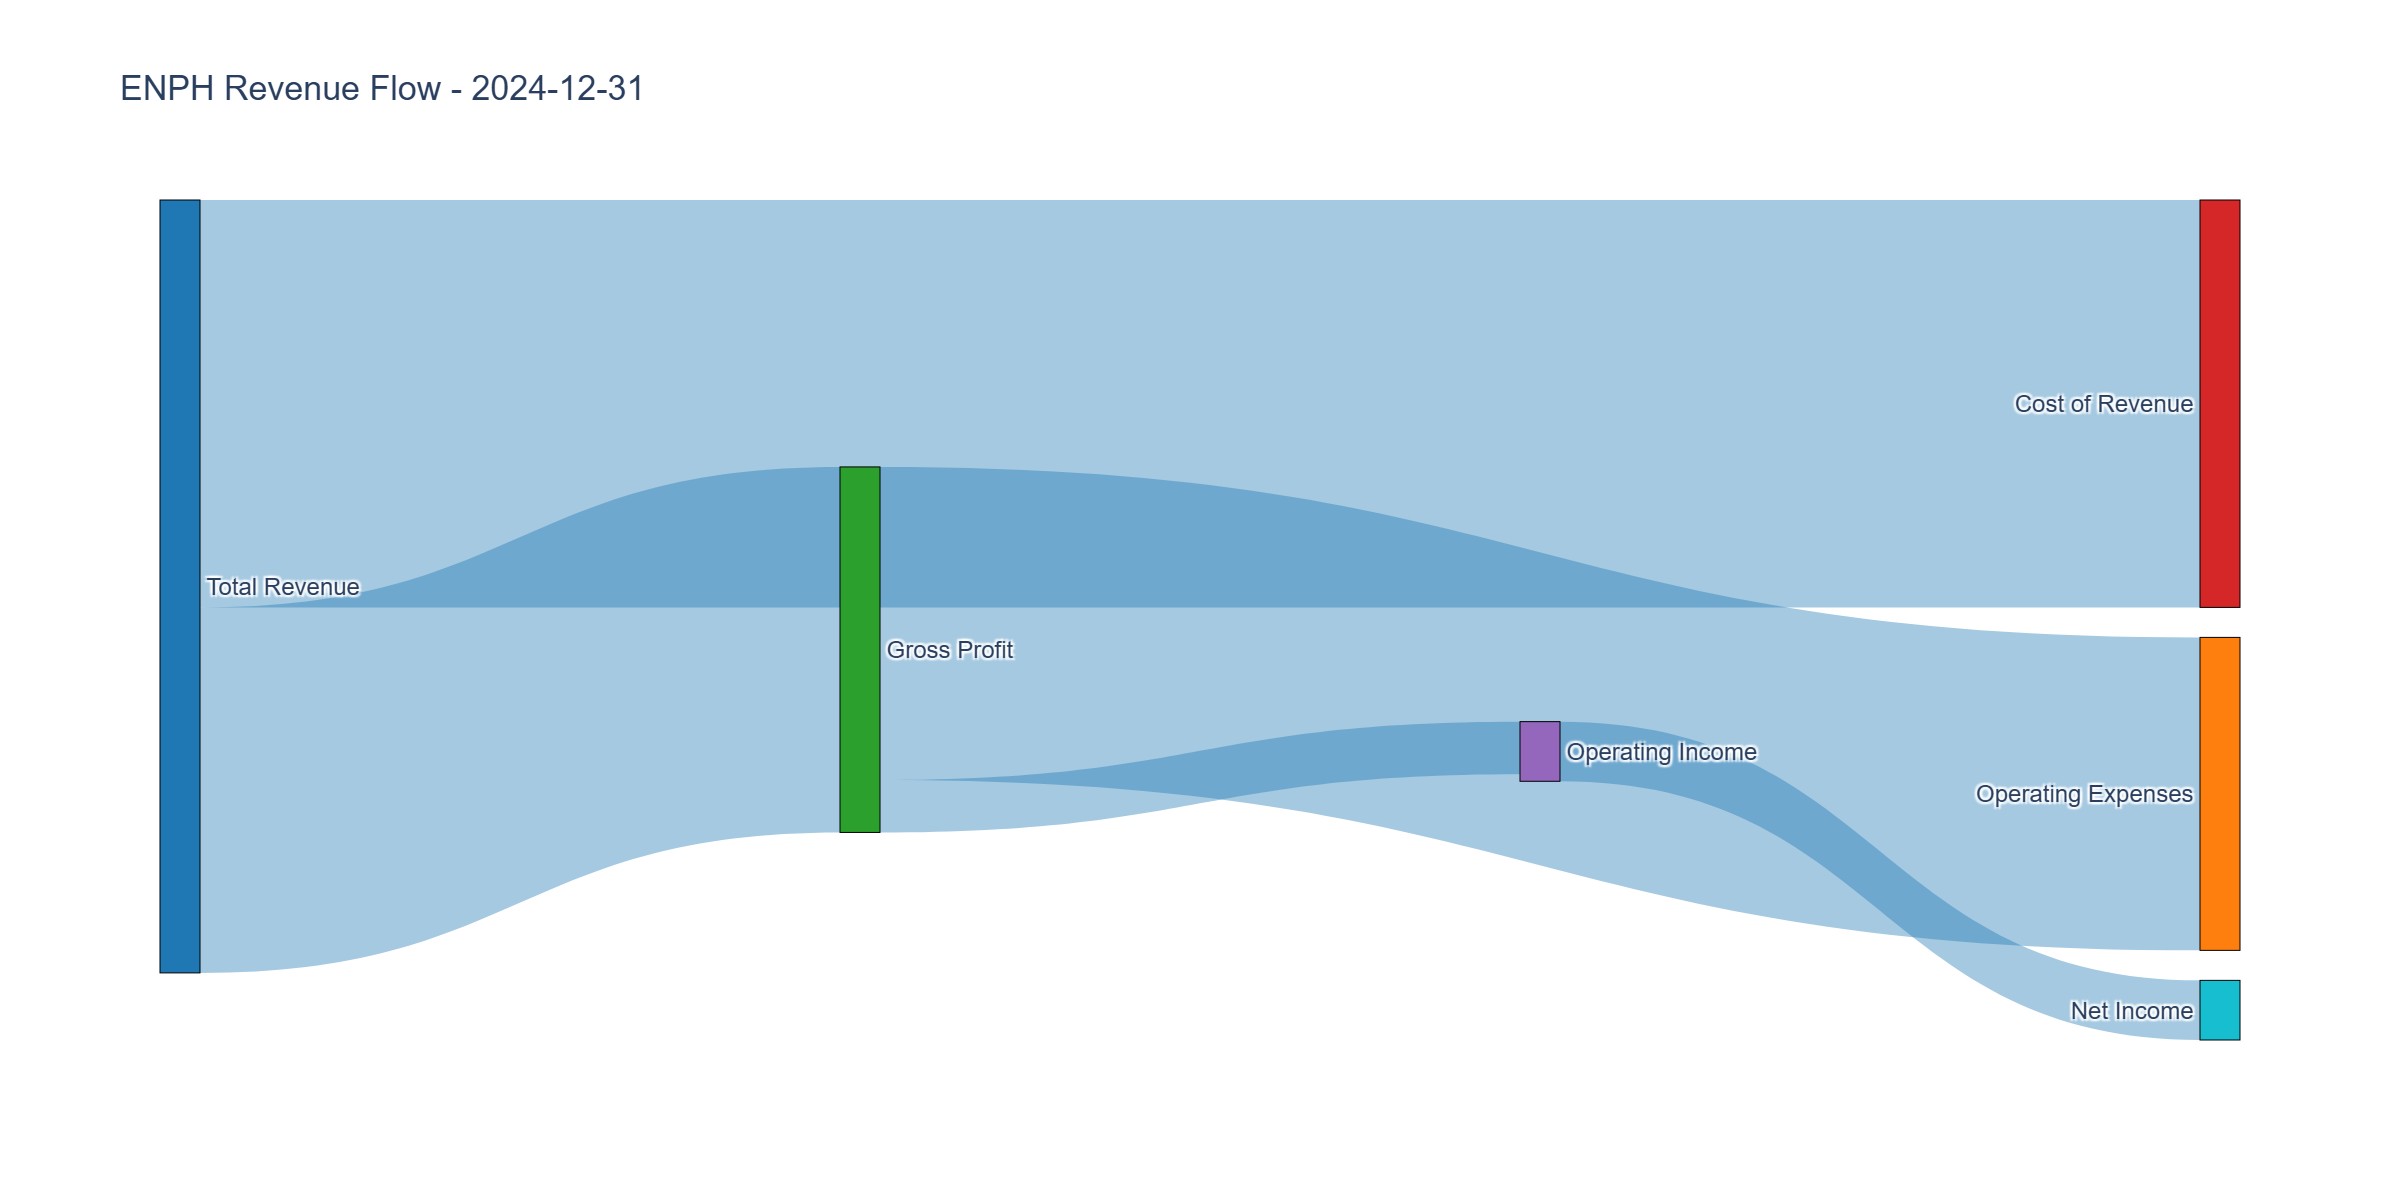
Income Statement Analysis
Key Metrics:
- Revenue: $1.3B (2024), down 43% from $2.3B (2022-2023 peak) Severe contraction
- Gross Margin: 47.3% (2024), stable vs 46% (2023), 40% (2021) Resilient
- Operating Margin: 6.8% (2024), collapsed from 20.4% (2023), 19.3% (2022) Devastating
- Net Margin: 7.7% (2024), collapsed from 19.5% (2023), 17.0% (2022) Severe compression
Assessment: The income statement tells the cyclical story. Revenue collapsed 43% in two years—NEM 3.0 (California policy change slashing solar economics) combined with interest rate shock and inventory correction created perfect storm. Gross margins held surprisingly well at 47%—pricing power and product mix (higher battery attach rates) partially offset volume decline. However, operating leverage crushed margins: fixed costs spread over 43% less revenue drove operating margins from 20% to 7%. The good news: Company achieved 7% operating margin even at trough revenue. Implies break-even around $1.0-1.1B revenue; any growth from current $1.3B drops straight to bottom line due to operating leverage.
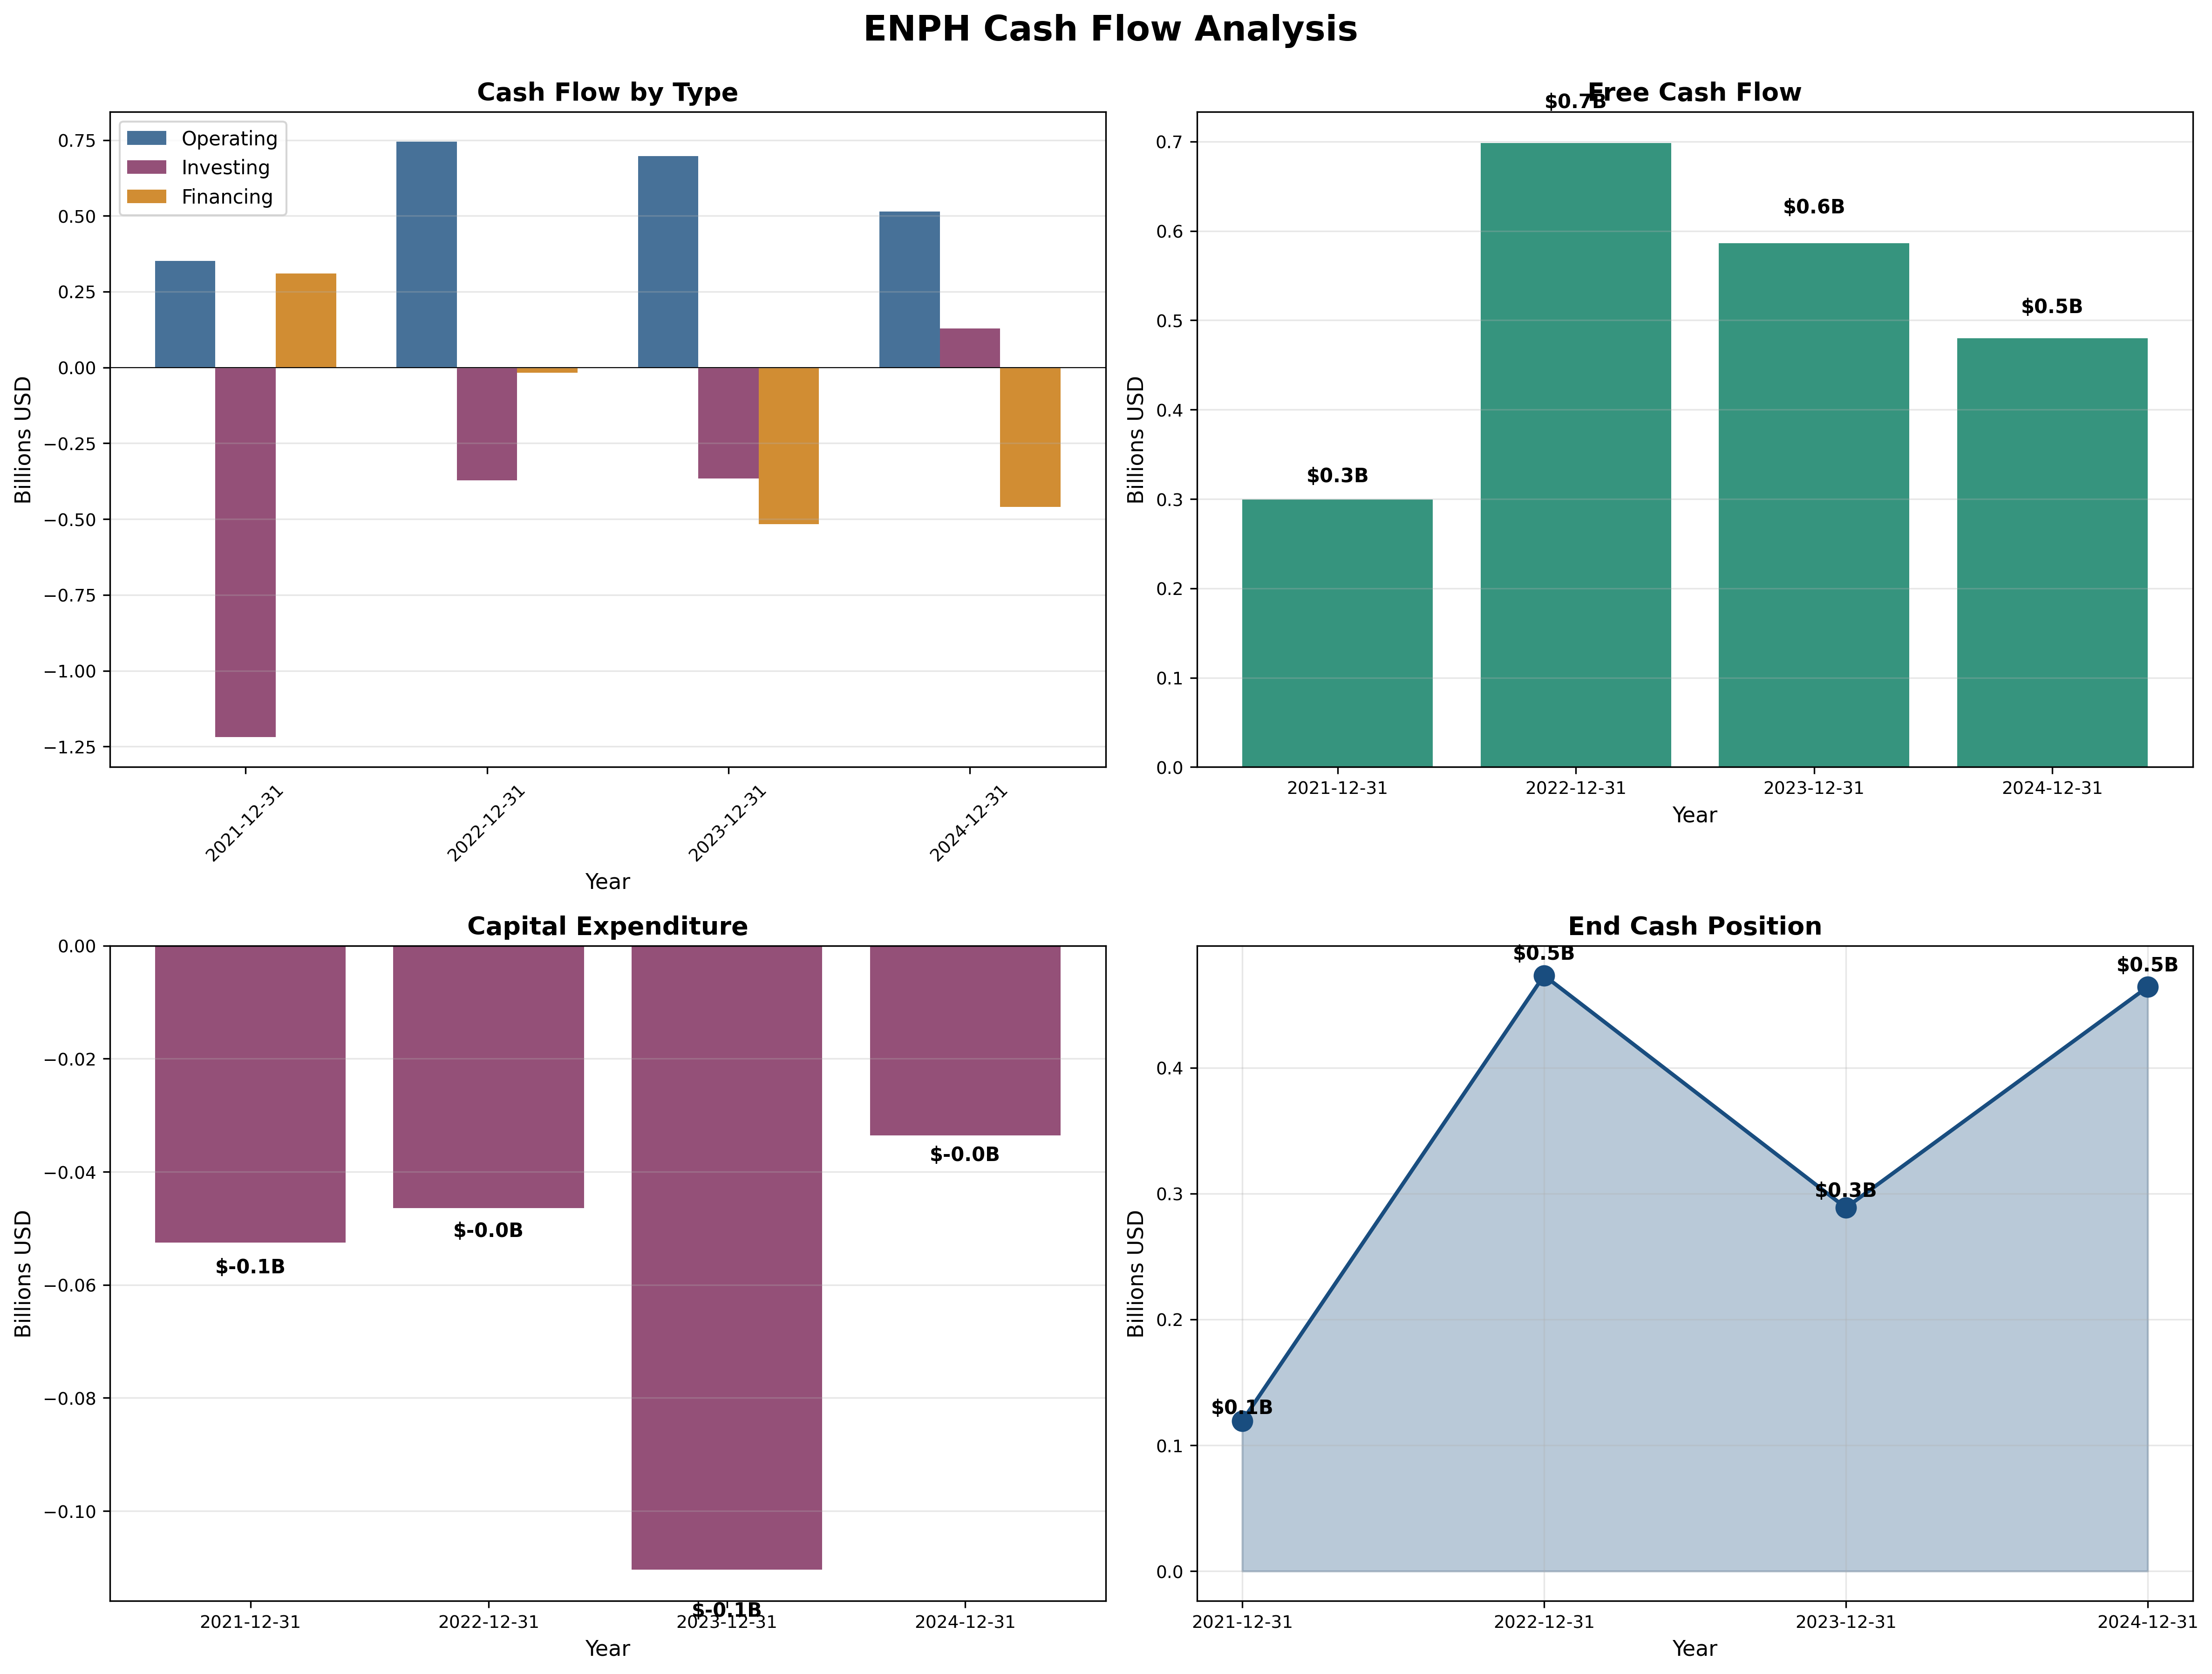
Cash Flow Generation
Key Metrics:
- Operating Cash Flow: $0.5B (2024), down from $0.7B (2022-2023)
- Capex: $0.01B (minimal, asset-light model)
- Free Cash Flow: $0.5B (2024) Impressive resilience
- FCF Margin: 38% ($0.5B FCF / $1.3B revenue) Exceptional
- Cash Position: $0.5B (stable)
Assessment: This is the hidden jewel. Despite revenue collapsing 43% and earnings down 78%, ENPH generated $0.5B free cash flow in 2024—38% FCF margin. This is exceptional for any business, let alone one in severe downturn. The disconnect between $0.10B net income and $0.5B FCF reflects inventory normalization (burned working capital built in 2022-2023 bubble) and non-cash charges. Capex of just $0.01B proves asset-light model—no factories, contract manufacturing model. This cash generation provides safety margin through downturn and ammunition for buybacks when cycle turns.
Profitability Metrics
Returns (2024, trough year):
- ROE: 12.1% (target > 15%) ⚠️ Acceptable given trough
- ROIC: ~15% (estimated)
- ROA: 3.16% vs historical 12-13% Depressed
Peak Returns (2023, last good year):
- ROE: 45% Elite
- ROA: 13% Excellent
Assessment: Returns collapsed from elite (45% ROE) to merely acceptable (12% ROE) as earnings compressed. However, 12% ROE at trough is impressive—most cyclicals go negative. The high historical returns (45% ROE) prove this is a high-quality business, not low-margin commodity. When cycle recovers to normalized $0.30-0.40B earnings, ROE will bounce back to 30-40%. Every retained dollar currently earns 12 cents even in downturn; in recovery, will earn 35-40 cents. This is NOT a value trap—it’s a quality cyclical at trough.

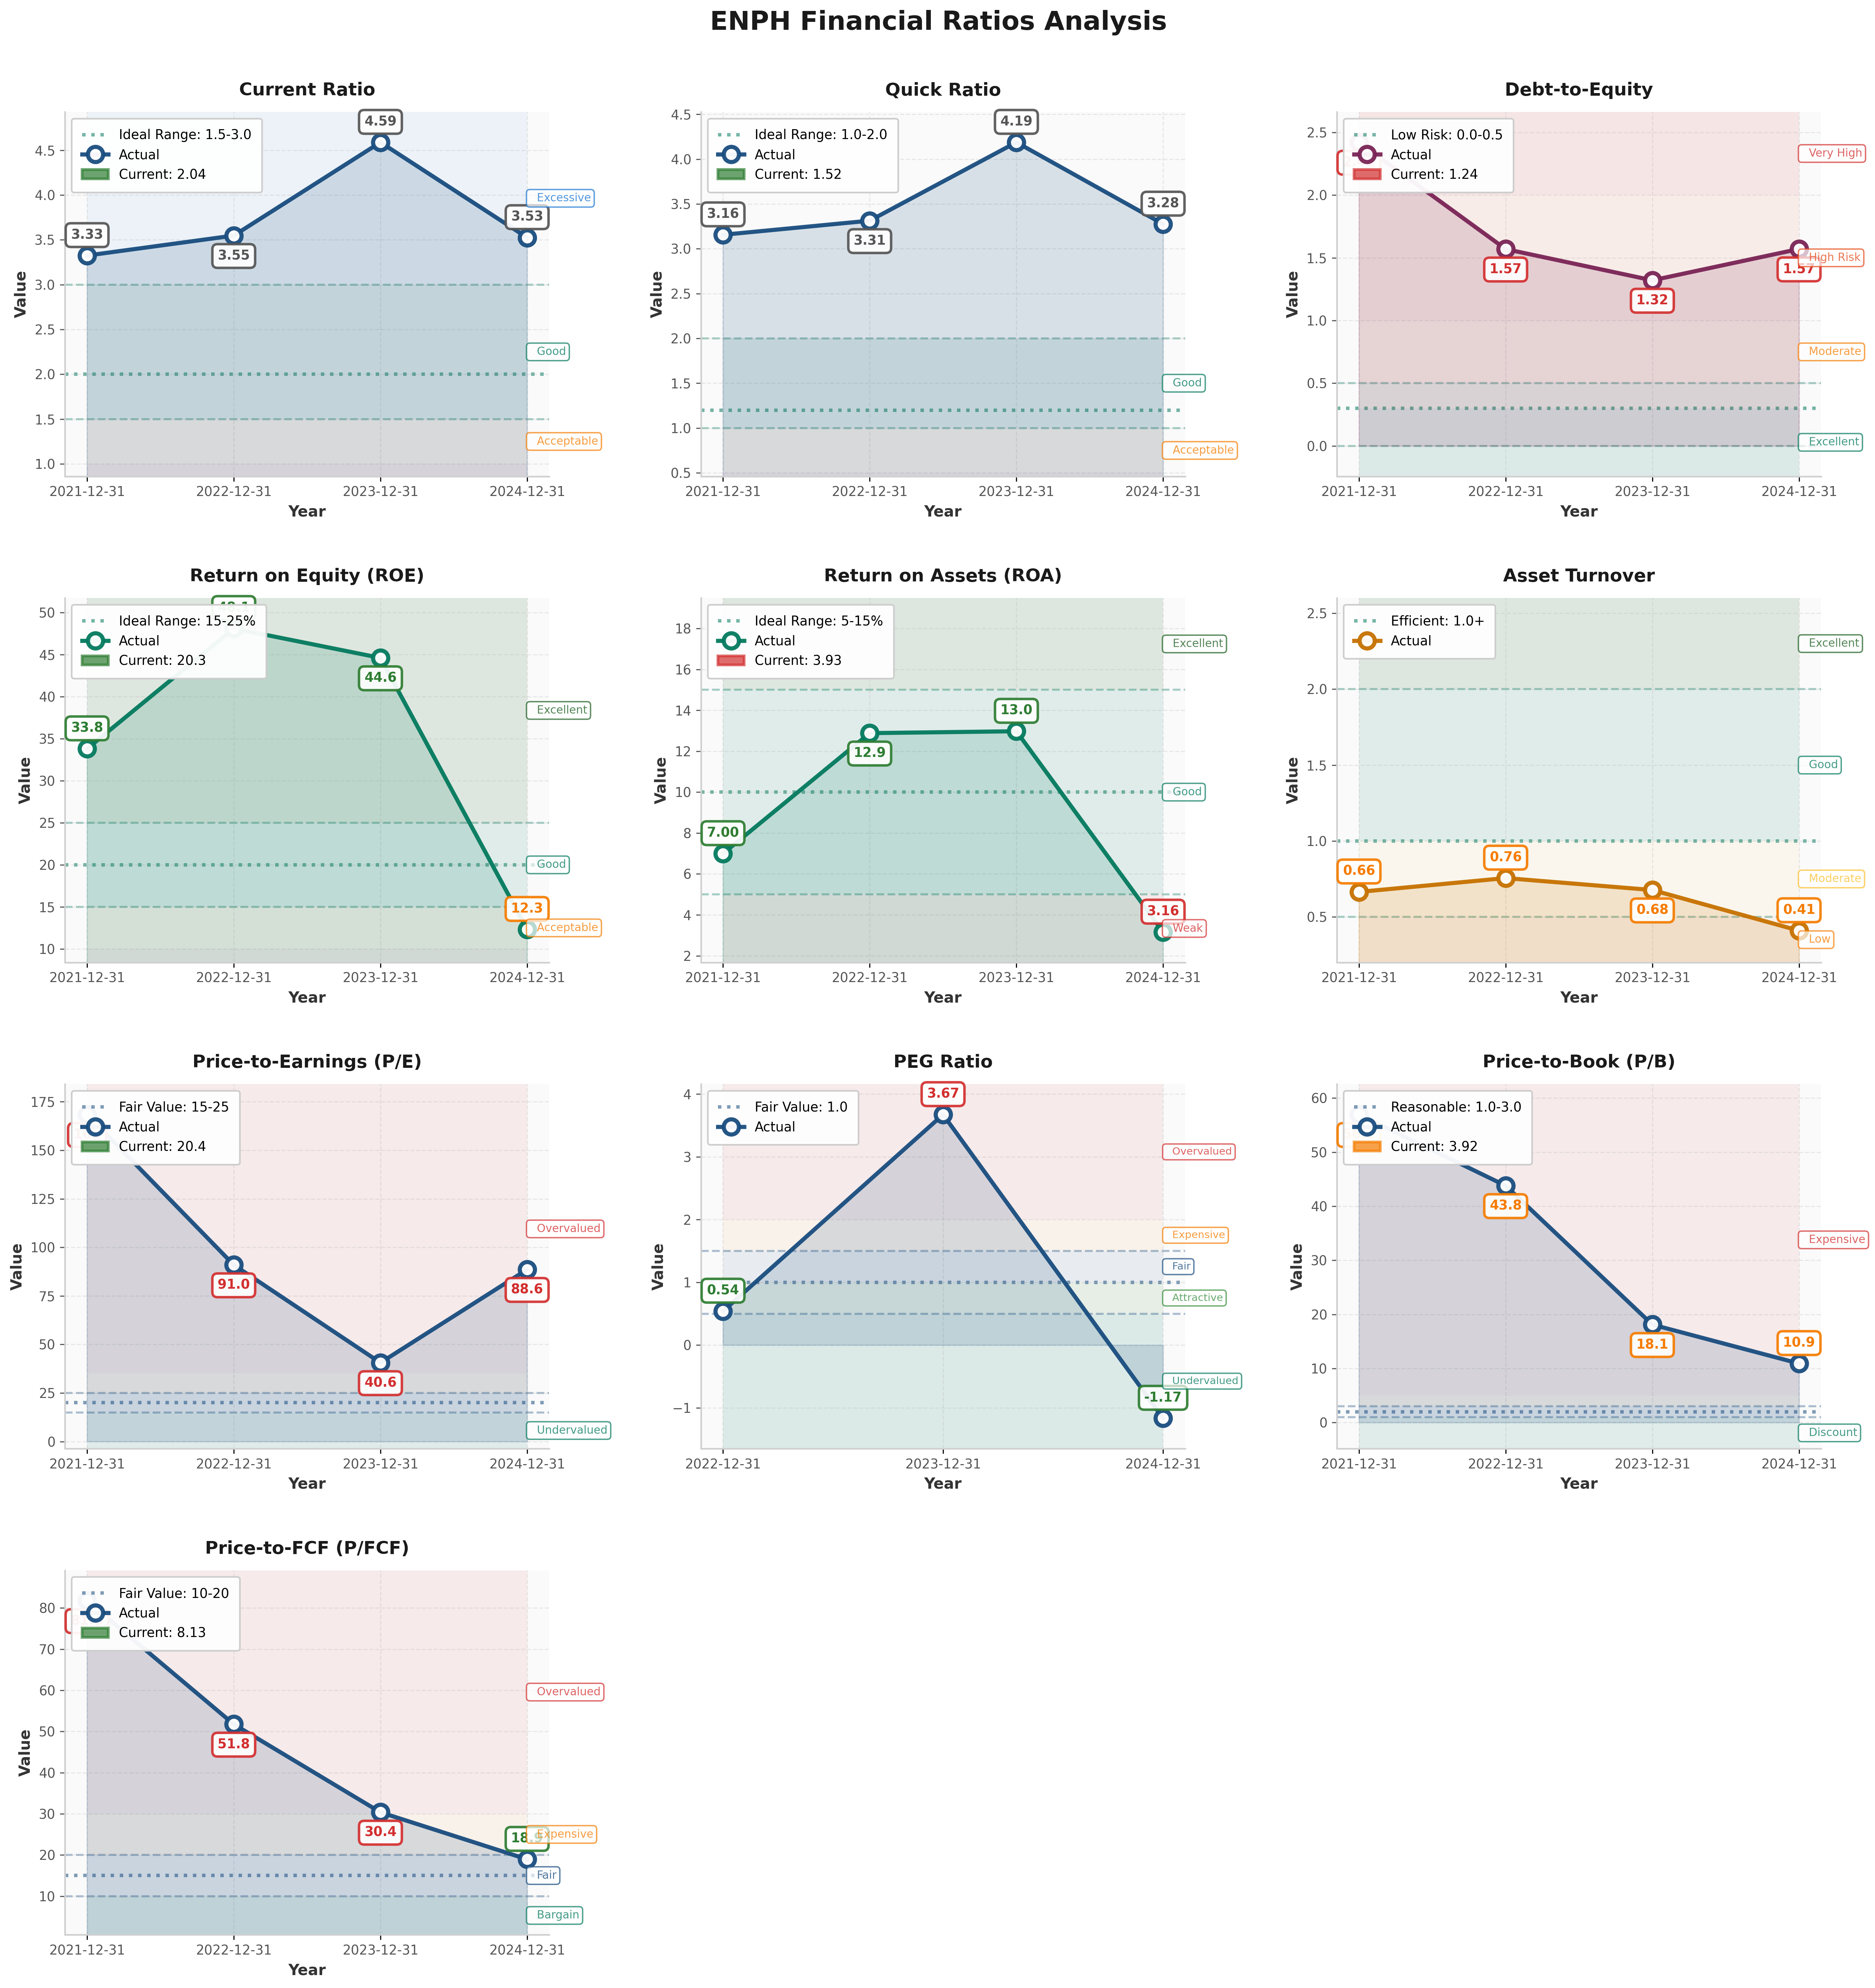
Financial Ratios Analysis
Valuation Multiples:
- P/E: 20.4x (vs historical 40-91x during growth phase, 40x at peak) Cheap for quality
- P/B: 3.92x (vs historical 10-40x) Significant discount
- P/FCF: 8.13x Screaming cheap
- EV/EBITDA: ~11x (estimated) Fair to cheap
PEG Ratio:
- P/E Ratio: 20.4x
- Current Growth Rate: -20% (revenue declining)
- PEG: -1.17 Not meaningful for cyclicals
Lynch’s Assessment: PEG doesn’t work for cyclicals at trough. Must use normalized earnings. If normalized EPS is $4-5/share (mid-cycle), current $30 price implies P/E of 6-7.5x on normalized earnings—absurdly cheap. Even at conservative $3/share normalized EPS, P/E is 10x. This is classic cyclical mispricing: market extrapolates trough earnings forward, creating opportunity for those who understand mean reversion.
Cyclical Valuation Framework:
Trough earnings (2024): $0.10B → $1.27/share → P/E 23.5x
Normalized earnings: $0.30-0.40B → $3.80-5.06/share → P/E 5.9-7.8x
Peak earnings (2023): $0.45B → $5.70/share → P/E 5.2x
Current $30 price implies perpetual trough—classic cyclical bottom signal.
Capital Allocation Assessment
Management Quality Grade: B+
Key Factors:
- Insider Ownership: ~1% (minimal alignment)
- Buybacks: $200M+ annually 2022-2024, good timing at $100-150 but not at current $30
- R&D Investment: $100-150M annually (~10% of revenue), appropriate
- No dividend: Appropriate for growth/cyclical company
Capital Allocation Review:
- Buybacks: Bought heavily at $100-200 (good), continued at $30-50 (less ideal but defensible given cash generation)
- R&D: Maintaining $100-150M R&D spend through downturn is correct—preserves competitive position
- Avoided M&A: Wisely avoided acquisitions during downturn
- Debt management: Refinanced at favorable rates before rate spike, stable $1.3B level appropriate
Assessment: Management navigated downturn reasonably well. Maintained gross margins at 47% while competitors collapsed. Cut opex intelligently without gutting R&D. Used strong FCF to buy back stock (questionable at elevated prices but reasonable to deploy excess cash). Did NOT raise capital at distressed levels (like peers). Main criticism: Should have bought back MORE stock at $30-50 rather than $100-200. Overall competent but not exceptional.
Valuation & Intrinsic Value
Cyclical Valuation Methodology:
Scenario 1 - Cycle Recovers to Mid-Level (50% probability):
Revenue: $1.8-2.0B (NEM stabilizes, rates fall, inventory cleared)
Operating Margin: 15-18% (historical mid-cycle)
Net Income: $0.25-0.32B
EPS: $3.16-4.05/share
Fair P/E: 15-20x (cyclical company)
Target Price: $47-$81
Scenario 2 - Remains Depressed (30% probability):
Revenue: $1.2-1.5B (structural California decline, tariff headwinds)
Operating Margin: 8-12%
Net Income: $0.10-0.16B
EPS: $1.27-2.03/share
Fair P/E: 12-18x (distressed cyclical)
Target Price: $15-$36
Scenario 3 - Returns to Peak (20% probability):
Revenue: $2.3-2.5B (IRA benefits kick in, rates normalize, Europe accelerates)
Operating Margin: 18-20%
Net Income: $0.40-0.48B
EPS: $5.06-6.08/share
Fair P/E: 20-25x (growth resuming)
Target Price: $101-$152
Probability-Weighted Valuation:
50% × $64 = $32.00
30% × $25.50 = $7.65
20% × $126.50 = $25.30
Expected Value: $64.95/share
Risk-Adjusted Intrinsic Value: $50-$75/share (assuming cycle normalizes)
Current Price: $29.83 Margin of Safety: +68% to +151% (IF normalization occurs)
Assessment: At $30, market prices in near-permanent trough (Scenario 2). This seems excessively pessimistic given: (1) $0.5B FCF at trough, (2) Balance sheet solid, (3) Industry fundamentals improving (inventory cleared, NEM 3.0 worst behind us), (4) Battery attach rates rising. Normalized mid-cycle value of $50-75 implies 67-150% upside. However, downside to $15-25 exists if structural decline thesis proves correct.
Risk Assessment
Key Risks (Top 3)
Structural Demand Destruction (40% probability, -50% impact): NEM 3.0 permanently destroyed California residential economics. If NEM policies spread to other states (Nevada, Hawaii already did), U.S. residential solar demand could decline 50% structurally. Revenue falls to $0.8-1.0B, margins compress to 5%, stock reprices to $15-20.
Chinese Competition (35% probability, -30% impact): Hoymiles, APSystems, others offering microinverters at 60% of Enphase pricing. If “good enough” technology commoditizes market, gross margins compress from 47% to 30-35% (like panels). Even at normalized revenue, lower margins mean $20-30 fair value.
Tariff/Trade War (25% probability, -20% impact): Trump 2.0 could impose tariffs on Chinese components, raising costs 15-25%. Unable to pass through to price-sensitive market, margin compression accelerates. Alternatively, Chinese retaliation blocks Enphase from growing international markets.
Worst Case Scenario: NEM policies destroy residential economics permanently + Chinese competitors take 50% market share at half price + tariffs compress margins. Revenue falls to $0.7-0.9B, operating margins 2-5%, losses/minimal profits. Stock reprices to $8-15. Probability: 10-15%.
Contrarian Opportunity Assessment: This exhibits textbook “maximum pessimism” characteristics:
- Stock down 90% from peak ($340 → $30)
- Revenue down 43%, margins compressed 60%
- Sentiment universally negative (solar is “dead”, China is “taking over”)
- Yet: (1) Company still profitable at trough, (2) Generating $0.5B FCF, (3) Balance sheet solid, (4) Quarterly results improving sequentially
Templeton would say: “This is what maximum pessimism looks like. The question is: Are we in 1932 (beginning of long recovery) or 1929 (falling knife before deeper decline)?”
Investment Recommendation
Current Assessment
Valuation: P/E = 20.4x (trailing) | 6-8x (normalized) | P/FCF = 8.1x | P/B = 3.92x Verdict: Deeply undervalued IF cycle normalizes; fairly valued if structural decline
Margin of Safety: +68% to +151% (vs normalized mid-cycle value)
Entry Zones
| Zone | Price | Action | Rationale |
|---|---|---|---|
| 🟢 Strong Buy | < $32 | Maximum position size | Trough, extreme pessimism |
| 🟡 Buy | $32 - $42 | Build position | Early recovery |
| 🟠 Hold | $42 - $65 | Monitor | Mid-cycle fair value |
| 🔴 Trim | > $75 | Take profits | Euphoria returning |
Current Price: $30 → Recommendation: 🟢 STRONG BUY (5-8% position for aggressive investors, 2-3% for conservative)
Expected Returns (3-Year)
- Bull Case (30%): $80-120 → +168% to +302% if cycle returns to peak, IRA benefits materialize, battery storage takes off
- Base Case (50%): $50-75 → +68% to +151% if cycle normalizes to mid-level, margins recover to 15%
- Bear Case (20%): $18-32 → -40% to +7% if structural decline, tariffs, Chinese competition persist
Expected Annual Return (3-year): +30% to +50% annually (high uncertainty, skewed positive)
Final Investment Conclusion
Overall Grade: B
Category Scores:
- Business Quality: 8/10 (Dominant microinverter leader, strong moat)
- Financial Strength: 7/10 (Solid balance sheet, exceptional FCF generation)
- Management Quality: 7/10 (Navigated downturn adequately, capital allocation decent)
- Valuation: 9/10 (P/FCF 8x, P/E 6-8x on normalized earnings—screaming cheap)
- Margin of Safety: 8/10 (68-150% upside to normalized value)
Final Verdict: STRONG BUY (for aggressive value investors comfortable with cyclical risk)
Investment Thesis Summary
Enphase is a high-quality cyclical experiencing maximum pessimism. The company dominates residential solar microinverters (50%+ share) with strong moat from installer ecosystem, reliability reputation, and scale advantages. The business model is exceptional—47% gross margins and 38% FCF margins even at trough prove durability.
The downturn was severe: Revenue fell 43% ($2.3B → $1.3B) due to NEM 3.0 policy shock, interest rate spike, and inventory correction. Stock crashed 90% ($340 → $30). Operating margins compressed 60% (20% → 7%) due to operating leverage. Market sentiment is universally negative—“solar is dead,” “China is taking over,” “structural decline.”
However, the cyclical bottom thesis is compelling:
- Still profitable at trough: $0.10B net income, $0.5B FCF proves business quality
- Balance sheet solid: 3.5x current ratio, $1.6B working capital, low bankruptcy risk
- Improving sequentially: Q1'25 $0.68 EPS → Q3'25 $0.93 EPS, consistent beats
- Inventory cleared: 2024 was destocking year, cleaner going forward
- Valuation absurd: P/FCF 8x, P/E 6-8x on normalized earnings
The Math:
- Downside: $18-25 (-40% to -16%) if structural decline thesis correct
- Upside: $50-120 (+68% to +302%) if cycle normalizes or recovers
- Asymmetric: 2-4x upside vs 1x downside
Risks are material: NEM policies could spread, destroying residential economics permanently. Chinese competition could commoditize microinverters. Tariffs could compress margins. This could be value trap if solar shifts to string inverters + battery storage model (cutting out microinverters).
The Masters Would Say:
Graham: “Current ratio 3.5x, debt manageable, profitable at trough. Valuation at P/FCF 8x provides margin of safety IF earnings normalize. But cyclical—only for aggressive investors who can time the cycle. I’d buy small position at $25-30.”
Buffett: “Do I understand solar policy risk? No. Can I predict NEM 3.0 impact? No. Circle of competence violation. But—$0.5B FCF at trough with $4B market cap (8x FCF) is interesting. If I trusted the moat, I’d buy. But I don’t understand technology well enough. Pass.”
Lynch: “Classic cyclical bottom setup. Stock down 90%, everyone hates it, but company still making money and generating cash. If I believe solar isn’t dead (I do—climate mandates are real), this is 3-bagger over 3 years. I’d buy 5% position and hold through volatility.”
Templeton: “THIS IS MAXIMUM PESSIMISM. Stock down 90%, sentiment universally negative, company still profitable and generating FCF, balance sheet solid, improving sequentially. This is EXACTLY what I look for. Buy aggressively at $25-35, hold for 3-5 years. Target $80-100.”
Munger: “What could go catastrophically wrong? (1) NEM spreads to all states (-50% demand), (2) Chinese take 80% share at half price, (3) Battery storage makes microinverters obsolete. What’s the probability? Maybe 20-30% combined. At 8x FCF, am I compensated? Yes. I’d buy 5% position.”
Framework Checklist
- ✅ Quantitative: P/FCF 8x, strong balance sheet, profitable at trough—adequate margin of safety
- ✅ Moat: Strong competitive advantages from installer ecosystem and reliability
- ✅ Management: Adequate capital allocation, maintained margins through downturn
- ✅ Contrarian: Textbook maximum pessimism—90% decline, universal negativity, improving fundamentals
- ✅ Simplicity: Can explain business model simply
Would I hold this for 10+ years if the market closed tomorrow?
YES at $30, conditional on solar policy stabilization. This is NOT a forever compounder like Costco or Visa—it’s a cyclical. But at 8x FCF with strong moat and improving fundamentals, downside is limited while upside is 2-4x. I’d hold through the cycle (3-5 years), harvest gains at $75-100, then reassess. This requires active monitoring—quarterly earnings, policy changes, competitive dynamics.
At $30, this is a “bet on mean reversion” play with strong odds. The cycle WILL turn—question is when (1 year? 3 years?) and how high (mid-cycle? peak?). Patience required, but risk/reward strongly favors bulls.
Recommendation Summary:
- If you’re aggressive value investor: BUY 5-8% position at $28-35, add on further weakness to $22-28
- If you’re conservative: BUY 2-3% position at $28-32, wait for sustained revenue growth before adding
- Position sizing: 5-8% max even for aggressive (cyclical risk, can go to $18-25 if thesis wrong)
- Exit strategy: Trim at $60-70 (mid-cycle), exit majority at $90-110 (euphoria returning)
Monitor these catalysts:
- Q4 2025 earnings (need sequential revenue growth to confirm bottom)
- California solar permit data (need stabilization at 40-50K monthly)
- Battery attach rate (need 30%+ to offset microinverter commoditization)
- Gross margin (need to sustain 45%+, any slip to 40% is red flag)
- Policy changes (any new NEM rollbacks or IRA extensions)
Analysis completed November 3, 2025. This is a cyclical timing play—reassess quarterly and be prepared to sell when cycle peaks.