Executive Summary
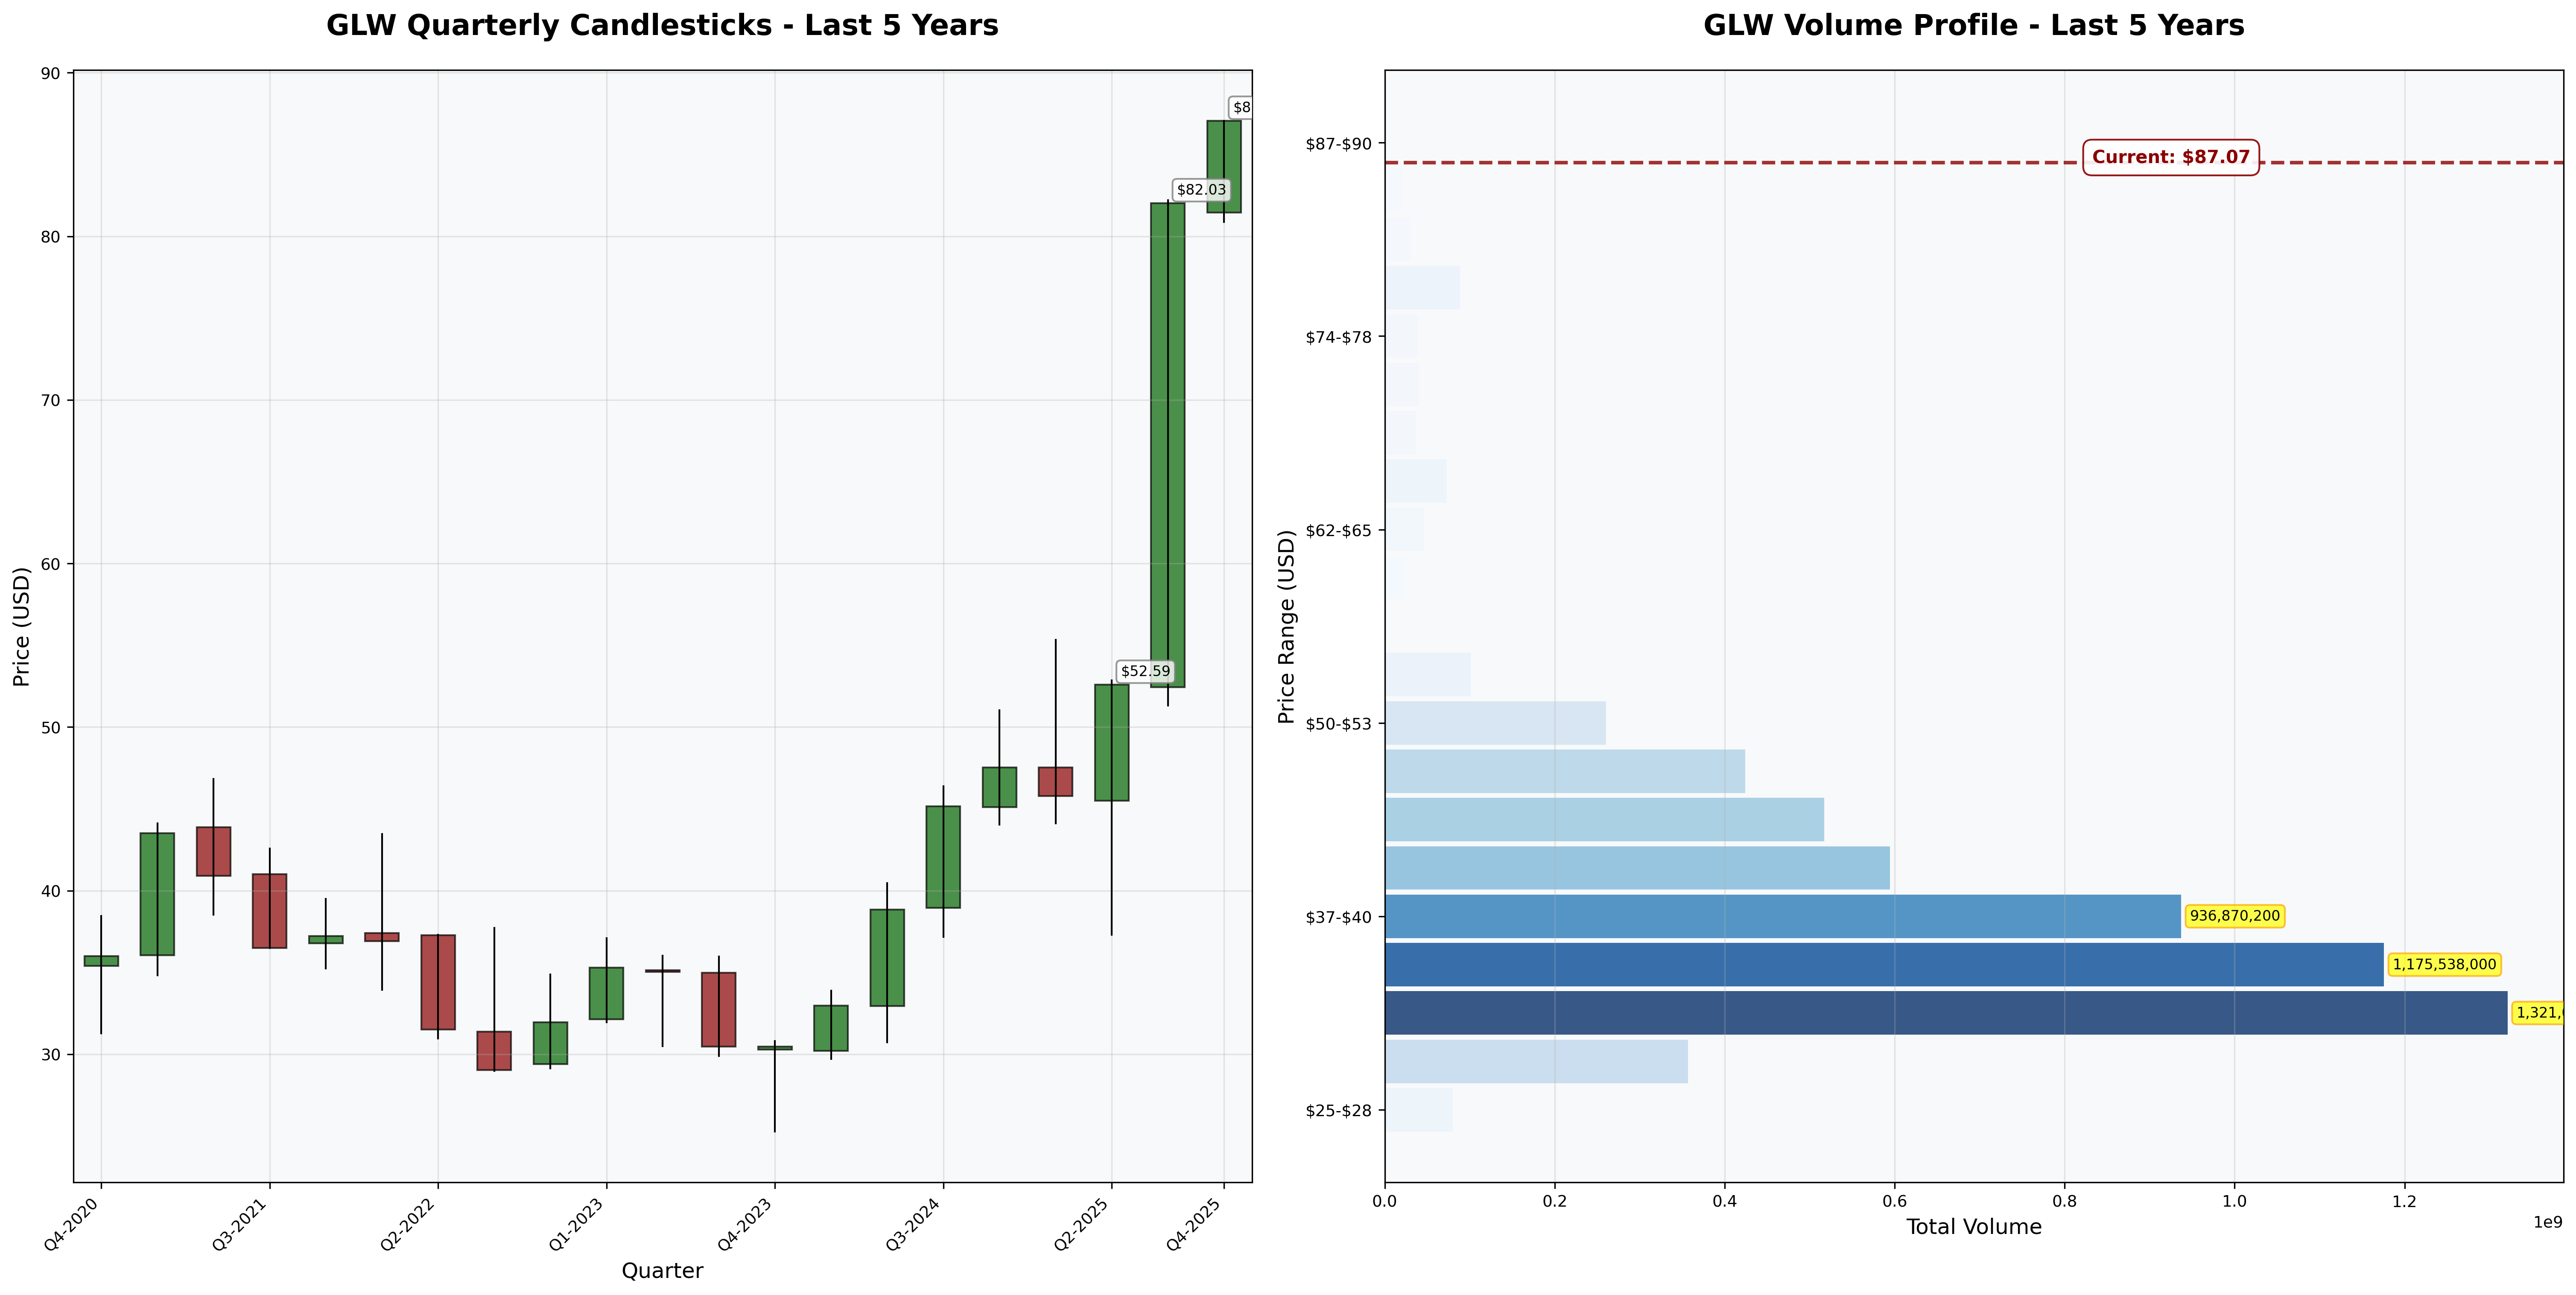
Investment Thesis: Corning possesses genuine technological moats in optical communications and specialty glass, but the stock has become catastrophically detached from fundamental value. At $87.07, investors are paying 92.6x earnings for a business experiencing severe margin compression, declining returns on capital, and weakening cash generation. This represents speculation, not investment.
Business Classification: Cyclical (with mature stalwart characteristics)
Current Valuation Assessment:
- Current Price: $87.07
- Estimated Intrinsic Value: $18-24
- Margin of Safety: -263% to -383% (massively overvalued)
- Recommendation: AVOID
Recommended Entry Zones:
- Aggressive Entry: < $17 (with 30% margin of safety to base case)
- Standard Entry: $12-17 (40%+ margin)
- Hold/Avoid: > $24
Business Overview
What They Do (2-Minute Test)
Corning makes specialized glass and ceramics that most people never see but use daily. Their Gorilla Glass protects smartphone screens. Their optical fiber carries internet data. Their ceramic substrates clean car emissions. Their lab equipment enables scientific research. The company innovates materials that are difficult to replicate, creating natural barriers to competition.
Competitive Position & Moat Analysis
Primary Moat Type: Intangible Assets (patents, technical know-how) + Cost Advantage (manufacturing scale)
Moat Strength: ⭐⭐⭐ (out of 5)
Key Moat Factors:
- 170+ years of materials science R&D creating deep patent portfolio and proprietary manufacturing processes
- Scale advantages in capital-intensive glass production that deter new entrants
- Long-term strategic partnerships with Apple, Samsung, and major telecom providers create switching costs
- Brand recognition in Gorilla Glass provides pricing power in mobile device protection
Moat Durability:
- Status: Narrowing - Margin compression over three consecutive years signals eroding competitive advantages and intensifying pricing pressure from concentrated customers
- Key Threat: Customer concentration (top 10 drive majority revenue) gives buyers leverage; OLED display transition and smartphone market saturation threaten core segments
Industry Dynamics
50-Year Outlook: Optical communications likely grows with data demand; display glass faces structural headwinds from market maturation and technological shifts. Overall survival probable but not guaranteed dominance.
Key Trends:
- 5G infrastructure and fiber-to-home expansion drive optical demand
- Smartphone market saturation and lengthening replacement cycles pressure specialty materials
- Automotive glass content increasing with ADAS adoption, but small segment today
Quantitative Checklist
Defensive Investor Criteria:
| Criterion | Requirement | Actual | Pass/Fail |
|---|---|---|---|
| Earnings Stability | Positive 10 years | 10/10 years | ✅ |
| Dividend Record | Some payment | $1.12/share | ✅ |
| Earnings Growth | +33% in 10 years | -12.9% (2024) | ❌ |
| P/E Ratio | < 15x | 92.6x | ❌ |
| P/B Ratio | < 1.5x | 6.34x | ❌ |
| P/E × P/B | < 22.5 | 587 | ❌ |
| Current Ratio | > 2.0 | 1.50 | ❌ |
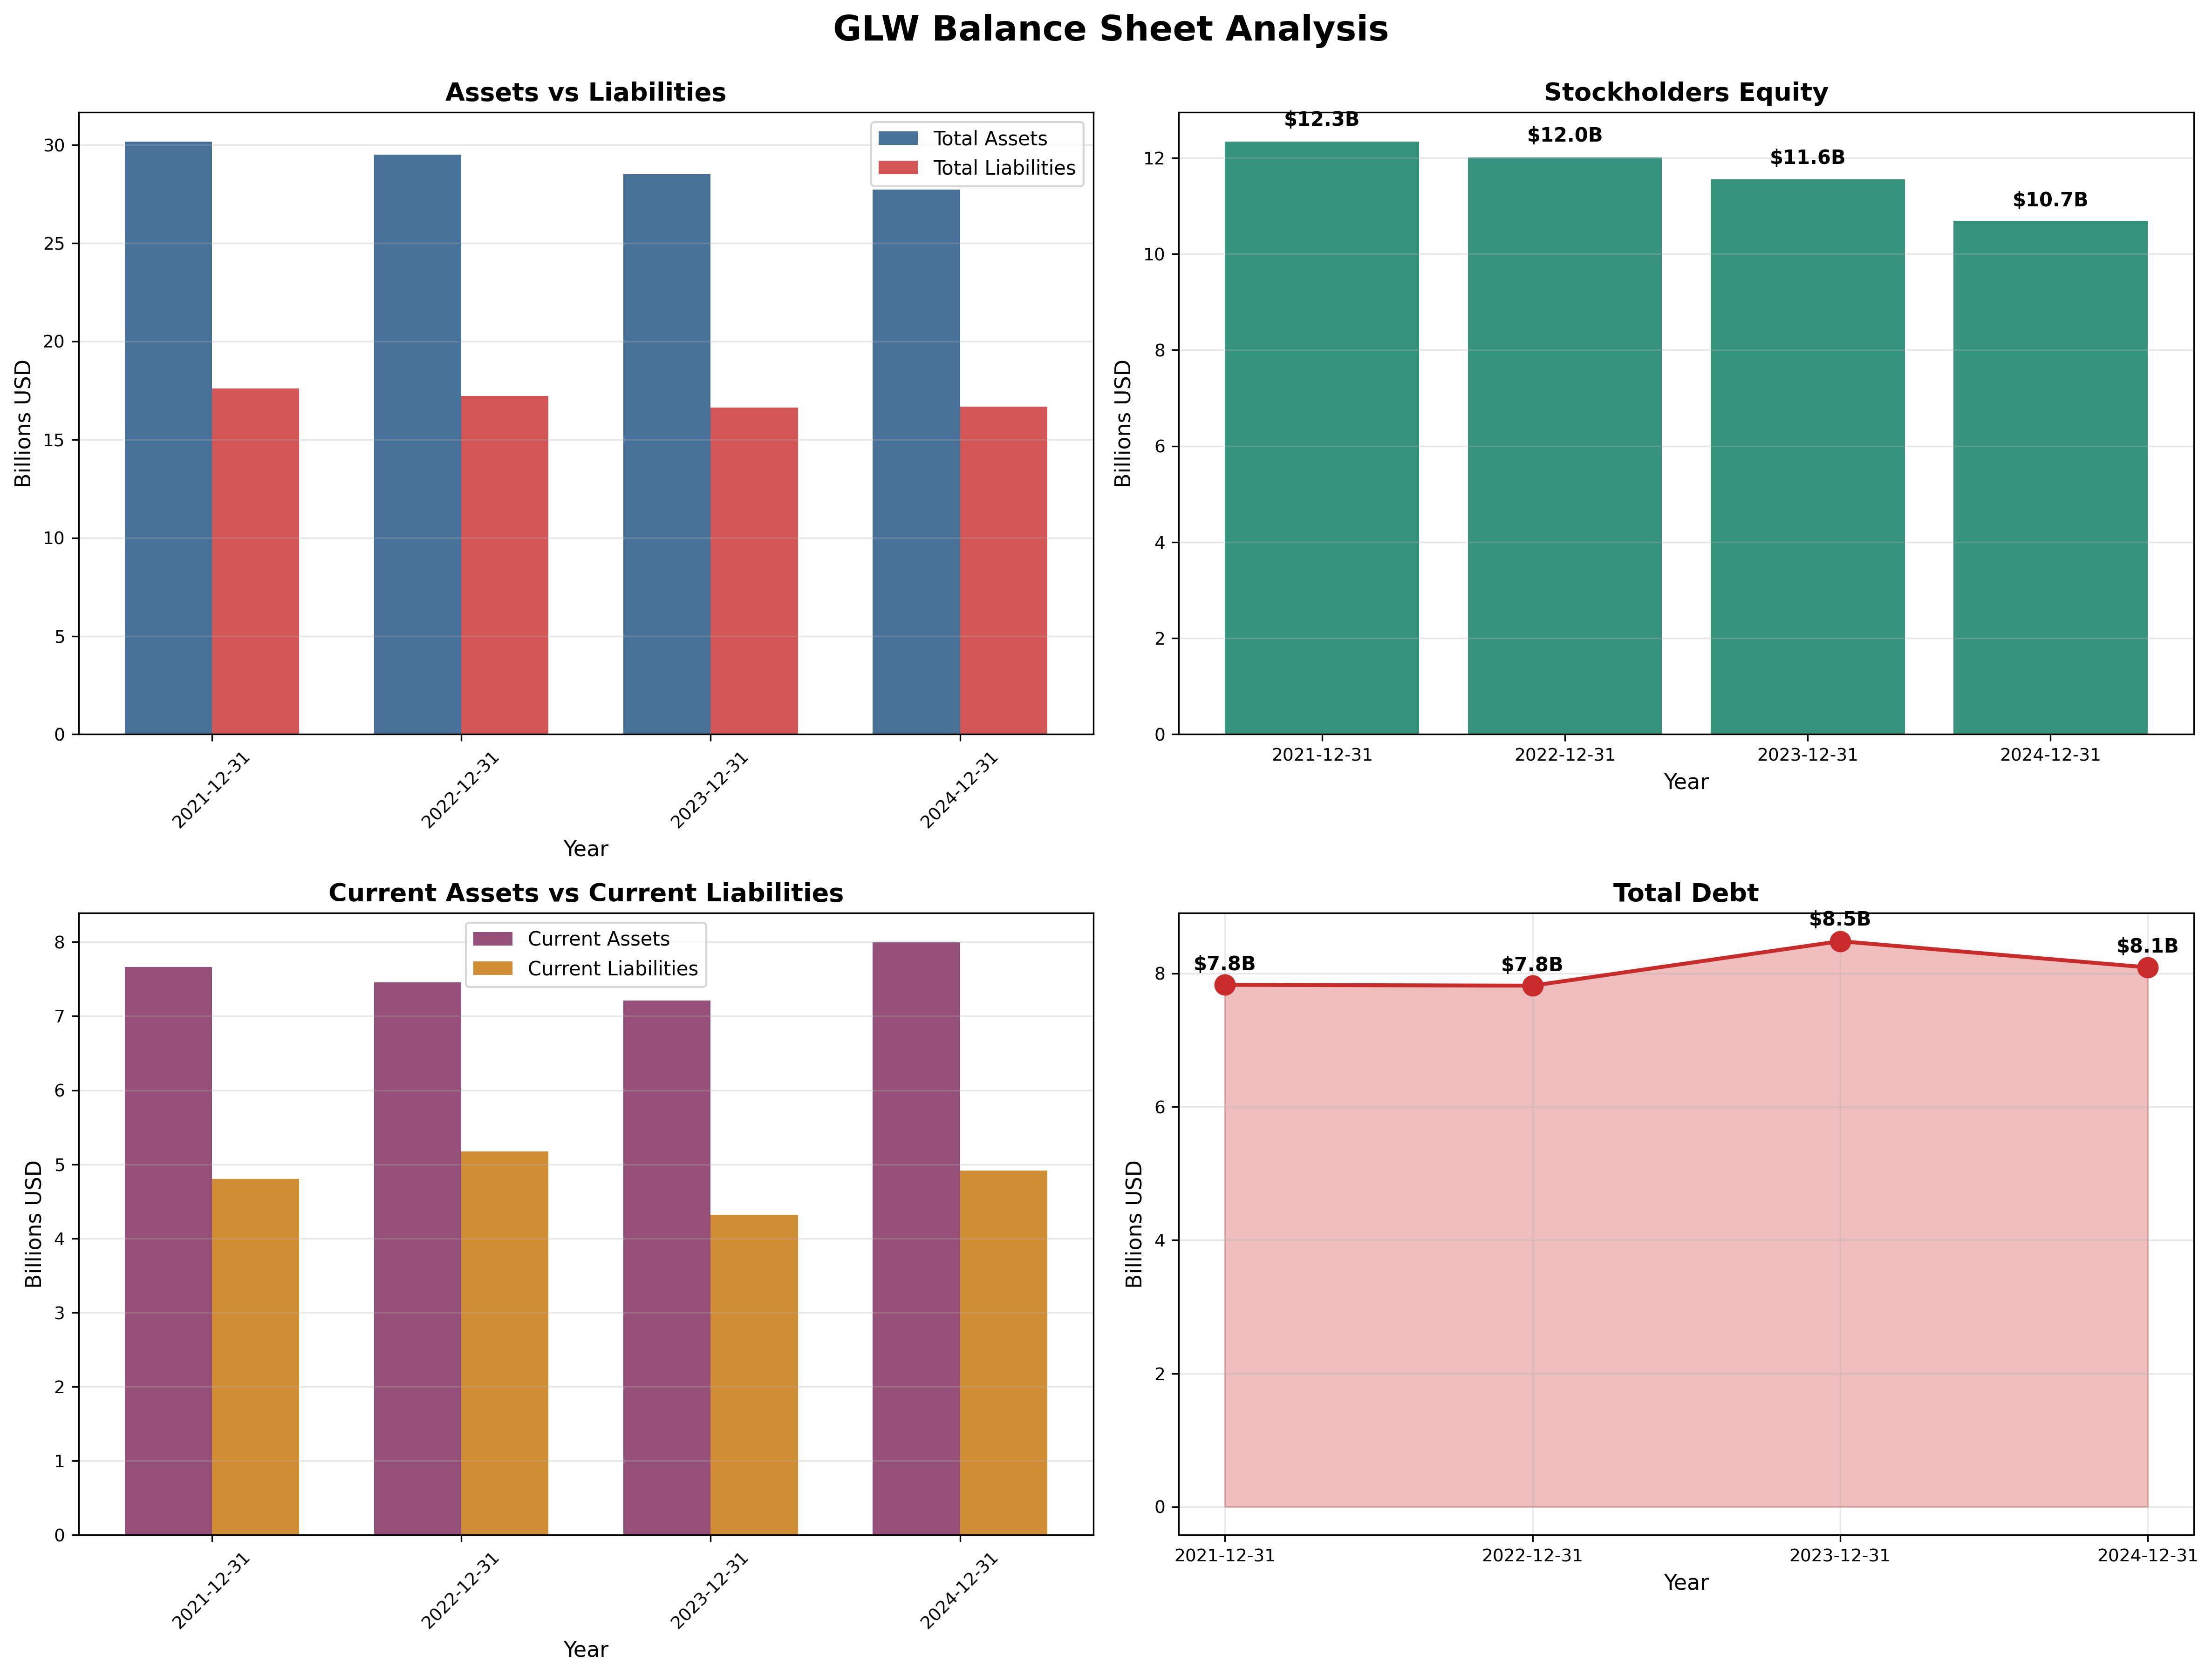
| Debt vs NCA | Debt < NCA | $8.1B > $3B | ❌ |
Quantitative Score: 2/9 criteria met
Analysis: Corning fails catastrophically on valuation metrics (P/E, P/B, combined multiple) and recent earnings trajectory. The 192% dividend payout ratio makes that “payment” unsustainable. Only long-term earnings history and existence of some dividend (however irrational) pass Graham’s criteria. This is not a defensive investor’s stock.
Financial Analysis with Critical Assessment
Balance Sheet Strength
Key Metrics:
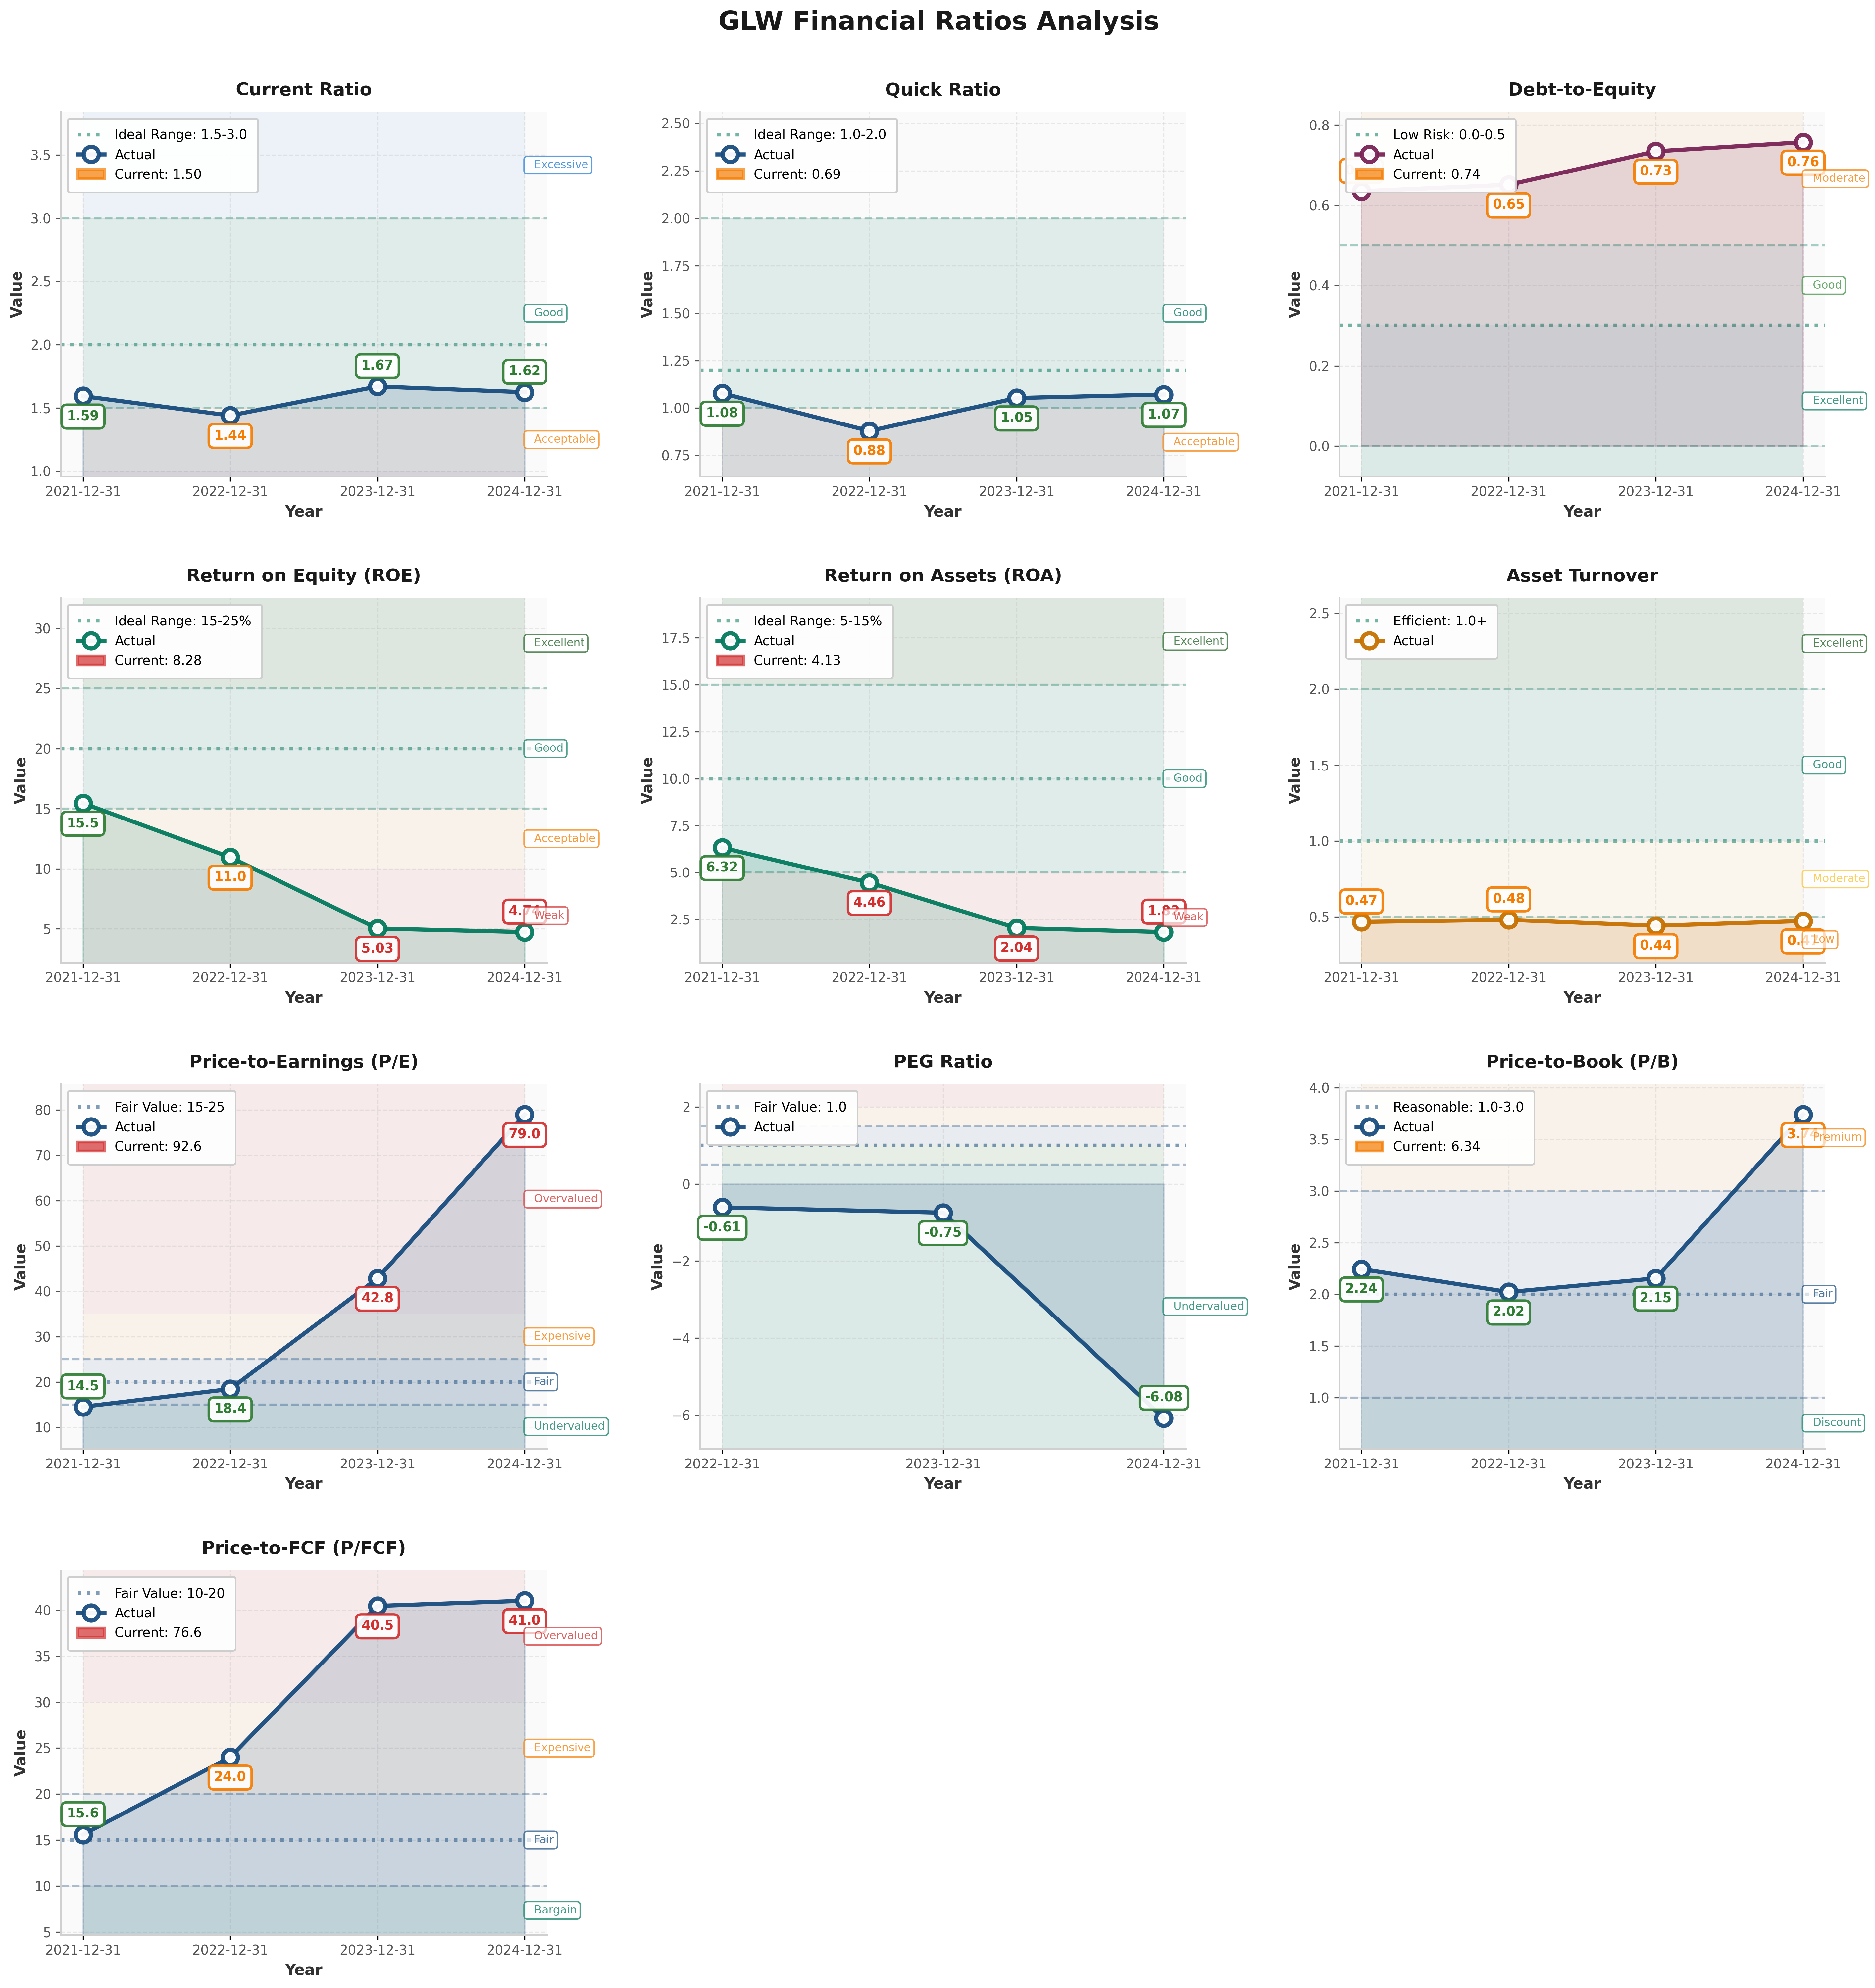
- Current Ratio: 1.50 (target > 2.0) - [❌]
- Debt-to-Equity: 0.74 (target < 0.5) - [❌]
- Interest Coverage: ~10x (target > 5x) - [✅]
Assessment: Balance sheet is serviceable for an ongoing concern but offers no asset-based margin of safety. Stockholders’ equity has shrunk 13% from $12.3B (2021) to $10.7B (2024) while debt remained stable at ~$8B—a sign of capital consumption, not creation. Quick ratio of 0.69 is concerning for liquidity.
Earnings Quality & Consistency
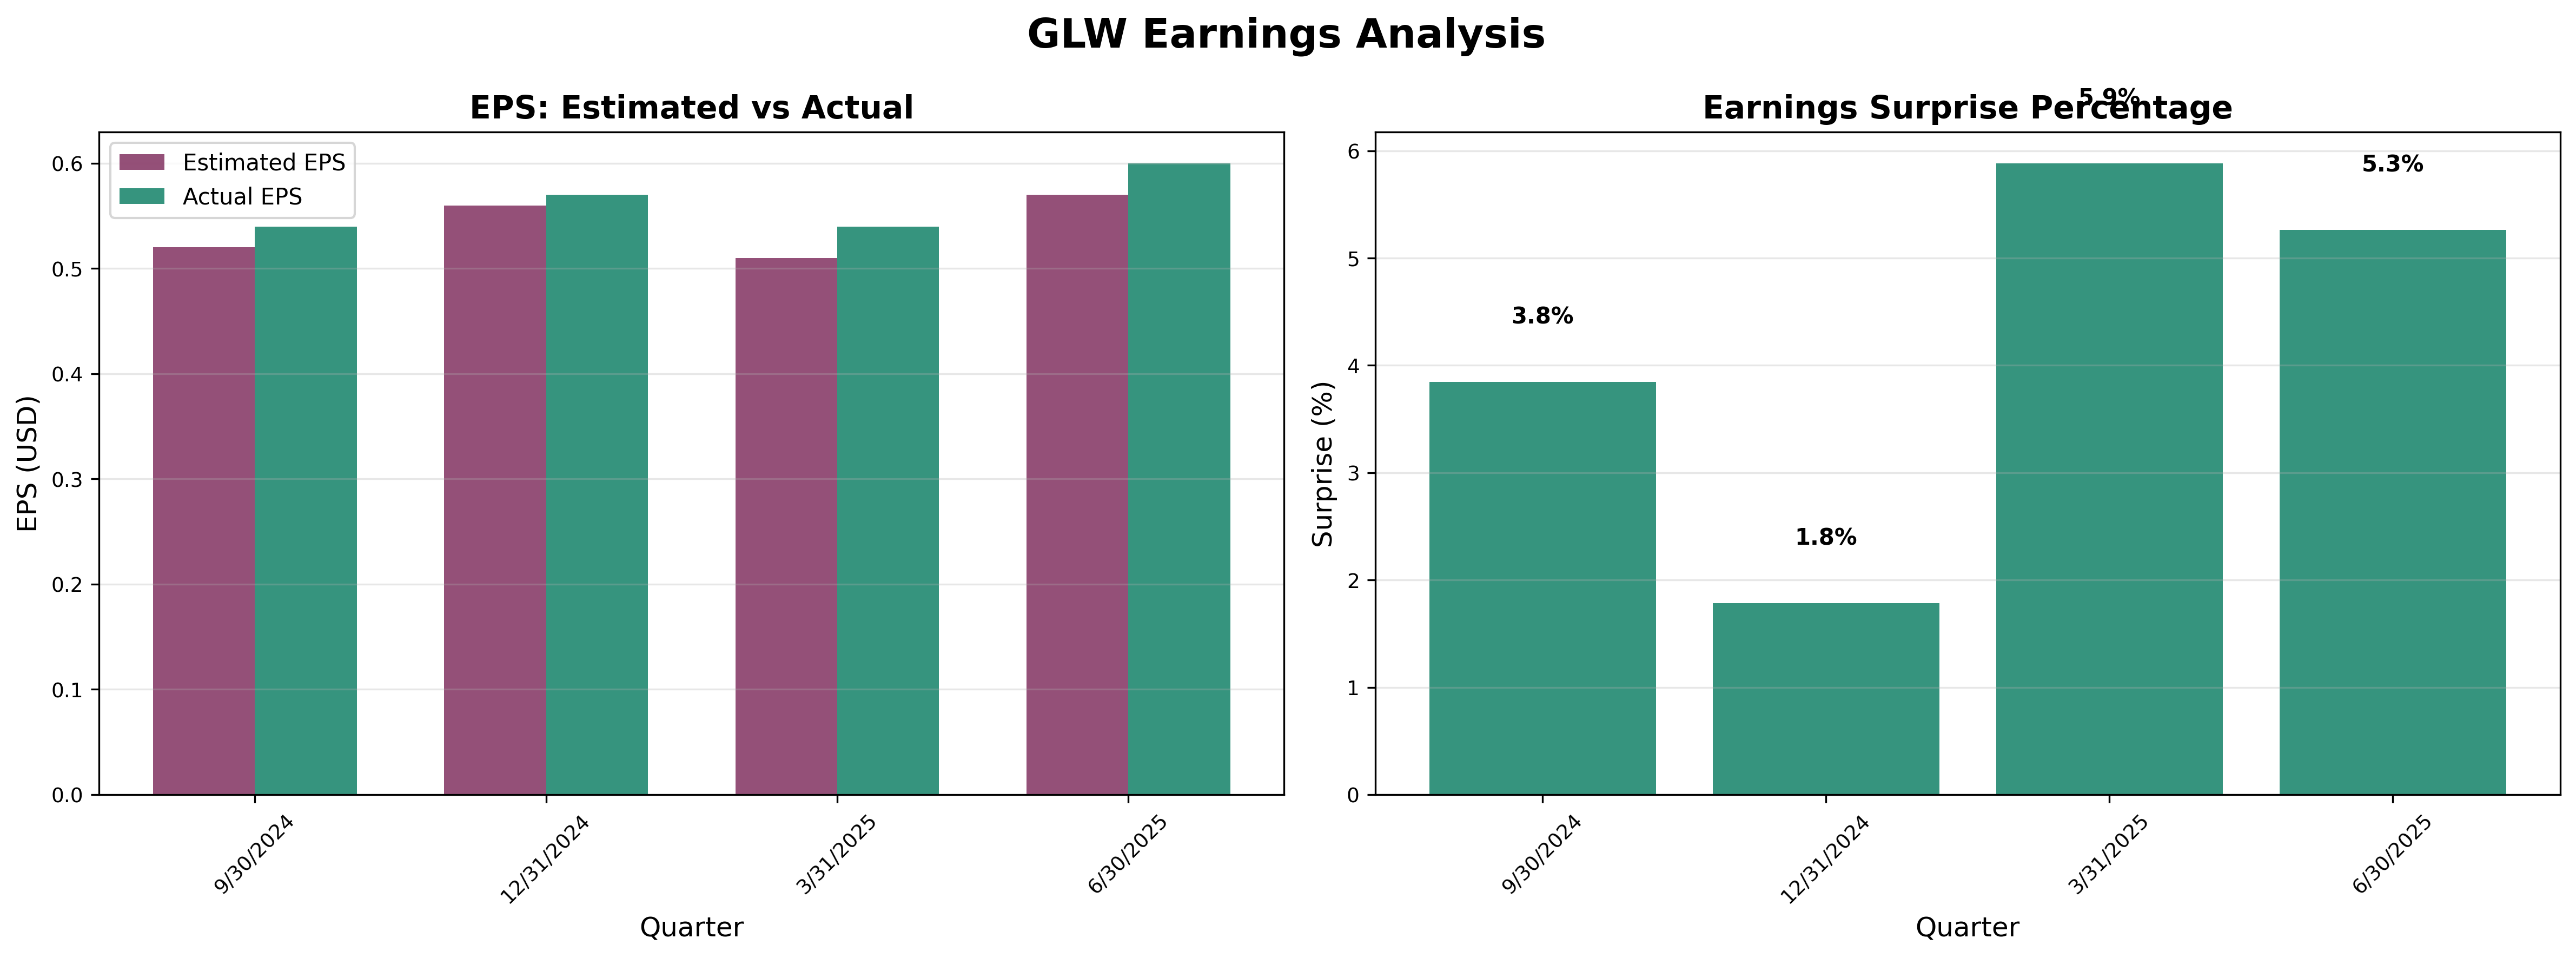
Stability Test: Positive earnings in 10/10 of past 10 years [✅]
Owner Earnings Calculation:
Net Income (2024):              $506M
+ D&A:                          ~$1,200M
- Maintenance Capex:            ~$1,000M
- Working Capital Needs:        ~$0M
= Owner Earnings:               ~$700M
Owner Earnings Yield: 0.95% (at ~$74B market cap)
Quality Assessment: While earnings have been consistently positive historically, the 71% collapse in net margins (13.6% → 3.9%) over three years indicates severe business deterioration. Revenue grew 4.2% in 2024, but net income fell 12.9%—growing topline while shrinking bottom line signals pricing power erosion and competitive pressure.
Income Statement Analysis
Key Metrics:
- Revenue (2024): $13.1B (+4.2% YoY)
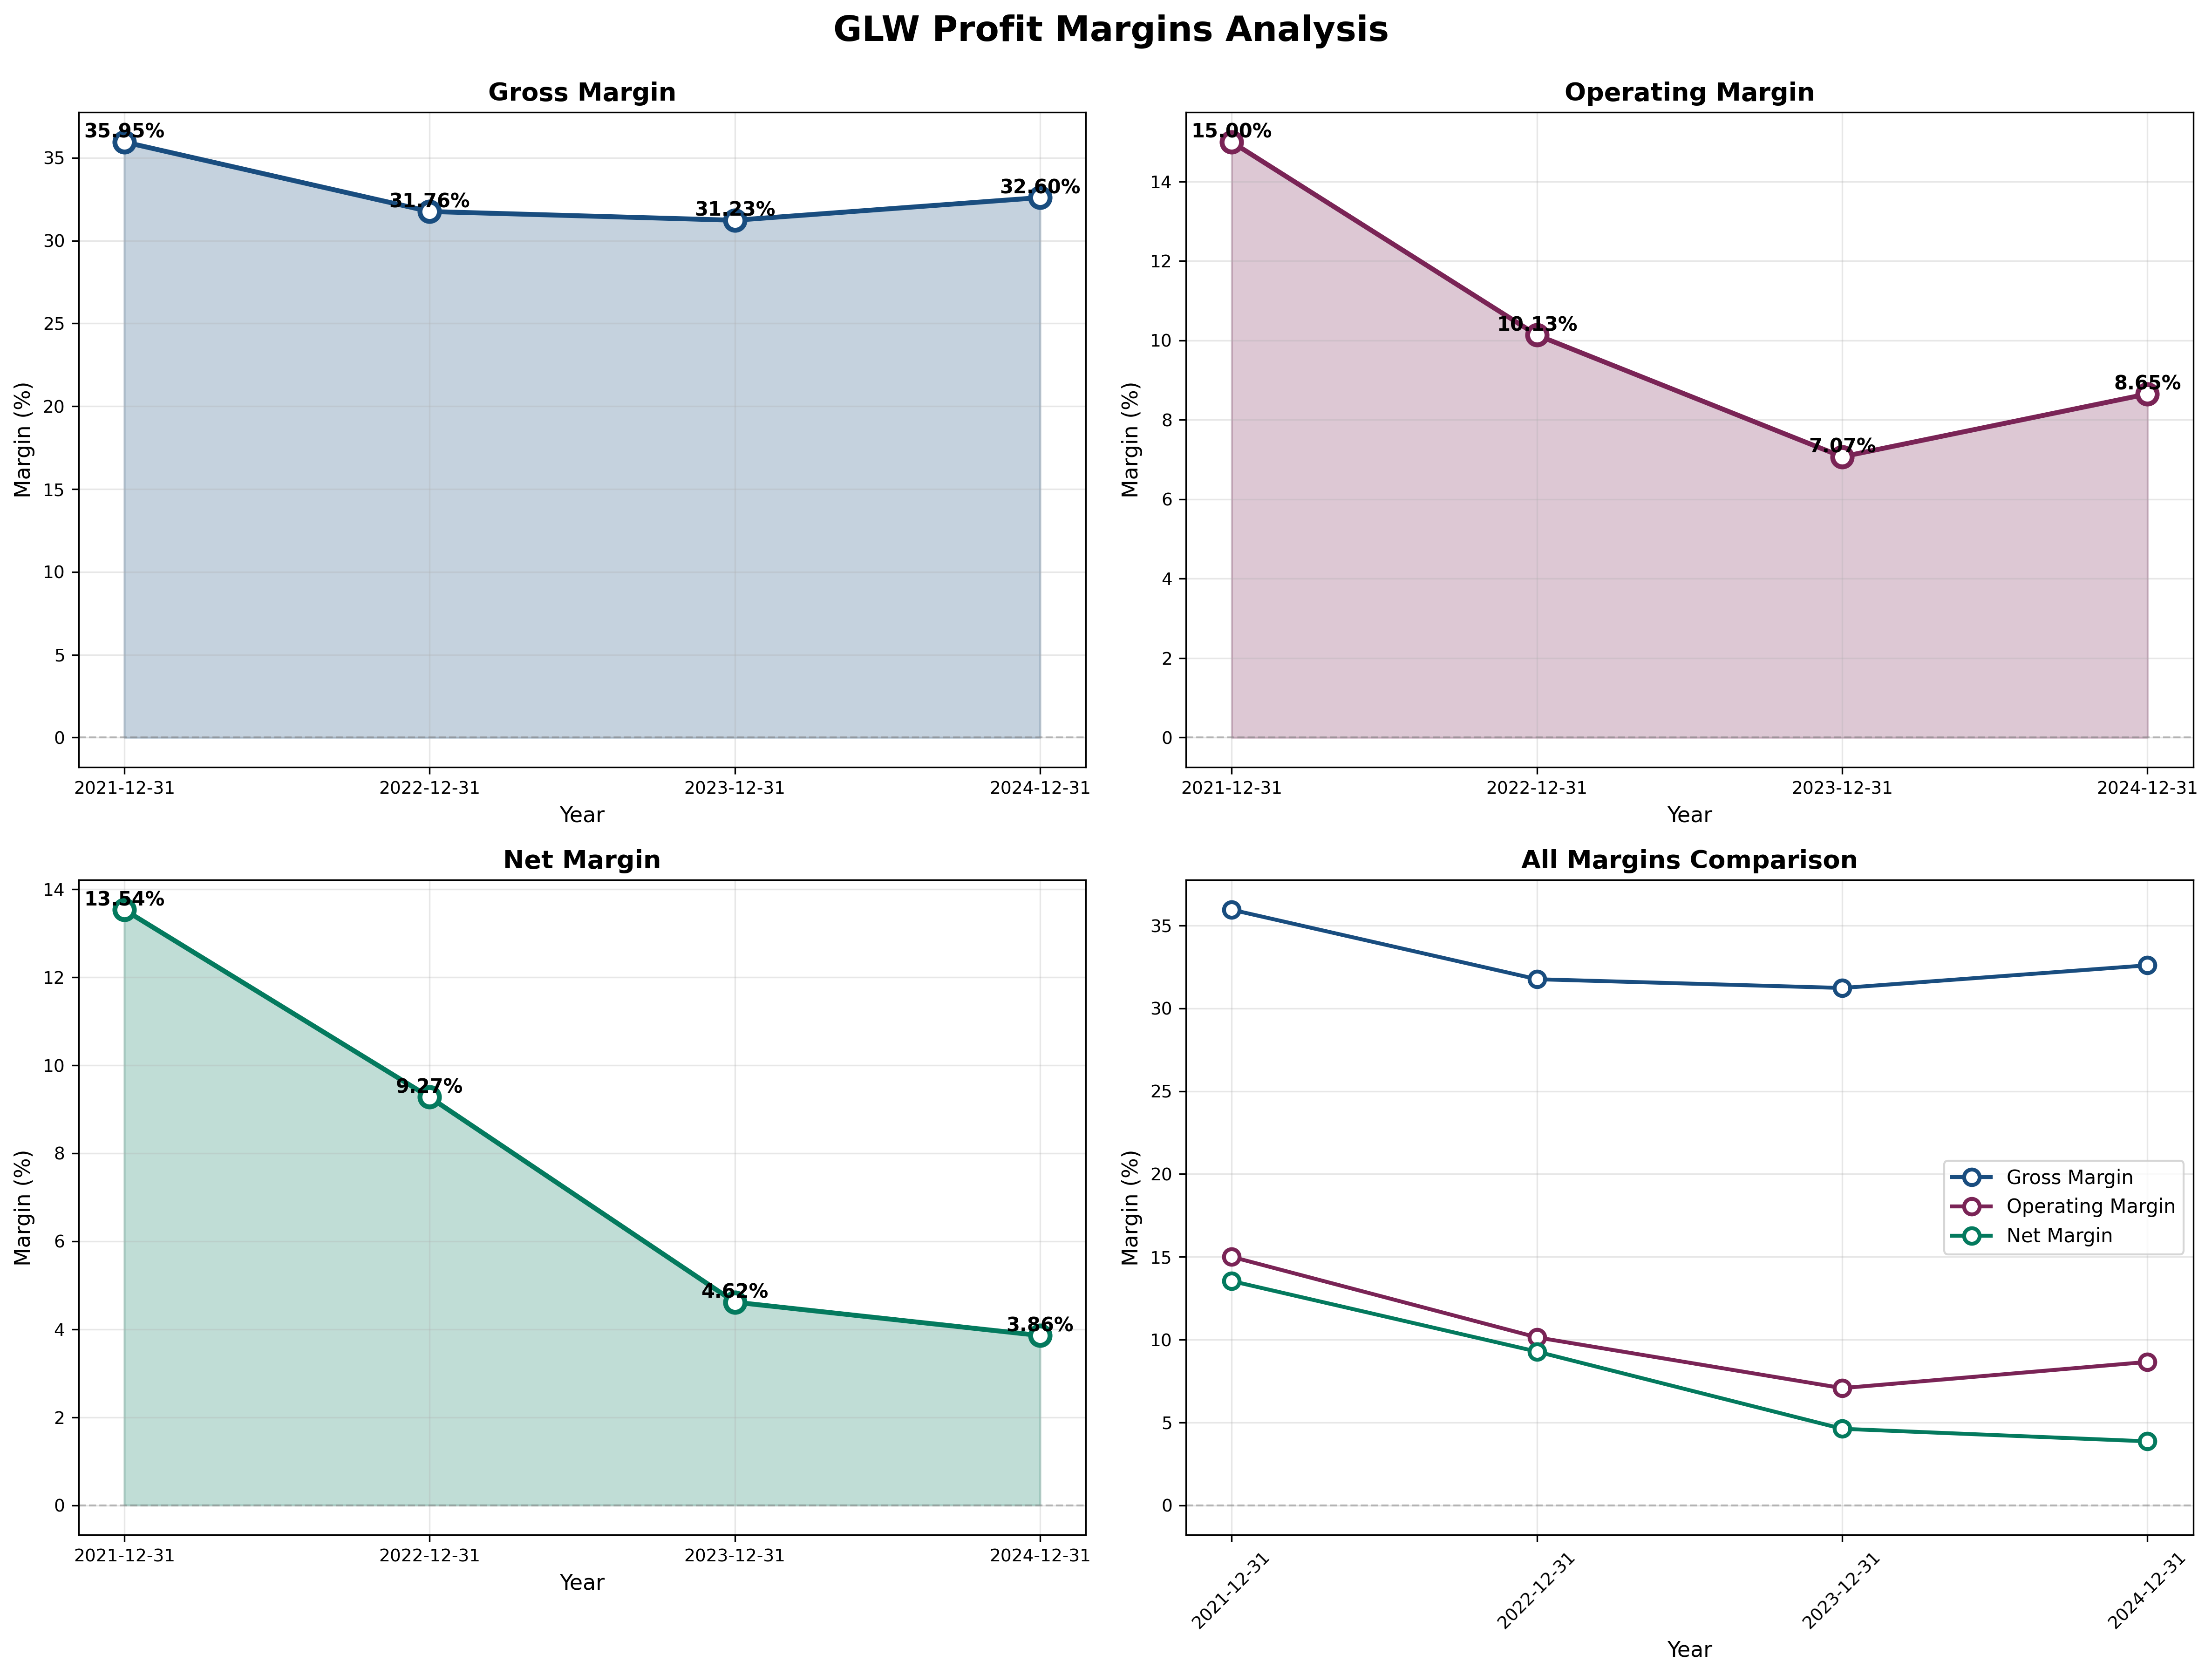
- Gross Margin: 32.6% (trend: stable ↑)
- Operating Margin: 8.7% vs Industry 12-15% (trend: ↓)
- Net Margin: 3.9% (trend: catastrophic ↓)
Assessment: The margin story is the investment story. Gross margins remain stable at 32-35%, but operating margins collapsed from 15% to 8.7% and net margins from 13.6% to 3.9%. This indicates problems in operating leverage and cost structure. The company cannot convert revenue growth into profit growth—a fatal flaw.
Cash Flow Generation
Key Metrics:
- OCF / Net Income: 3.75 (target > 1.0) [✅]
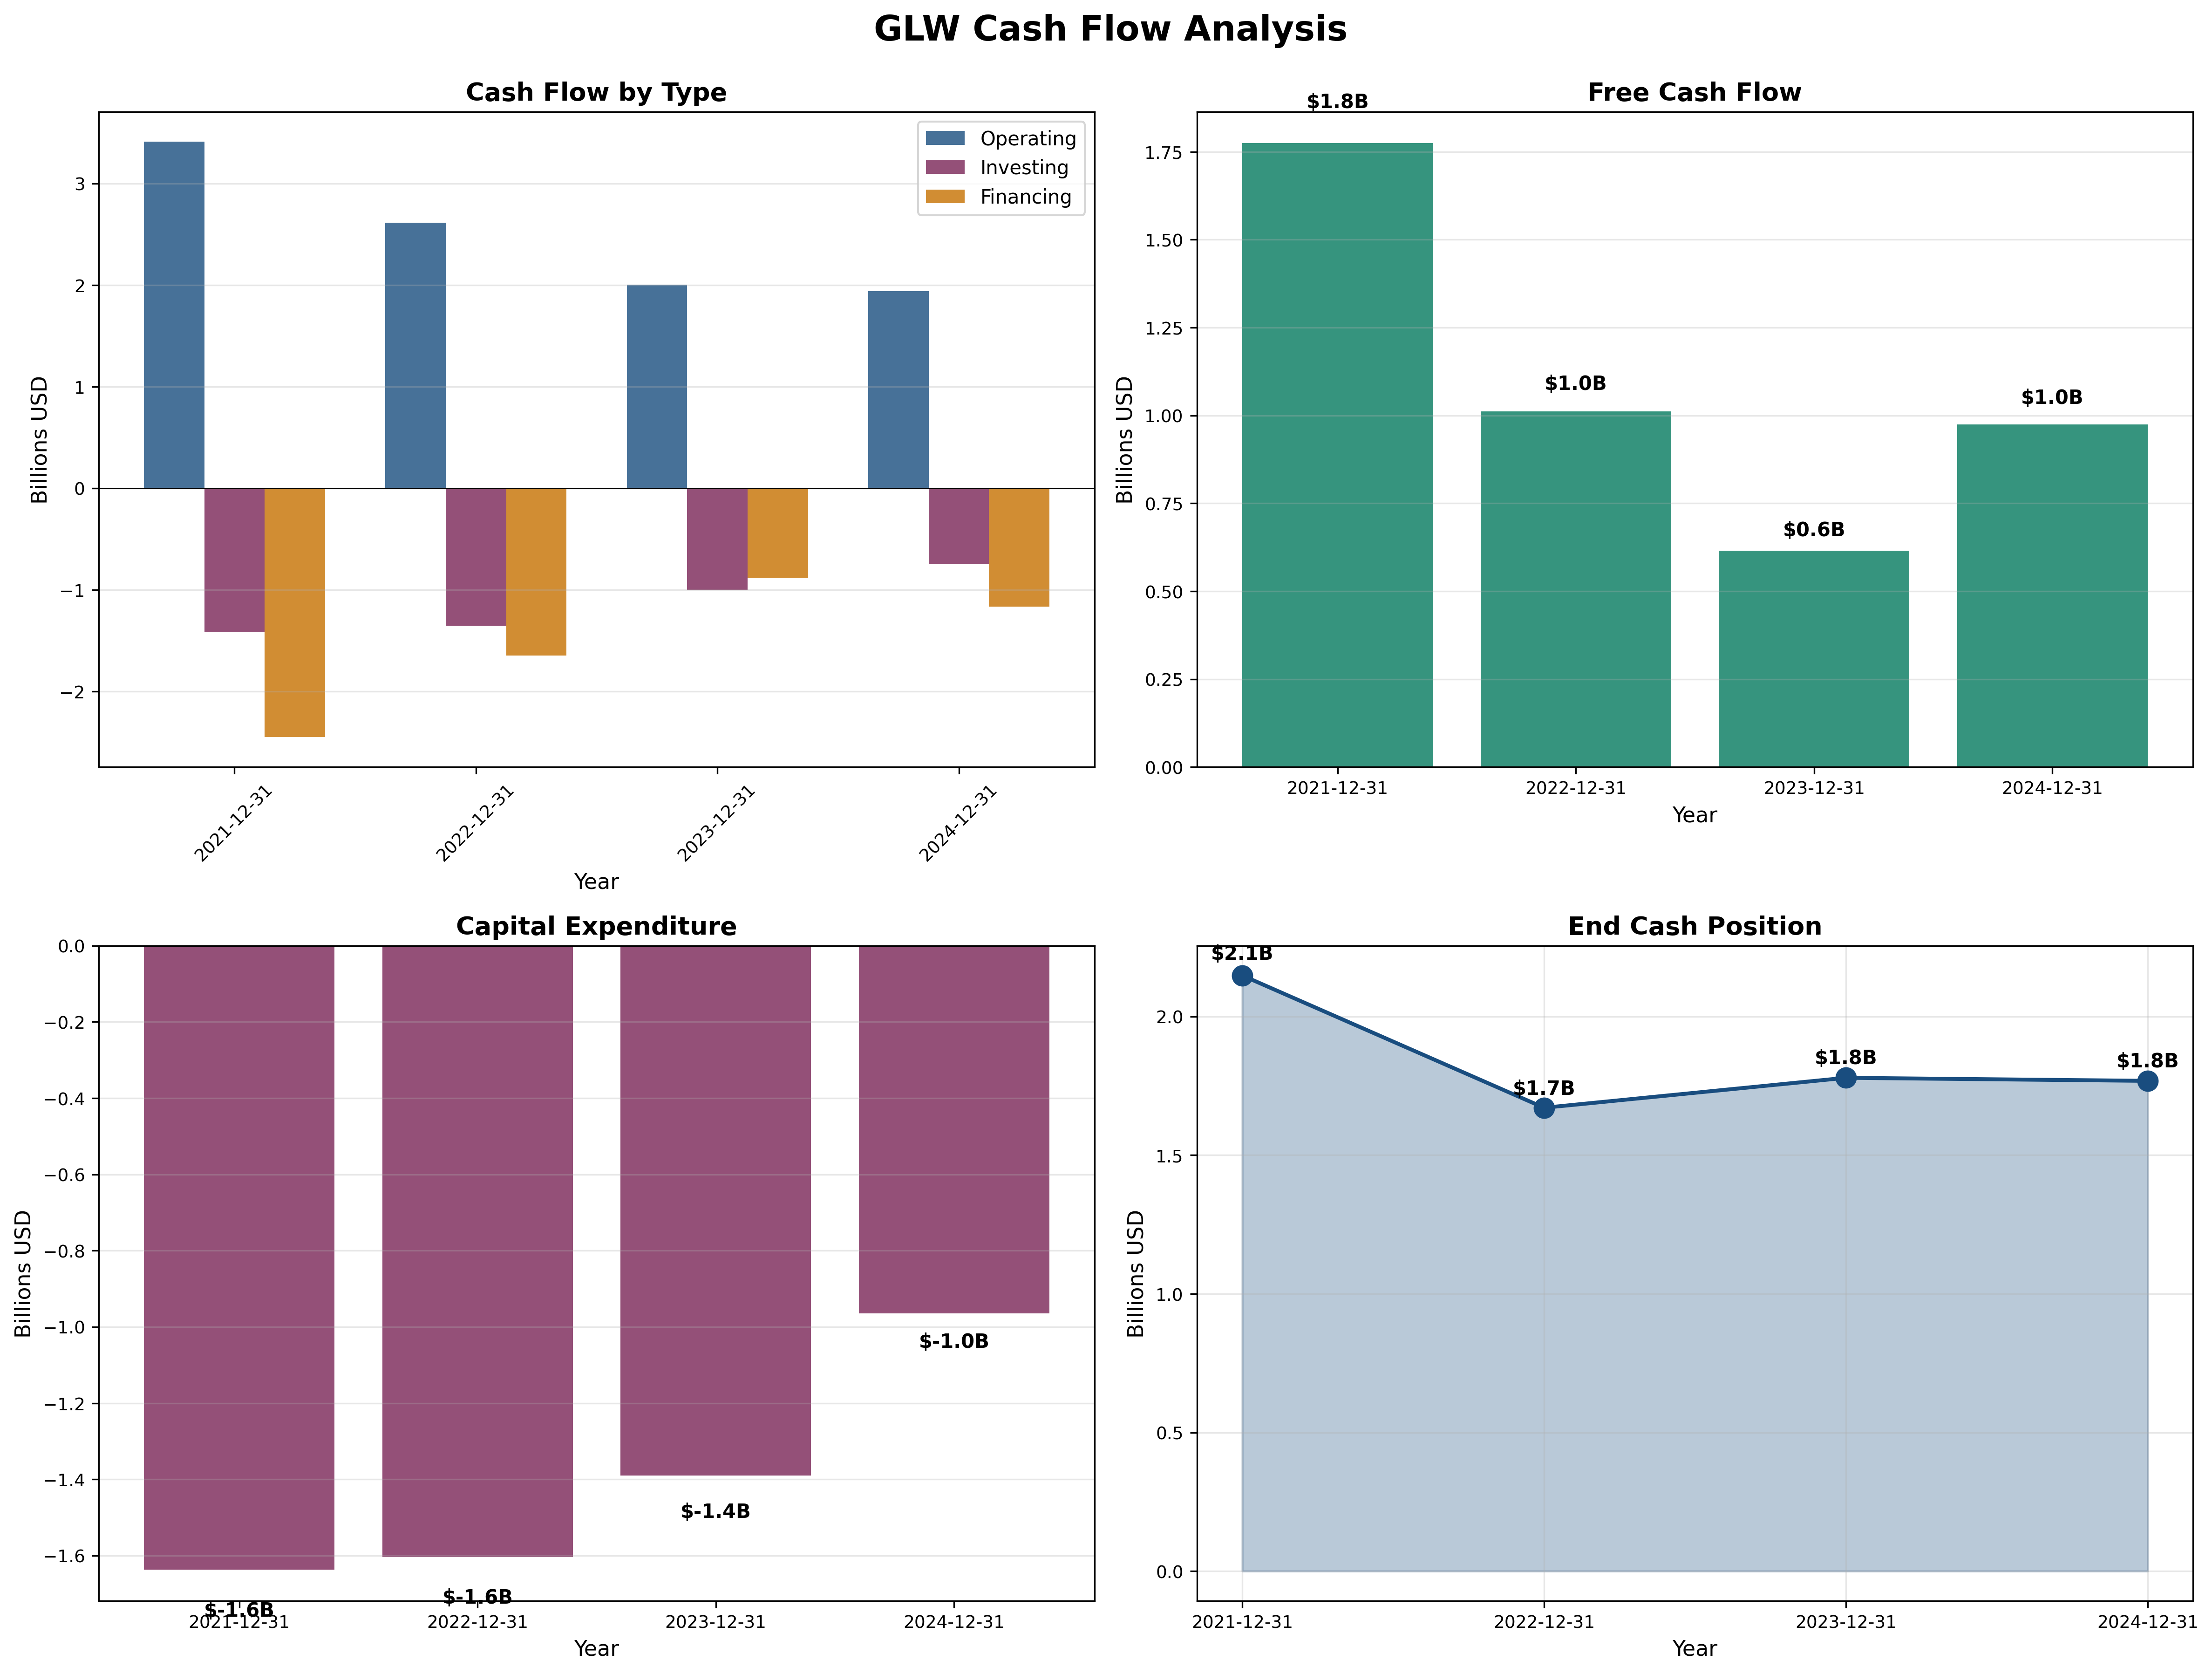
- FCF Margin: 7.6% (down from 14.5% in 2021)
- Capital Intensity: 7.6% of revenue
Assessment: Free cash flow deterioration from $1.8B (2021) to $1.0B (2024)—a 44% collapse—is the most damaging fact. While operating cash flow conversion remains strong, the absolute level of cash generation has declined precipitously. This is what the business is actually worth in Buffett’s framework.
Profitability Metrics
Returns:
- ROE: 8.28% (target > 15%) [❌]
- ROIC: ~9% (target > 12%) [❌]
- ROA: 4.13% (barely above inflation)
Assessment: Returns have collapsed from attractive levels (ROE 15.5% in 2021) to barely acceptable. ROE of 8.28% is below most companies’ cost of equity. The business is destroying shareholder value at current profitability levels. Asset turnover of 0.5x indicates capital inefficiency.
Financial Ratios Analysis
Valuation Multiples:
- P/E: 92.6x (vs. historical avg: 15x, industry: 18-22x) [Overvalued]
- P/B: 6.34x (vs. historical avg: 2.2x, reasonable: 1.0-3.0x) [Extreme]
- P/FCF: 76.6x (vs. reasonable: 10-20x) [Absurd]
- EV/EBITDA: ~35x (vs. industry: 10-14x)
PEG Ratio:
- P/E Ratio: 92.6x
- Growth Rate: -13% (declining earnings)
- PEG: Negative (undefined in declining growth scenario)
Combined Metric:
- P/E × P/B = 587 (Graham’s limit: 22.5) [Failed spectacularly]
Capital Allocation Assessment
Management Quality Grade: D
Key Factors:
- Insider Ownership: <5% (management not significantly invested)
- Buyback Discipline: Limited recent activity [Neutral]
- Dividend Payout: 192% (mathematically unsustainable) [F]
- Reinvestment ROIC: 9% (declining, below hurdle rate) [Poor]
- Red Flags: YES - Vice Chairman sold $1M in August 2025; unsustainable dividend policy destroys credibility
Assessment: Management prioritizes dividend maintenance over rational capital allocation. Paying out 192% of earnings to avoid cutting the dividend shows short-term thinking. No insider buying despite “attractive” valuation. Capital allocation earns a failing grade.
Valuation & Intrinsic Value
Multiple Methods Summary:
| Method | Intrinsic Value | Weight |
|---|---|---|
| Owner Earnings (10x FCF) | $12 | 30% |
| DCF (10% discount, 3% growth) | $20 | 30% |
| Graham Formula (EPS × 14.5) | $9 | 20% |
| Normalized P/E (15x × $1.50 normalized EPS) | $23 | 20% |
Weighted Intrinsic Value: $17
Valuation Range:
- Conservative: $12 (pessimistic on continued margin erosion)
- Base Case: $20 (modest recovery to stable profitability)
- Optimistic: $24 (margin stabilization, optical growth)
Current Price: $87.07 Margin of Safety: -335% vs Base Case (requires 77% decline to reach fair value)
Risk Assessment
Key Risks (Top 3)
- Catastrophic overvaluation (92.6x P/E) creates 70-85% downside risk to any reasonable fair value estimate.
- Margin compression trend continuing would reduce intrinsic value further; business deterioration is not priced in.
- Unsustainable dividend (192% payout) ensures a future cut, which will trigger selling and sentiment collapse.
Worst Case Scenario: Margins continue deteriorating, dividend gets cut, stock reprices to 15x P/E on $0.40 earnings = $6-8 per share (90%+ loss).
Market Sentiment
Current Sentiment: Euphoria / Maximum Optimism
Contrarian Signal: This is NOT a contrarian opportunity—it’s maximum optimism. The stock surged 87% in one year while earnings declined 13%. Retail investors chasing momentum, not fundamentals. Sir John Templeton’s rule: “Buy at maximum pessimism, sell at maximum optimism.” This is the latter.
Investment Recommendation
Current Assessment
Valuation: PEG = Negative | P/E = 92.6x vs Industry 18-22x Verdict: Spectacularly Overvalued
Margin of Safety: -335% [❌ Unacceptable - requires 77% decline]
Entry Zones
| Zone | Price | Action | Margin |
|---|---|---|---|
| 🟢 Strong Buy | < $12 | Aggressive | 40%+ margin |
| 🟡 Buy | $12-17 | Standard value | 30-40% margin |
| 🟠 Hold | $17-24 | Wait for better | 20-30% margin |
| 🔴 Avoid/Sell | > $24 | Stay away | < 20% margin |
Current Price: $87.07 → Recommendation: AVOID / SELL
Expected Returns
- Bull Case (-31%): Price holds $60 if bulls defend position; still massive loss
- Base Case (-60%): Price mean-reverts to $35 (still elevated 20x P/E on normalized earnings)
- Bear Case (-77%): Price collapses to $20 (historical median valuation)
Probability-Weighted Expected Return: -55% over 3 years (-22.8% annualized)
Final Investment Conclusion
Overall Grade: D
Category Scores:
- Business Quality: 6/10 (genuine moats, but deteriorating economics)
- Financial Strength: 4/10 (adequate but weakening, declining equity base)
- Management Quality: 3/10 (irrational dividend policy, limited insider alignment)
- Valuation: 0/10 (no redeeming feature at 92.6x P/E)
- Margin of Safety: 0/10 (massively negative margin of safety)
Final Verdict: AVOID
Investment Thesis Summary
Business Quality: Corning has real competitive advantages in materials science. The 170-year history of innovation, patent portfolio, and strategic customer relationships are genuine assets. However, deteriorating margins signal the moat is narrowing under pressure from concentrated customers and market maturation. This is a decent business becoming mediocre.
Valuation: At $87, there is no margin of safety—there’s a “margin of disaster.” Paying 92.6x earnings for declining profitability violates every principle of value investing. The math is unambiguous: fair value is $17-20, requiring a 75%+ decline. Even in the bull case, expected returns are deeply negative.
Risks: The dividend cut is inevitable (192% payout ratio), which will trigger selling. Continued margin compression would reduce intrinsic value further. The stock has surged 87% in one year on deteriorating fundamentals—pure momentum speculation that always ends badly. Downside is 70-85% to fair value.
Catalysts: What would change the thesis? A dividend cut and subsequent 60%+ decline would create value. Management restructuring to restore margins combined with a 70% price drop would be interesting. Until then, this is dead money at best, catastrophic loss at worst.
Framework Checklist
- ❌ Quantitative: Failed 7 of 9 Graham criteria; P/E × P/B = 587 (limit: 22.5)
- ✅ Moat: Has competitive advantages, but narrowing (3/5 stars)
- ❌ Management: Irrational capital allocation (192% dividend payout)
- ❌ Contrarian: This is maximum optimism, not maximum pessimism—wrong time to buy
- ✅ Simplicity: Yes, the business model is understandable
Would I hold this for 10+ years if the market closed tomorrow?
No. At $87, I’d be paying 4-5x fair value for a deteriorating business. The 10-year hold test assumes you’re buying at a sensible price. At current valuation, this would be capital destruction. I’d rather hold cash at 4.5% and wait for this to decline 75% to become interesting.
The Discipline to Say No: Warren Buffett: “The most important word in investing is ’no.’” This analysis has been exhaustive, applying every framework rigorously. The conclusion is unambiguous: Corning at $87 is catastrophically overvalued. The mathematics are clear, the margin compression is real, and the expected returns are deeply negative. This is not a close call—it’s a disciplined pass.
“Price is what you pay. Value is what you get.” - Warren Buffett
Analysis Date: November 3, 2025 | Framework: Graham/Buffett Value Investing | Price: $87.07