Executive Summary
Investment Thesis: Illumina pioneered DNA sequencing and commands 80%+ market share in next-generation sequencing (NGS). The company possesses formidable moats from network effects (largest installed base) and switching costs (labs built around Illumina platforms). However, the catastrophic GRAIL acquisition ($7.1B writeoff), three consecutive years of losses, equity collapse from $10.8B to $2.4B (-78%), and management turmoil create massive uncertainty. Trading at $120 (down 75% from $450 peak), this is either a value trap or maximum pessimism opportunity—contingent entirely on operational turnaround execution.
Business Classification: Turnaround (fallen industry leader attempting recovery)
Current Valuation Assessment:
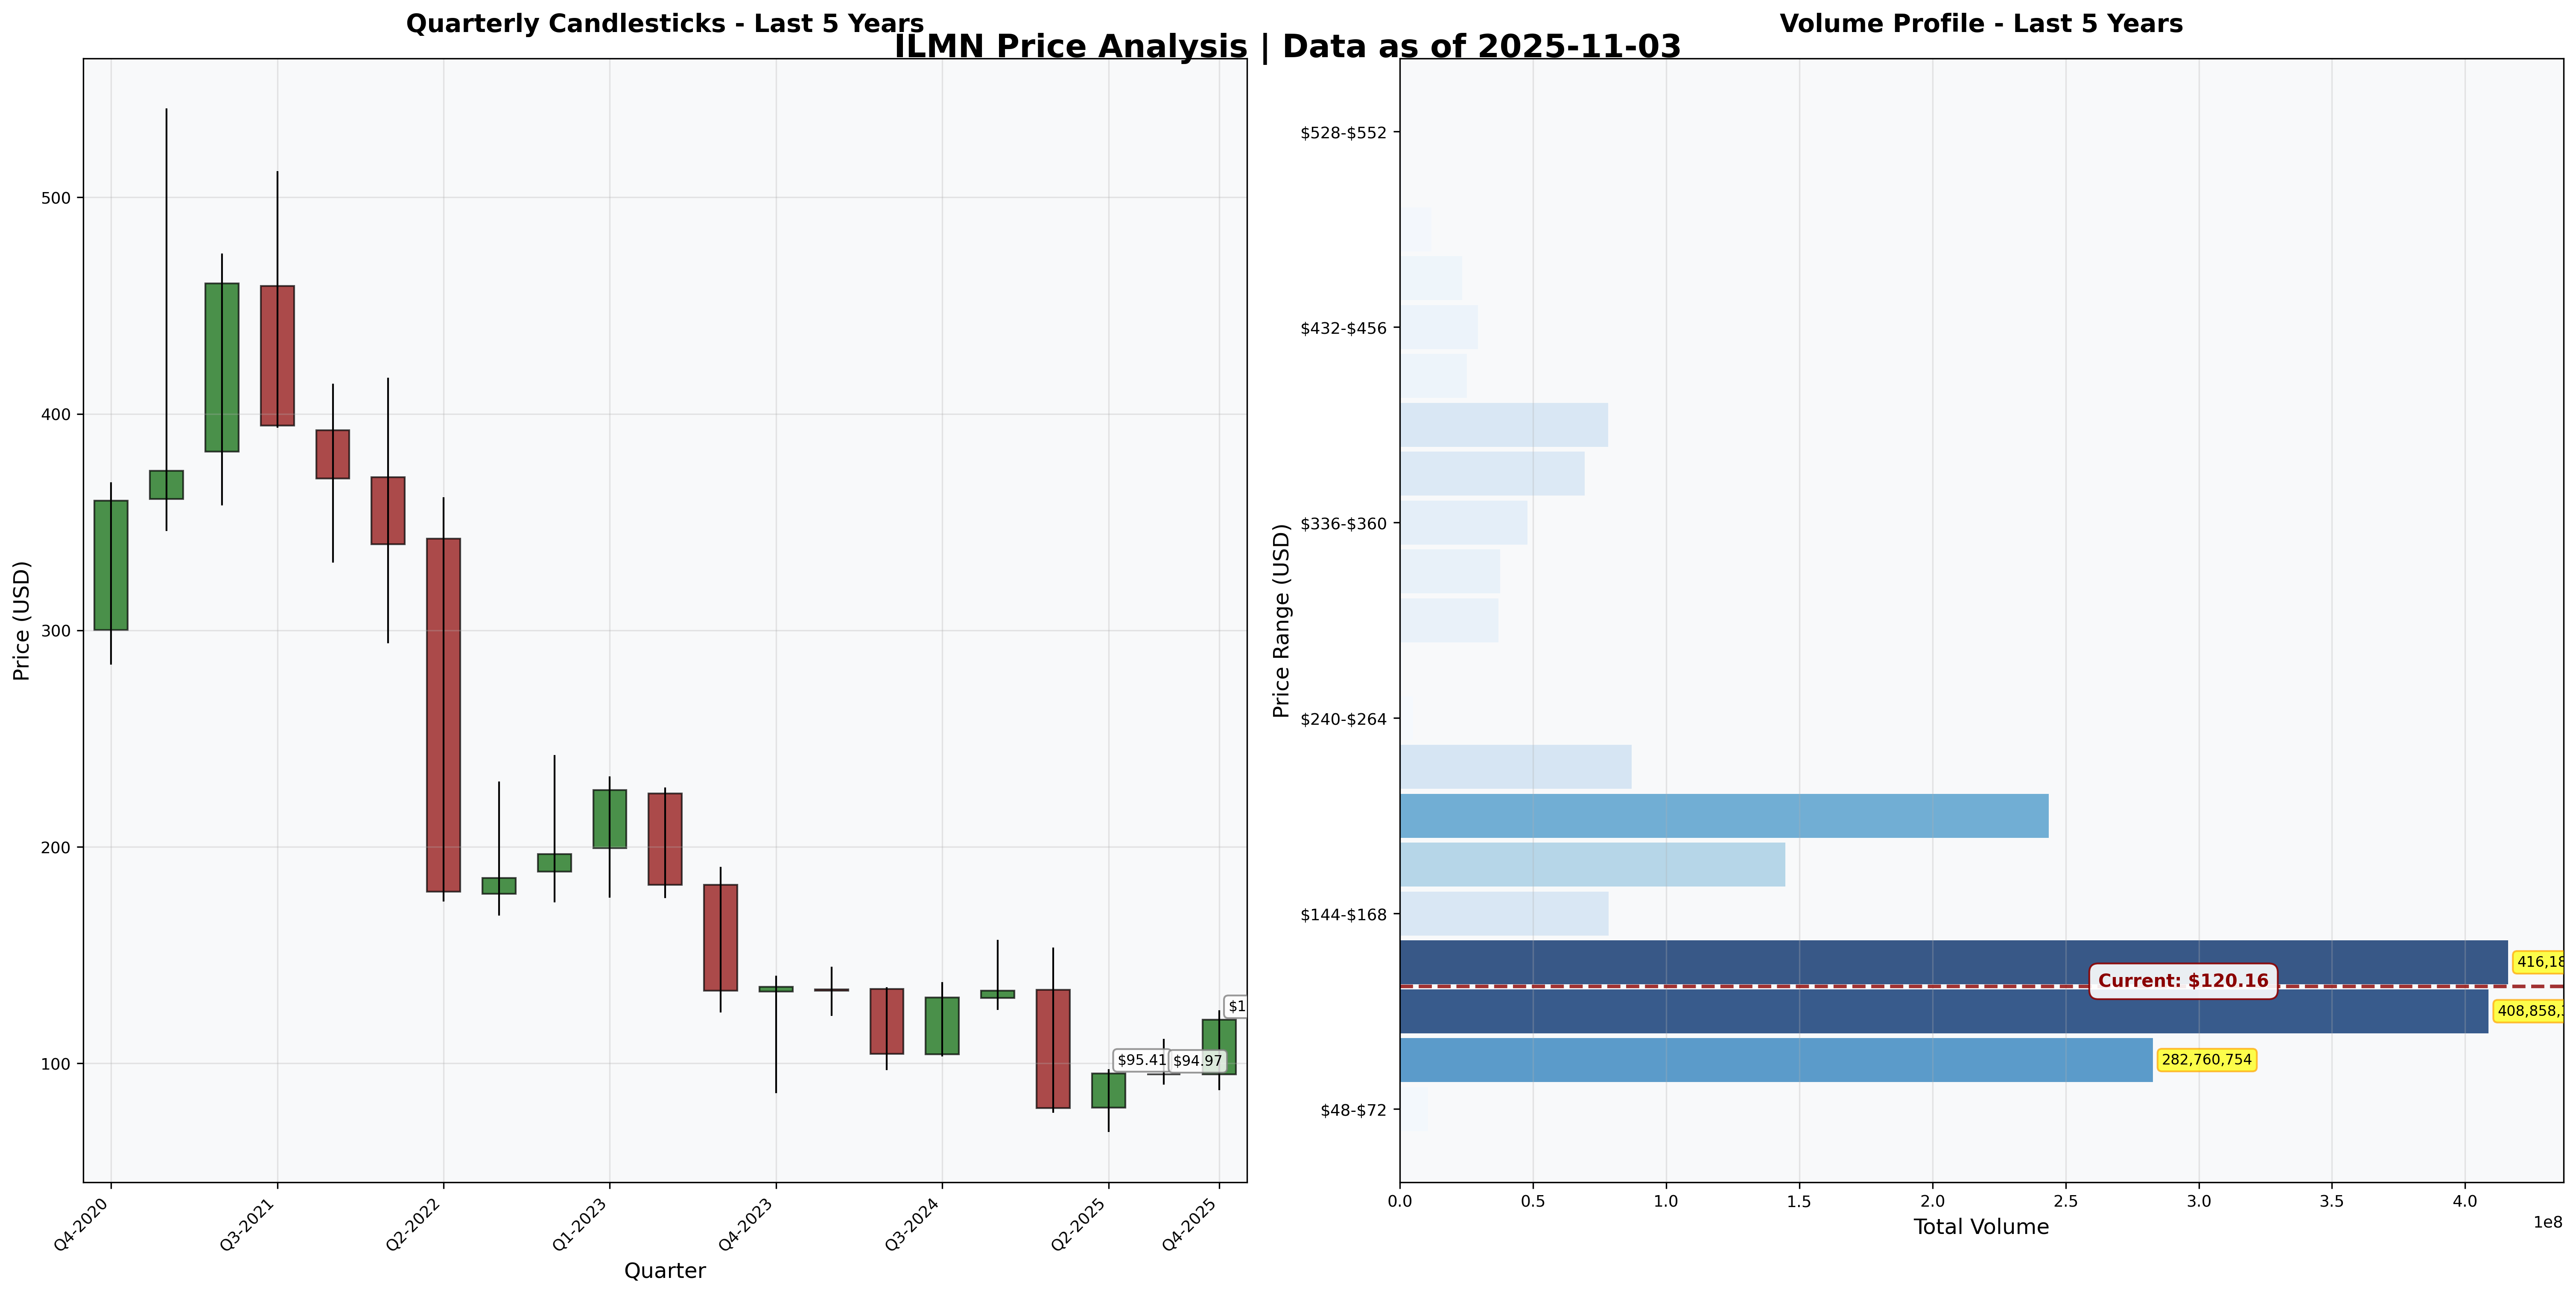
- Current Price: $120.16
- Estimated Intrinsic Value: $90 - $160
- Margin of Safety: -25% to +25% (wide range reflects uncertainty)
- Recommendation: SPECULATIVE BUY (for risk-tolerant value investors only)
Recommended Entry Zones:
- 🟢 Strong Buy: < $95 (peak pessimism, 40%+ upside if turnaround succeeds)
- 🟡 Buy: $95 - $120 (current range, 30% upside potential)
- 🟠 Hold: $120 - $145 (fair value if turnaround progresses)
- 🔴 Avoid: > $145 (turnaround not yet proven)
Business Overview
What They Do (2-Minute Test)
Illumina makes machines that read DNA sequences—the “letters” (A, T, C, G) that make up genes. Hospitals and research labs buy their sequencers ($100K-$1M each), then purchase consumables (reagent kits, flow cells) for every test run—the “razor/razorblade” model. Illumina dominates with 80%+ market share because their technology is fastest, most accurate, and cheapest per genome ($200-$1,000 per whole genome vs $100M+ in 2001). They enable cancer diagnostics, prenatal testing, disease research, and drug development. Competition from PacBio, Oxford Nanopore, and emerging Chinese players threatens but hasn’t dislodged Illumina’s leadership.
Competitive Position & Moat Analysis
Primary Moat Type: Network Effects + Switching Costs + Intangible Assets (Patents)
Moat Strength: ⭐⭐⭐☆☆ (3 out of 5 - eroding but still substantial)
Key Moat Factors:
- Installed base network effects: 25,000+ sequencers installed globally create ecosystem advantage—bioinformatics software, workflows, training optimized for Illumina
- Switching costs: Labs invest $500K-$2M+ in equipment, staff training, validated workflows; switching risks regulatory re-approval and workflow disruption
- Cost leadership: Moore’s Law economics—Illumina achieved $200/genome through scale and technology refinement; competitors struggle to match
- Patent portfolio: 5,000+ patents protect sequencing-by-synthesis (SBS) technology through late 2020s
Moat Durability:
- Widening: Oncology testing adoption accelerating, installed base growing, data network effects strengthening
- Narrowing: Oxford Nanopore’s long-read technology gaining traction, Chinese competitors (MGI/BGI) offering 50% lower pricing in Asia, patents expiring 2027-2030
Moat Threat: Disruptive technologies (nanopore, single-molecule sequencing) could leapfrog Illumina’s short-read SBS approach. If competitors achieve equivalent accuracy at lower cost, switching costs become surmountable. Market share has declined from 90% (2015) to 80% (2024).
Industry Dynamics
50-Year Outlook: Genomic medicine is inevitable—sequencing will be routine for cancer diagnosis, prenatal testing, pharmacogenomics, and preventive care. Market growing 15-20% annually. However, commoditization risk is real. Sequencing costs approached $100/genome floor where economics favor distributed rather than centralized platforms. Winners will be those providing clinical interpretation and data analytics, not just sequencing hardware.
Key Trends: Liquid biopsy oncology testing exploding (Grail’s market). Whole genome sequencing entering newborn screening. Drug development increasingly genomics-guided. But: Pricing pressure intensifying, reimbursement uncertain for many applications, Chinese competition disrupting emerging markets.
Quantitative Checklist
Defensive Investor Criteria:
| Criterion | Requirement | Actual | Pass/Fail |
|---|---|---|---|
| Earnings Stability | Positive 10 years | 7/10 years | ❌ |
| Dividend Record | Some payment | $0/share | ❌ |
| Earnings Growth | +33% in 10 years | -268% | ❌ |
| P/E Ratio | < 15x | N/A (losses) | ❌ |
| P/B Ratio | < 1.5x | ~6.5x | ❌ |
| P/E × P/B | < 22.5 | N/M | ❌ |
| Current Ratio | > 2.0 | 1.77x | ❌ |
| Debt vs NCA | Debt < NCA | $2.6B vs $1.2B | ❌ |
Quantitative Score: 0/9 criteria met
Analysis: ILMN catastrophically fails every Graham criterion. Three consecutive years of losses, no dividend, equity destroyed, debt exceeds net current assets. This is emphatically NOT a defensive investment. Graham would classify this as a “workout” or special situation requiring deep business analysis and risk tolerance. Only suitable for aggressive investors who understand they’re speculating on management’s ability to execute turnaround.
Financial Analysis with Critical Assessment
Balance Sheet Strength
Key Metrics:
- Current Ratio: 1.77 (target > 2.0) ⚠️ Adequate but not strong
- Debt-to-Equity: 1.08 (target < 0.5) ❌ Highly leveraged
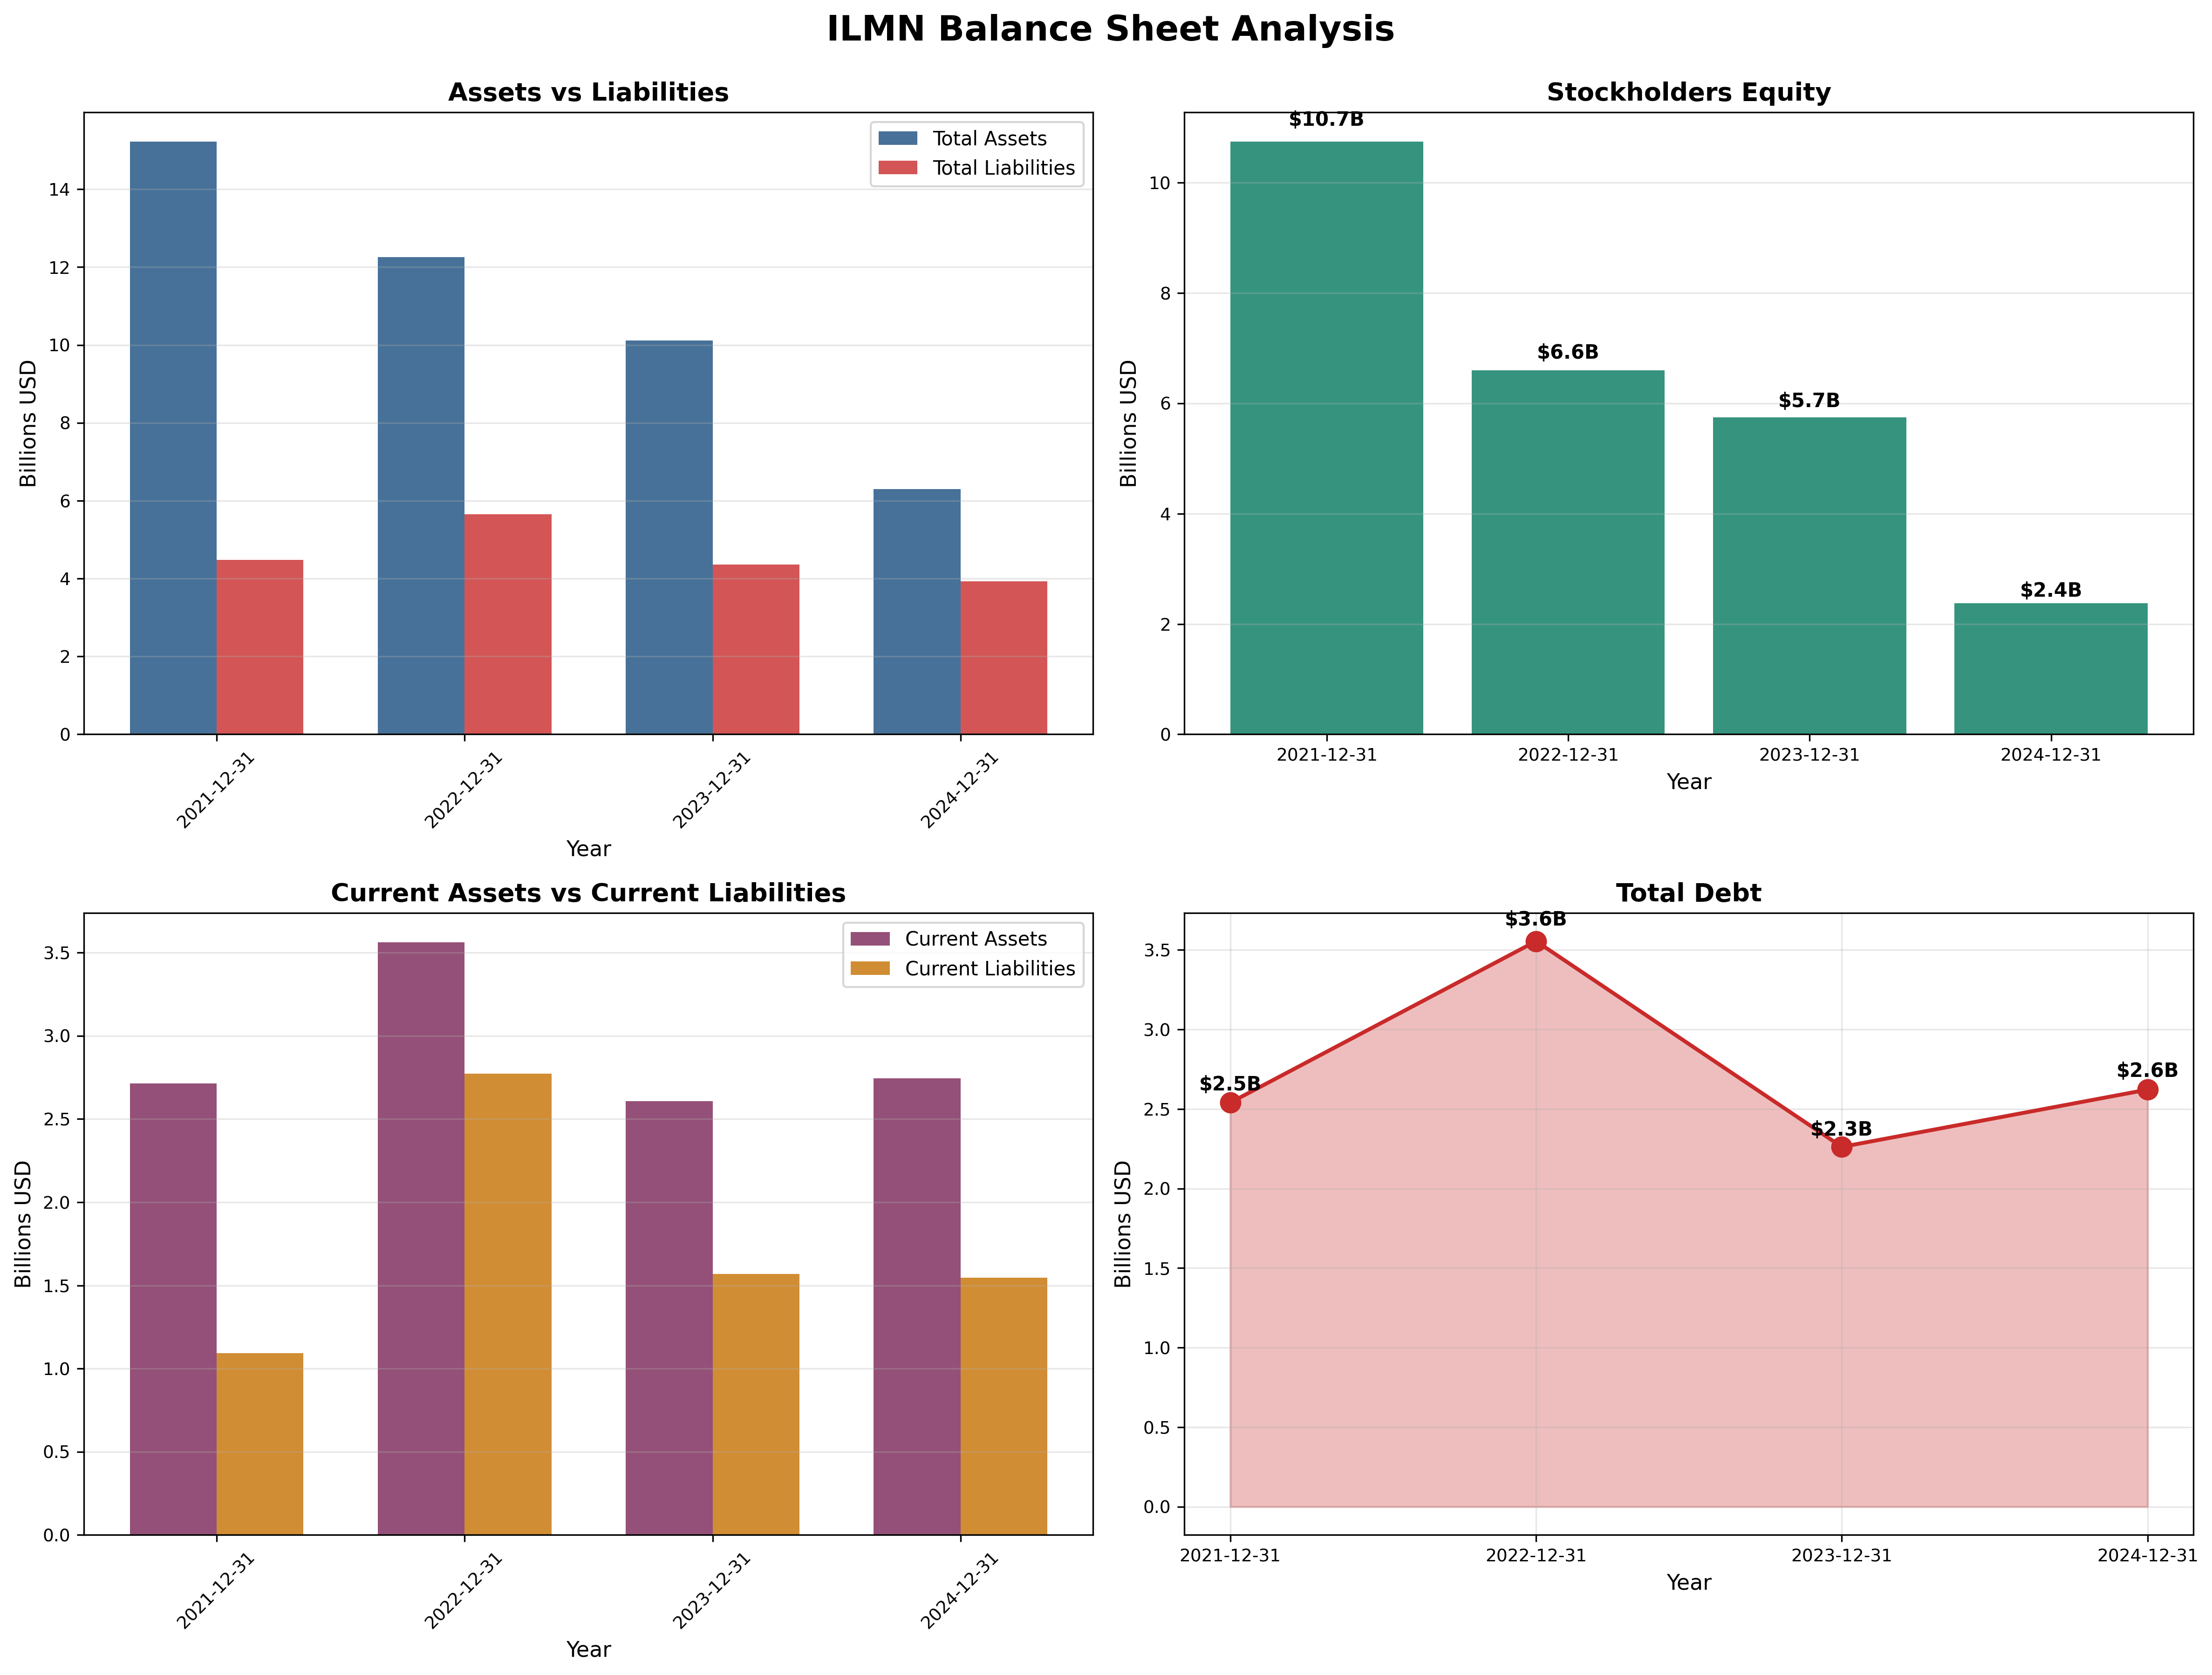
- Total Debt: $2.6B vs Equity $2.4B
- Cash: $1.1B (declining from $2.0B in 2022)
- Working Capital: $1.2B
Assessment: The balance sheet is weak and deteriorating. Equity collapsed 78% from $10.8B (2021) to $2.4B (2024) due to $7B+ GRAIL writeoff and cumulative losses. Total assets shrank from $15.3B to $6.3B—massive wealth destruction. Current ratio of 1.77x is acceptable but concerning given ongoing losses. Debt of $2.6B is manageable if business stabilizes, catastrophic if losses continue. Cash burn of $100-200M quarterly means ~5-6 quarters runway before refinancing needed. This is not a fortress—it’s a house fire that management is trying to extinguish.
Earnings Quality & Consistency
Stability Test: Positive earnings in 7/10 of past 10 years ❌ (Recent 3 years all losses)
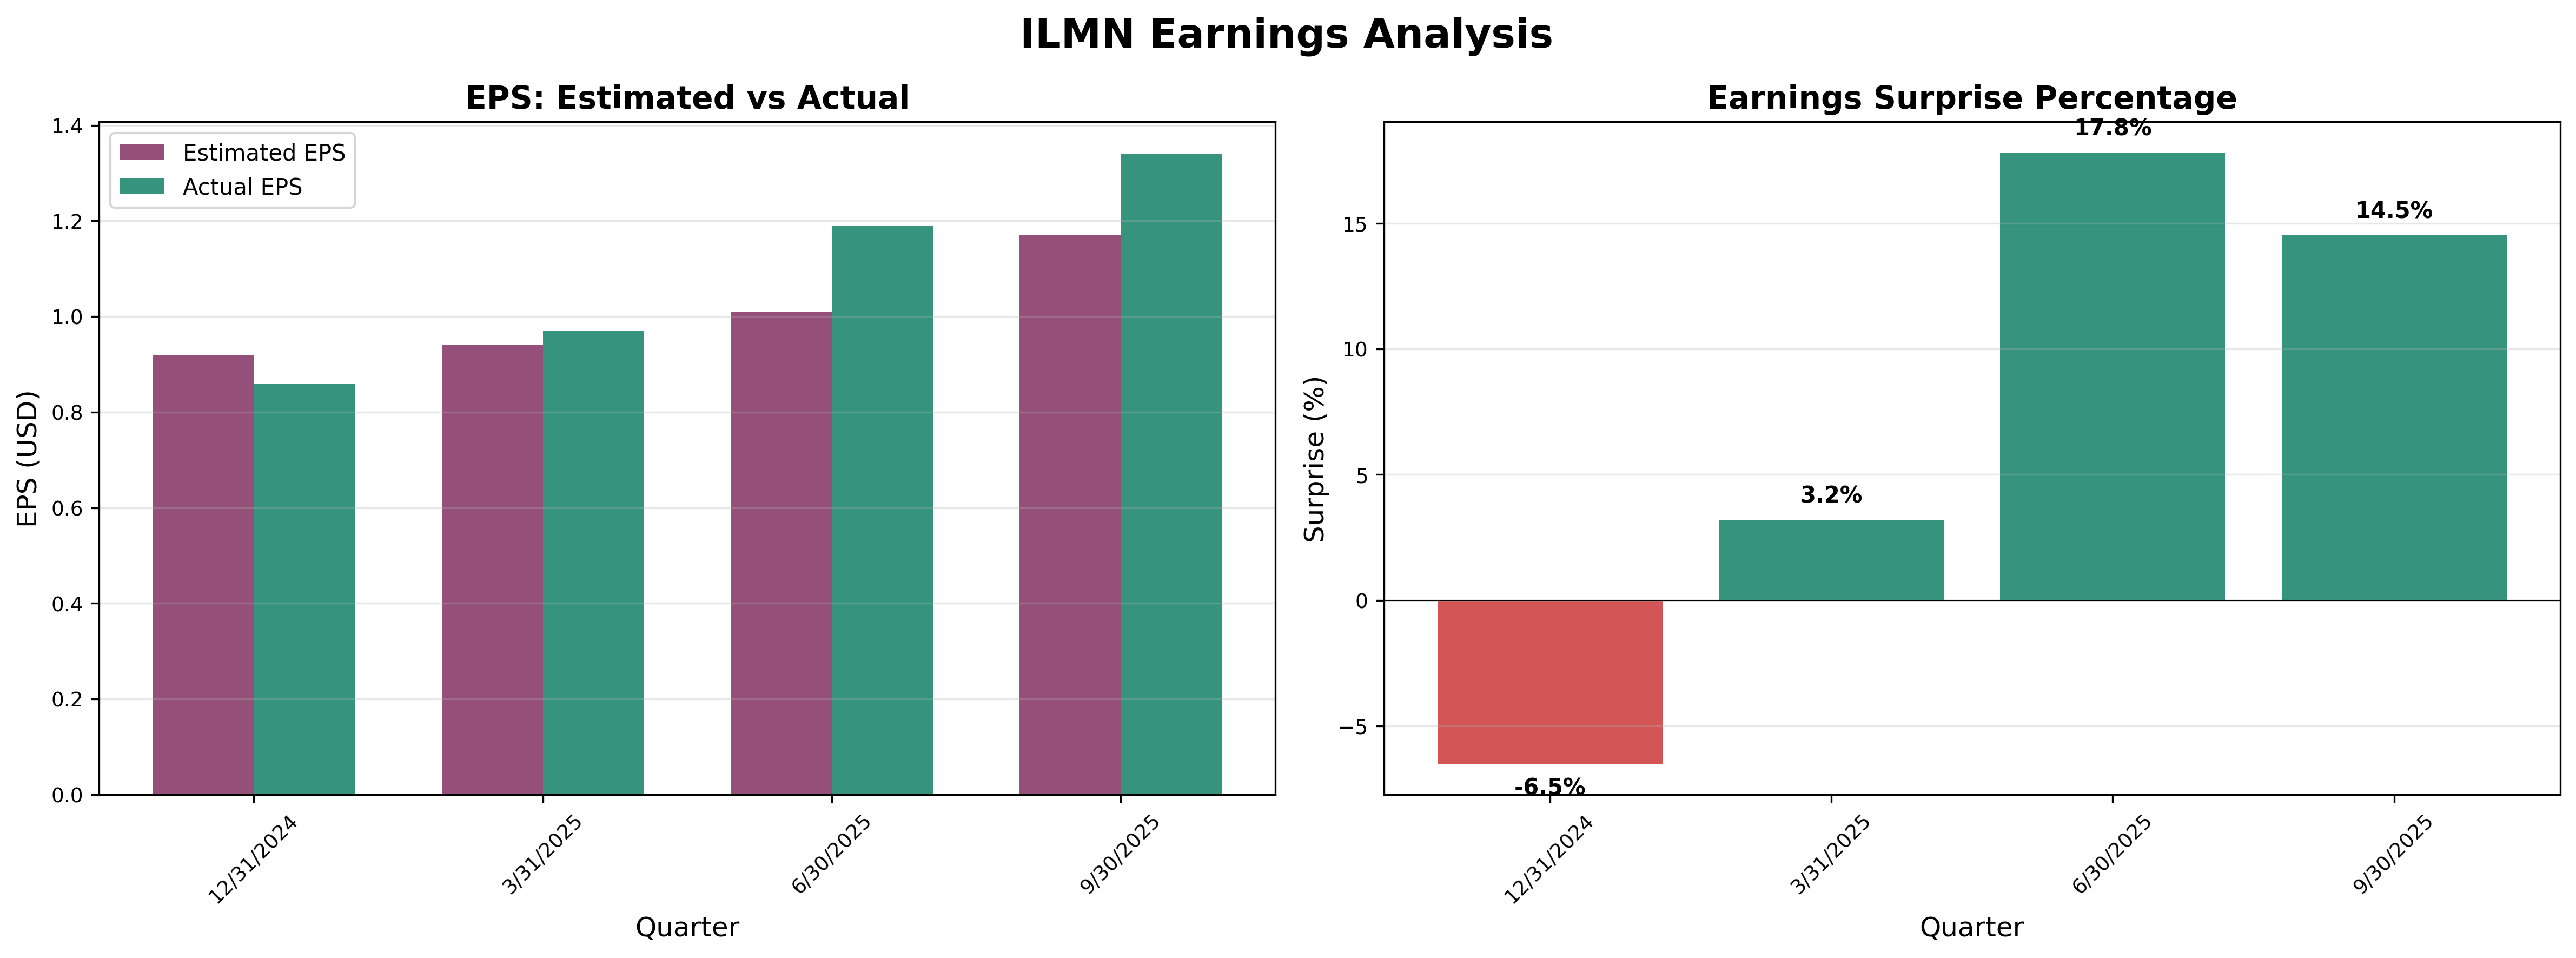
Quarterly Earnings Trajectory (2024-2025):
Q4 2024: $0.86/share (missed -6.5%)
Q1 2025: $0.97/share (beat +3.2%)
Q2 2025: $1.18/share (beat +17.8%)
Q3 2025: $1.35/share (beat +14.5%)
Annual Net Income:
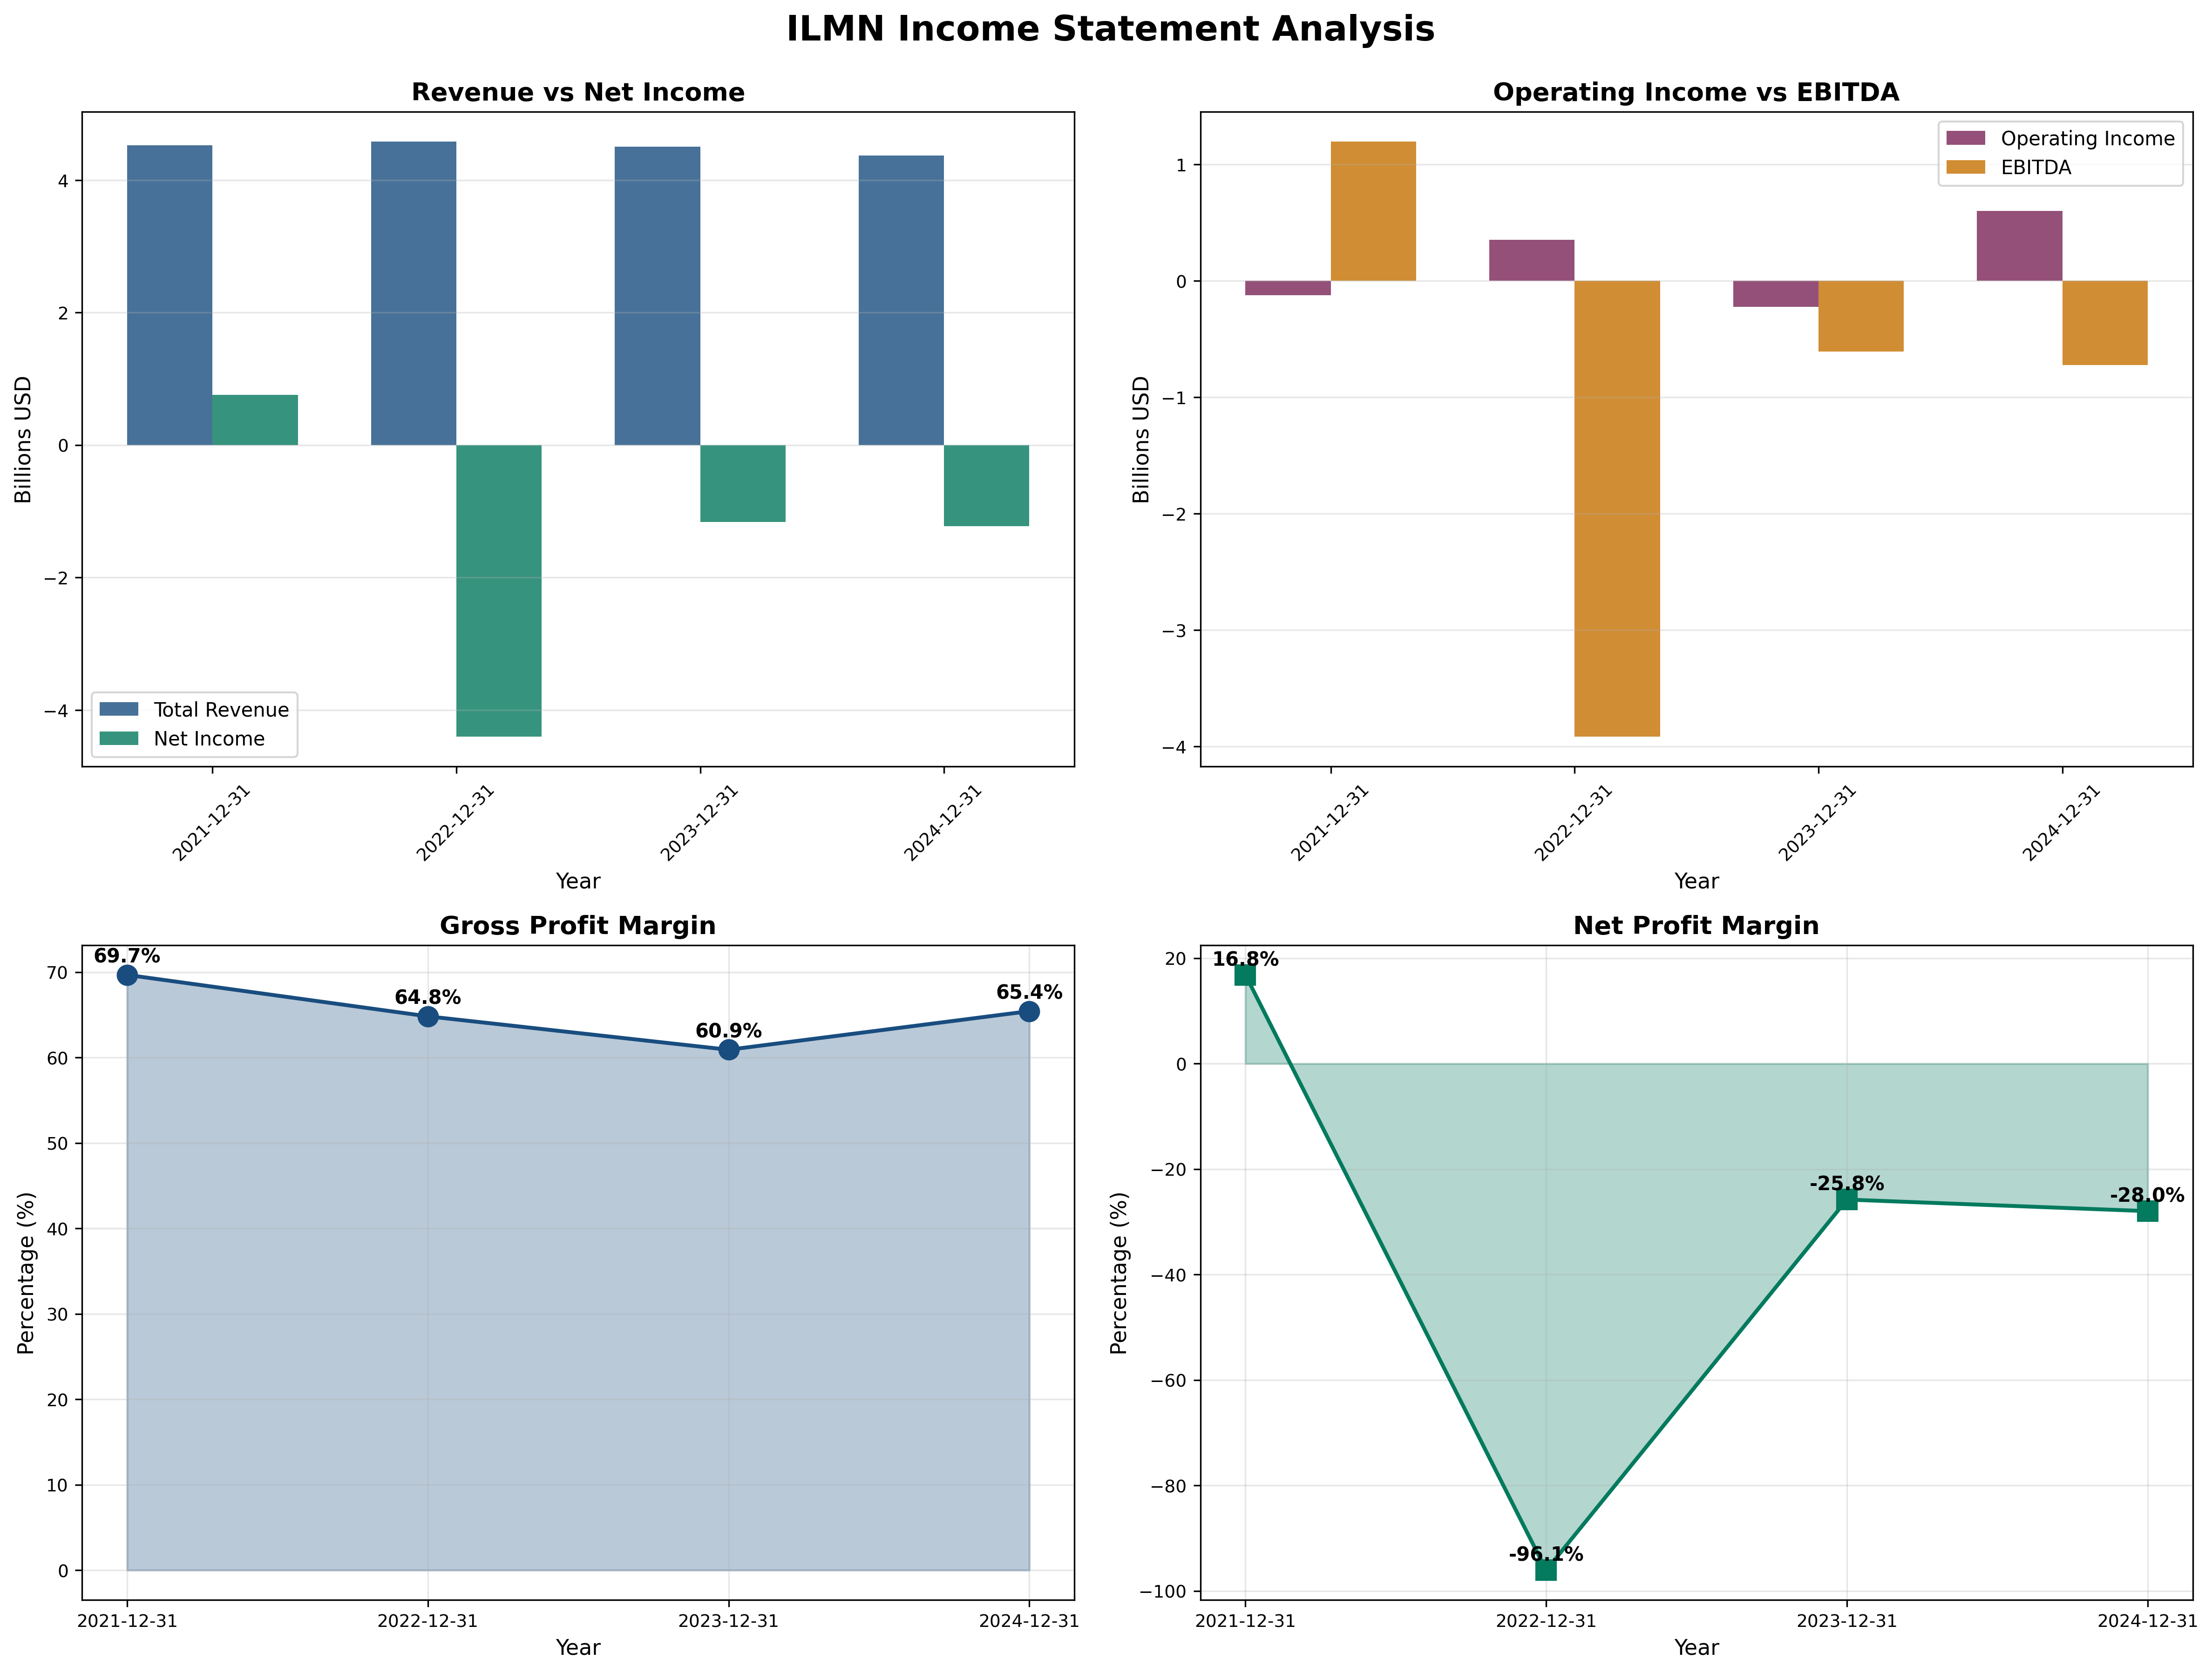
2021: +$0.7B (last profitable year)
2022: -$4.2B (GRAIL impairment)
2023: -$1.1B (restructuring)
2024: -$1.2B (continued losses)
Quality Assessment: Earnings quality is poor—three years of losses destroy trust. However, the quarterly trajectory Q4'24 through Q3'25 shows sequential improvement and consistent beats, suggesting operational stabilization. The losses primarily stem from GRAIL disaster, not core sequencing business deterioration. Core NGS business likely generates $300-500M operating income, masked by GRAIL losses and restructuring charges. Quarterly EPS trending toward $1.35/quarter × 4 = $5.40 annual runrate suggests profitability inflection imminent. Trust but verify.
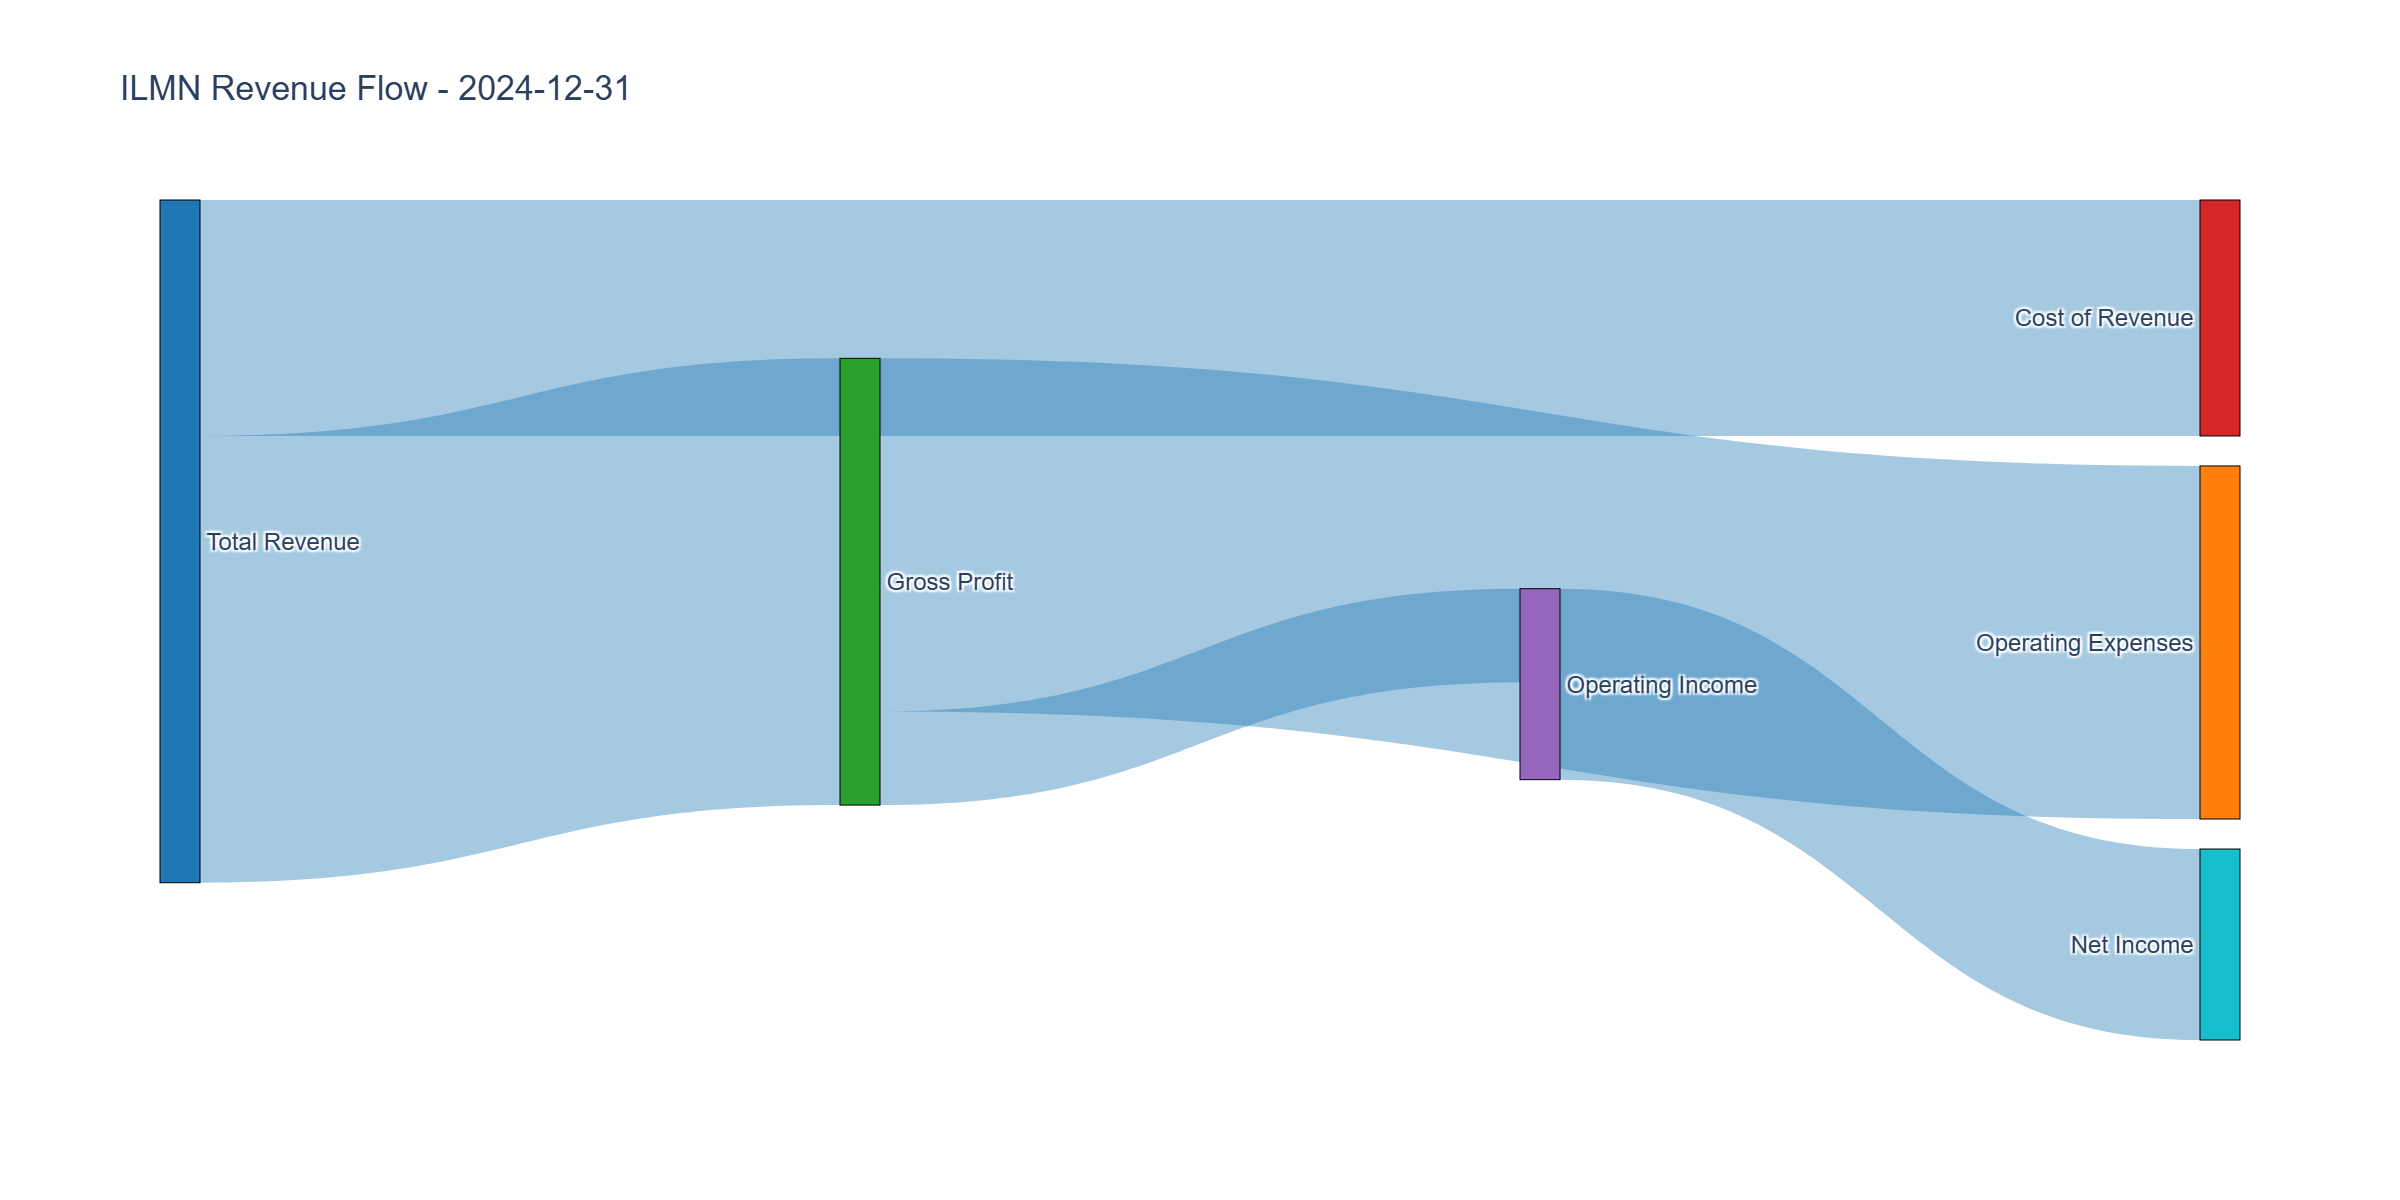
Income Statement Analysis
Key Metrics:
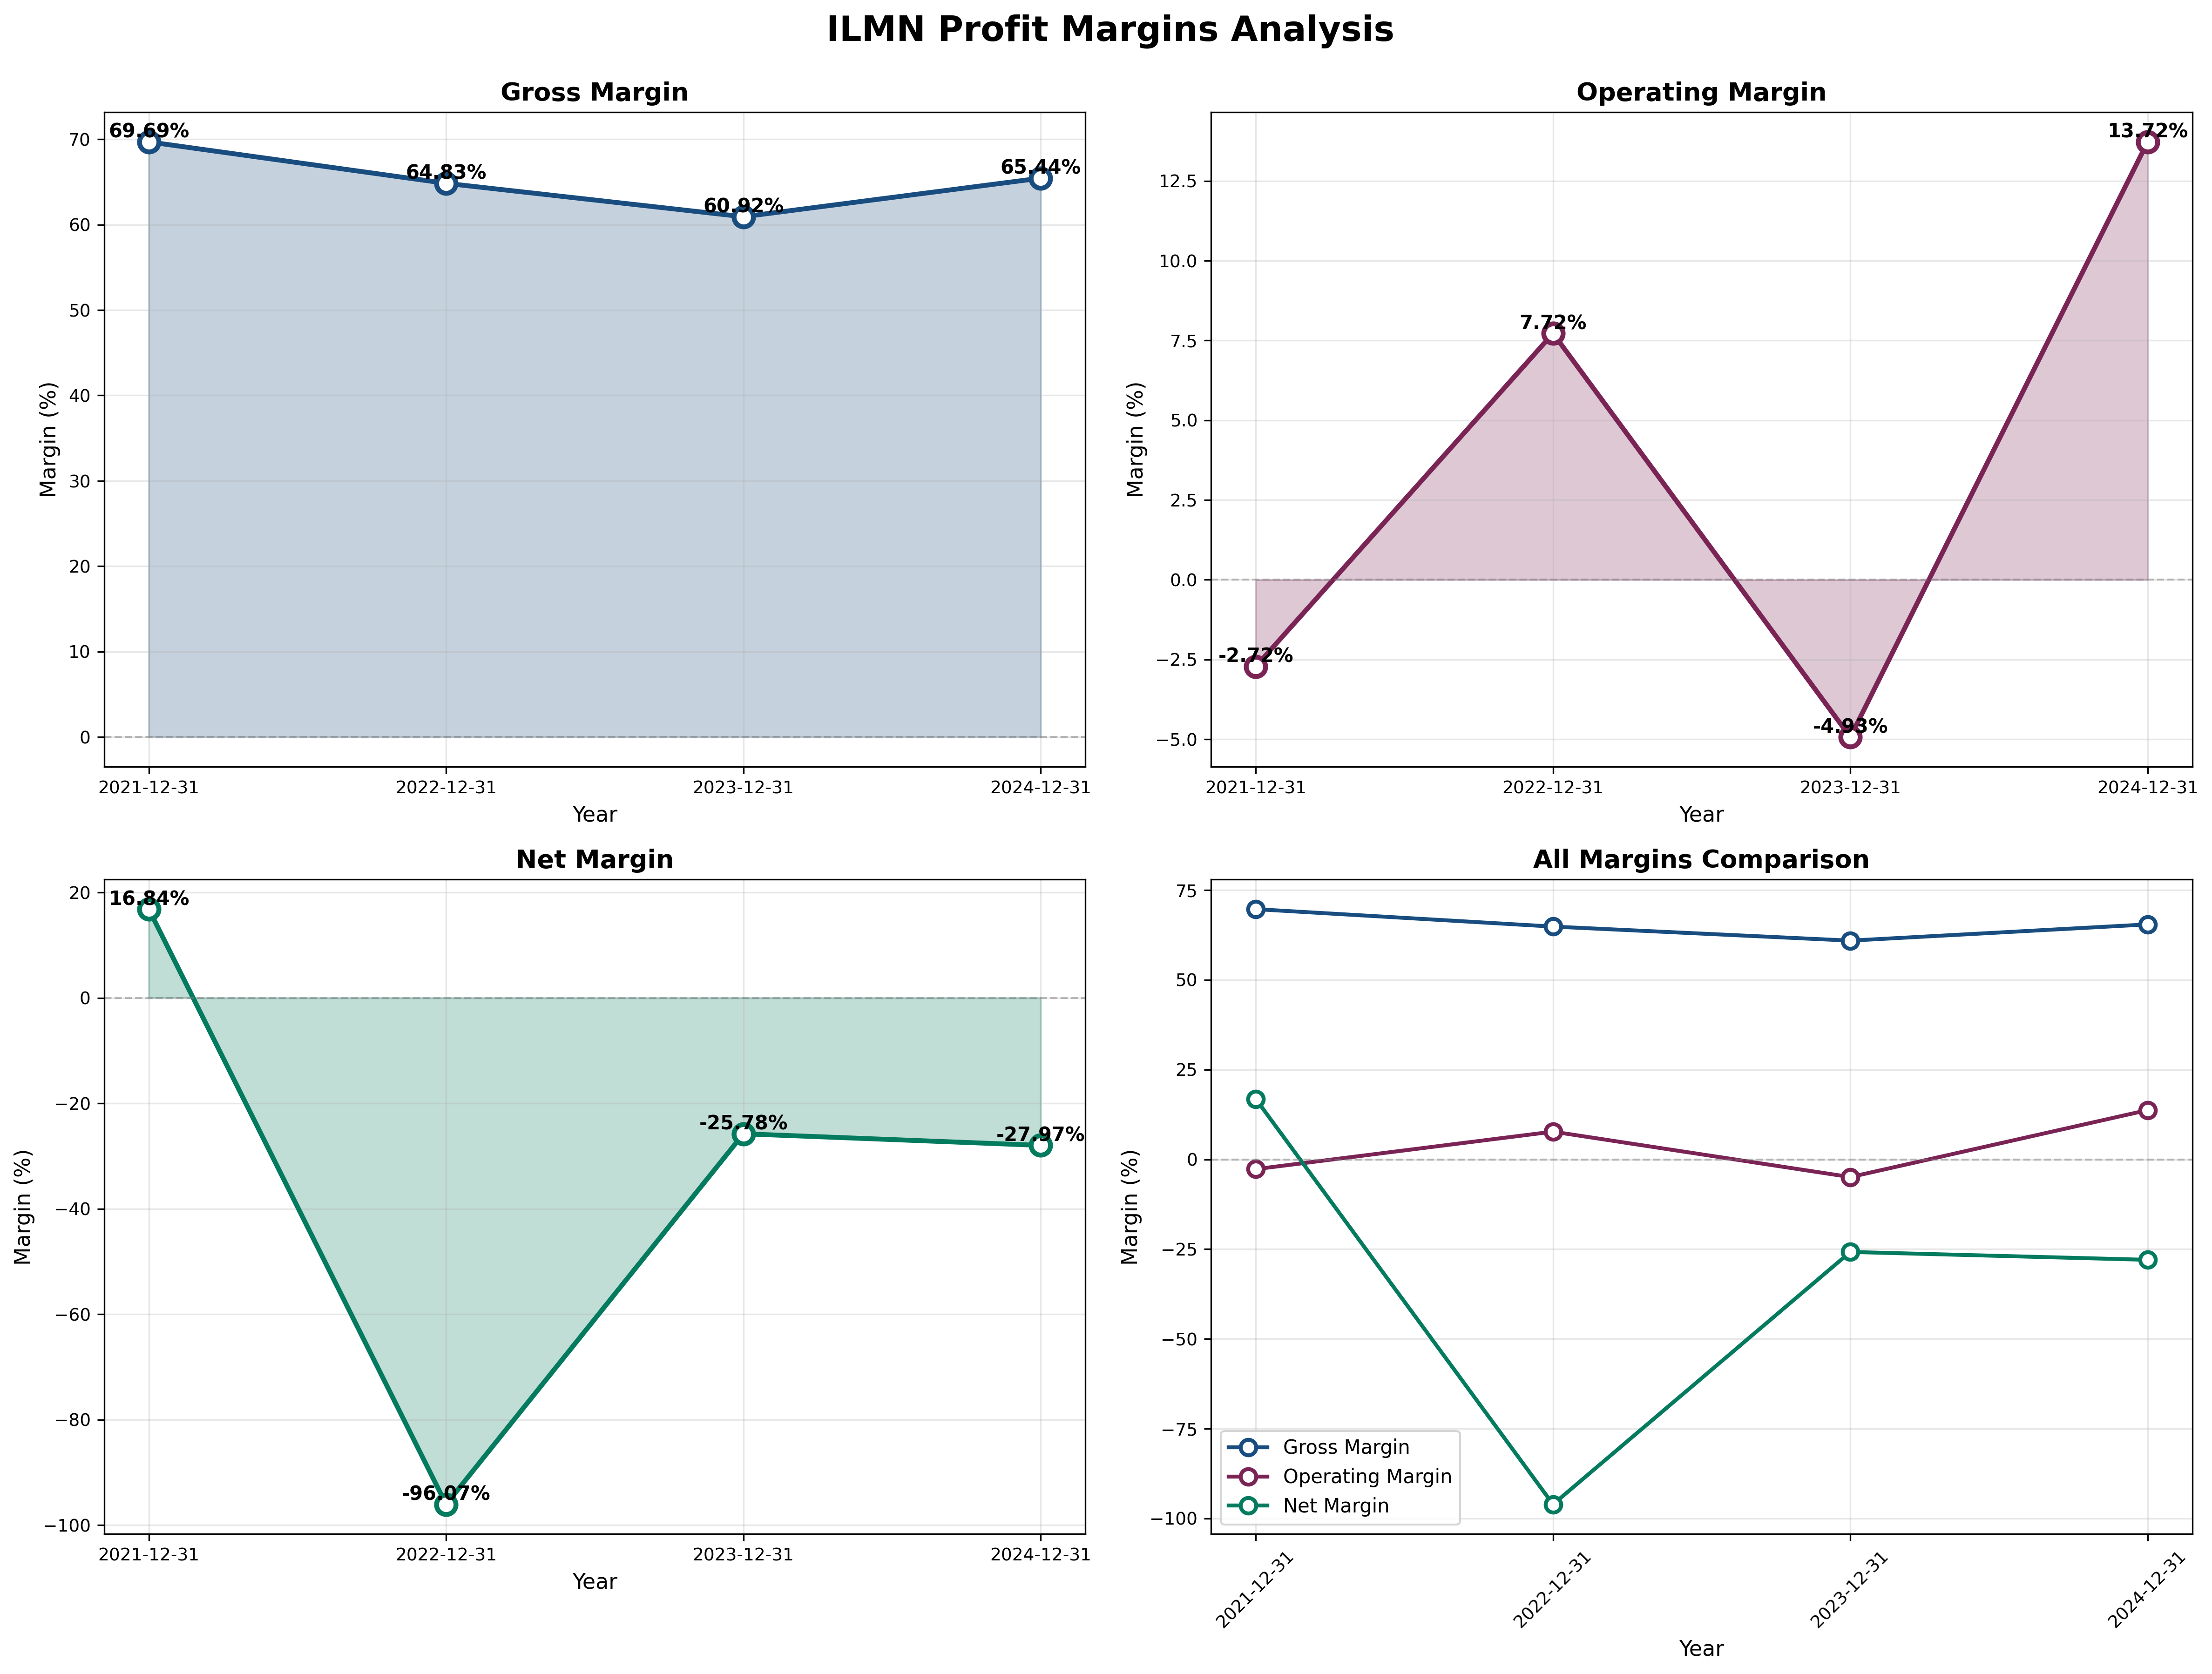
- Revenue: $4.3B (2024), flat vs $4.5B (2021) Stagnant
- Gross Margin: 65.4% (2024), stable 60-70% band Excellent
- Operating Margin: 13.4% (2024), recovering from -96% (2022) Improving
- Net Margin: -28% (2024), recovering from -96% (2022) Still terrible but improving
Assessment: The income statement tells a tale of disaster and potential recovery. Revenue has stagnated at $4.3B for four years—market share loss to competitors and pricing pressure evident. However, gross margins remain elite at 65%, proving the underlying sequencing economics are healthy. Operating margins recovered from -96% (2022 bottom) to +13% (2024)—massive improvement suggesting cost cuts are working. The -28% net margin reflects lingering GRAIL costs and restructuring charges. If management can stabilize revenue and eliminate GRAIL drag, 15-20% operating margins (historical norm) seem achievable, implying $600-850M operating income potential.
Cash Flow Generation
Key Metrics:
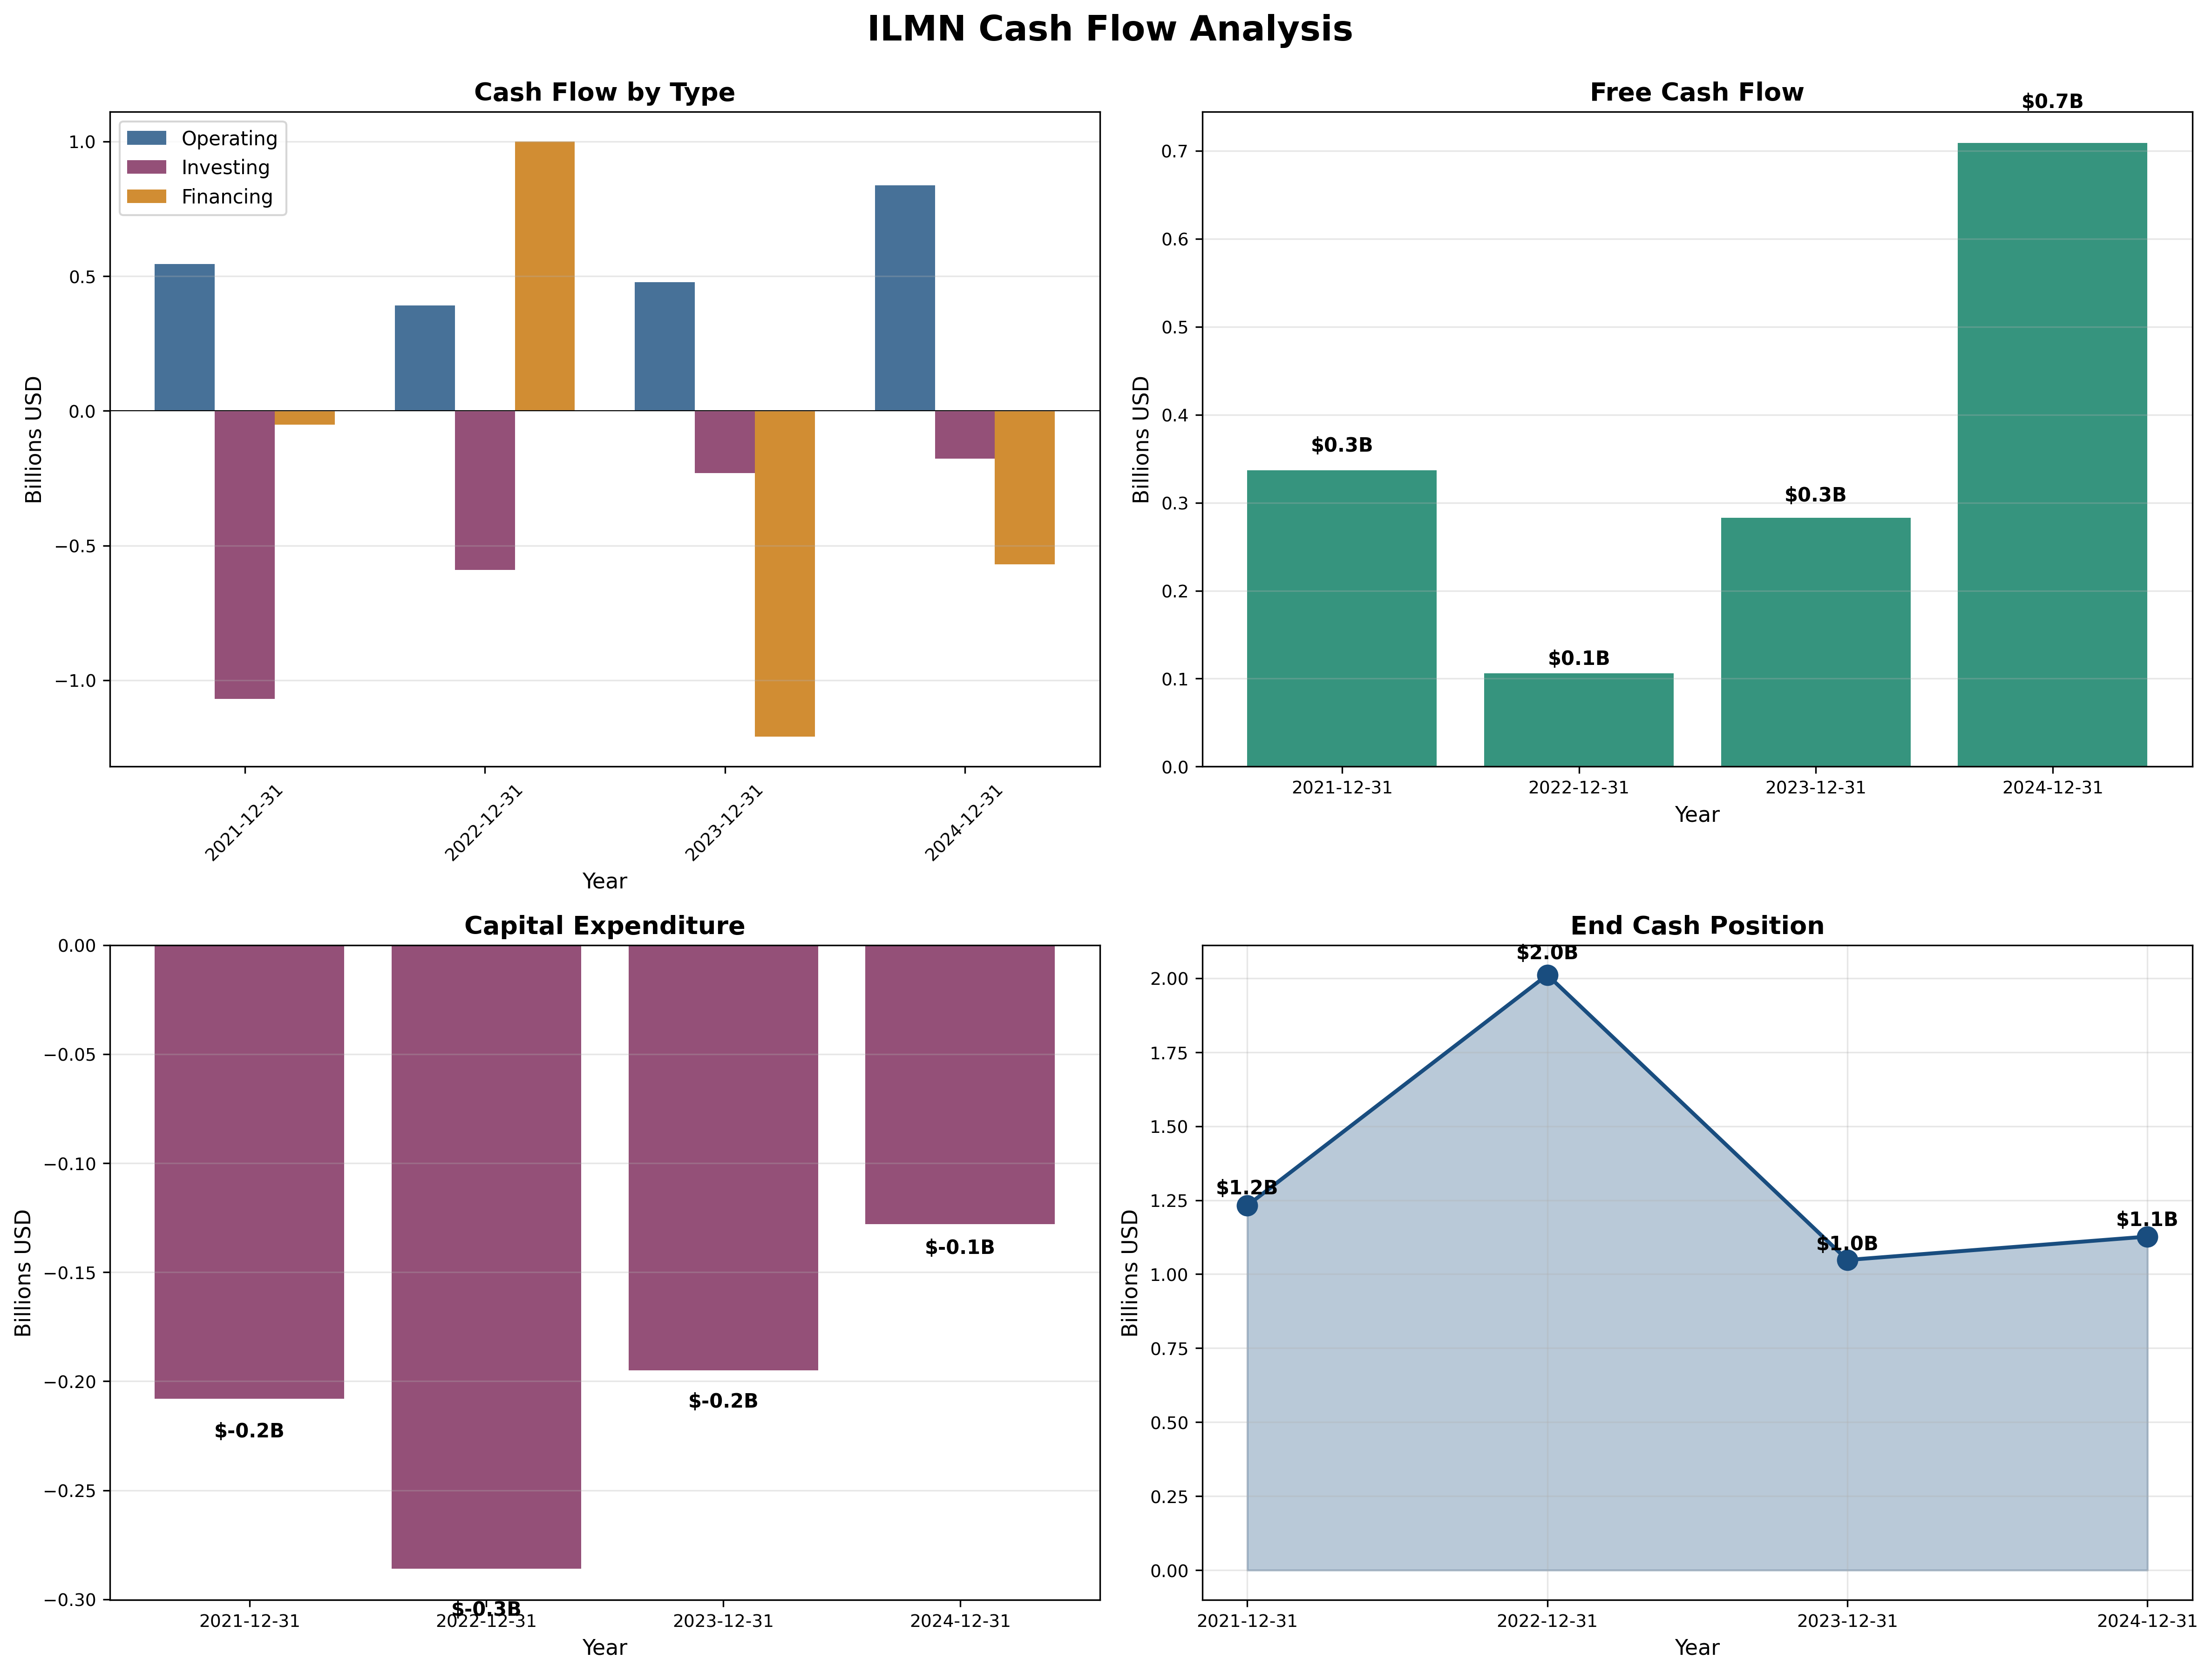
- Operating Cash Flow: $0.8B (2024), down from $1.2B (2021-2022)
- Capex: $0.1B (extremely low, concerning)
- Free Cash Flow: $0.7B (2024), recovering from $0.1B (2022-2023)
- FCF Margin: 16% Decent
Assessment: Cash flow is the silver lining. Despite losses, ILMN generated $700M FCF in 2024—proof that core business remains cash-generative. The disconnect between negative net income and positive FCF reflects non-cash charges (impairments, restructuring). Capex of only $0.1B is concerning—insufficient reinvestment suggests management prioritizing survival over growth, or worse, delaying necessary R&D. Historically, ILMN spent $200-300M annually on capex; current $100M suggests underinvestment that will hurt long-term competitiveness. Cash balance declining from $2.0B to $1.1B indicates burn continues but at manageable $150-200M/year rate.
Profitability Metrics
Current Ratios (2024, estimated from quarterly data):
- ROE: -42% (negative due to losses)
- ROIC: ~5-8% (core business, estimated)
- ROA: -10% (negative due to losses)
Historical Comparison (2021, last profitable year):
- ROE: +6.5%
- ROIC: ~12%
- ROA: +4.6%
Assessment: Returns are catastrophic due to losses but improving. The dramatic equity shrinkage (from $10.8B to $2.4B) means even small improvements in earnings will dramatically boost ROE. If ILMN achieves $500M net income (conservative), ROE jumps to 21%. The leverage works both ways—small misses could maintain negative returns. Core business ROIC likely remains 10-12% (acceptable) but masked by corporate overhead and GRAIL albatross. This is a “prove it” situation: returns will be excellent IF turnaround succeeds, terrible if it fails.
Capital Allocation Assessment
Management Quality Grade: D
Critical Assessment:
The GRAIL acquisition was one of the worst capital allocation disasters in biotech history:
- Paid $7.1B in 2021 (all-stock) at market peak
- Faced antitrust battles (FTC/EU) for 2+ years
- Forced to divest in 2023 at $0 value
- Total value destruction: $7.1B+ (including legal costs and distraction)
- Equity holders suffered 78% dilution for zero return
Insider Ownership: <1% (Management has no skin in the game after selling during highs)
Recent Actions:
- Divested GRAIL for nominal consideration (admitted mistake, cut losses)
- Restructured workforce (15% layoffs, $100M+ cost savings)
- Eliminated dividend (conserve cash)
- No buybacks despite 75% stock decline (cash preservation mode)
Scorecard:
- GRAIL Acquisition: Grade F (catastrophic value destruction)
- Post-Crisis Response: Grade C+ (appropriate cost cuts, but slow to act)
- R&D Investment: Grade C- (underinvesting at $100M capex, risking long-term position)
- Buyback Discipline: Grade Incomplete (smart to preserve cash, but missed opportunity at $95?)
Assessment: Management destroyed massive shareholder value through empire-building GRAIL acquisition. New CEO (Jacob Thaysen, started 2023) inherited the mess and has taken appropriate corrective actions: divested GRAIL, cut costs, stabilized operations. However, trust is shattered—investors rightly skeptical of any strategic moves. Management must prove operational competence before considering M&A or dividends.
Valuation & Intrinsic Value
Challenge: Valuing turnarounds requires scenario analysis, not formulaic DCF.
Scenario 1 - Turnaround Succeeds (40% probability):
Revenue stabilizes: $4.5-5.0B (5% growth resuming)
Operating Margin: 18-20% (historical norm)
Operating Income: $810M-$1,000M
Net Income: $600M-$750M
EPS: ~$4.80-$6.00/share (125M shares)
Fair P/E: 20-25x (growth company)
Target Price: $96-$150
Scenario 2 - Muddle Through (40% probability):
Revenue: $4.0-4.5B (0-3% growth, competition intensifies)
Operating Margin: 12-15%
Operating Income: $480-$675M
Net Income: $300-$450M
EPS: $2.40-$3.60/share
Fair P/E: 15-20x (mature cash cow)
Target Price: $36-$72
Scenario 3 - Value Trap (20% probability):
Revenue declines 5-10% annually (Chinese competition, disruption)
Operating Margin: 5-10%
Losses continue or minimal profitability
EPS: $0-$1/share
Fair P/E: 10-15x (distressed)
Target Price: $15-$30
Probability-Weighted Valuation:
40% × $123 = $49.20
40% × $54 = $21.60
20% × $22.50 = $4.50
Expected Value: $75.30/share
Risk-Adjusted Intrinsic Value: $75-$125/share (wide range appropriate for turnaround)
Current Price: $120.16 Assessment: Trading at upper end of fair value range. Not a screaming bargain, but reasonable if turnaround thesis correct. Downside to $36-75 (-40% to -69%), upside to $150-200 (+25% to +66%).
Risk Assessment
Key Risks (Top 3)
Turnaround Failure (40% probability, -60% impact): Management fails to reignite growth, margins remain compressed, Chinese competition intensifies. Stock reprices to $30-50 as market realizes this is terminal decline, not temporary setback. Liquidation risk low (valuable IP and installed base) but equity could approach zero.
Technology Disruption (30% probability, -50% impact): Oxford Nanopore or new technology achieves equivalent accuracy at 50% lower cost. Illumina’s installed base becomes stranded assets as labs switch platforms. Market share collapses from 80% to 50% over 5 years. Revenue and margins crater.
Debt Refinancing Crisis (20% probability, -40% impact): Continued losses exhaust cash, forcing debt refinancing at punitive rates or dilutive equity raise. $2.6B debt becomes untenable if losses persist, forcing asset sales or restructuring. Equity holders wiped out in downside scenario.
Worst Case Scenario: Technology disruption + management failure + recession reducing sequencing demand. Revenue falls 30%, losses continue, cash exhausted, forced to sell core assets to PE firm or competitors at fire-sale prices. Equity holders recover $10-20/share. Probability: 15-20%.
Contrarian Opportunity Assessment: Stock down 75% from $450 peak, trading below book value ($19/share book vs $120 price), management acknowledging mistakes and taking corrective action, quarterly results improving sequentially. This exhibits characteristics of “maximum pessimism” Templeton seeks: blood in streets, universal negativity, fundamentals stabilizing. However, “value trap” risk is equally real—not all cigar butts relight.
Investment Recommendation
Current Assessment
Valuation: P/E = N/A (losses transitioning to profit) | P/B = 6.5x | EV/Revenue = 4.8x Verdict: Fairly valued to moderately undervalued IF turnaround succeeds; overvalued if failure
Margin of Safety: Limited (10-20%) based on probability-weighted scenarios
Entry Zones
| Zone | Price | Action | Rationale |
|---|---|---|---|
| 🟢 Strong Buy | < $95 | Aggressive accumulation | Maximum pessimism, 50%+ upside if turnaround |
| 🟡 Buy | $95 - $120 | Build position | Risk/reward favorable |
| 🟠 Hold | $120 - $145 | Monitor progress | Fair value, await confirmation |
| 🔴 Sell | > $145 | Trim or exit | Turnaround not yet proven |
Current Price: $120 → Recommendation: 🟡 SPECULATIVE BUY (small position, 2-3% portfolio max)
Expected Returns (3-Year)
- Bull Case (35%): $150-200 → +25% to +66% if turnaround succeeds, market share stabilizes, oncology testing accelerates
- Base Case (40%): $90-130 → -25% to +8% if business stabilizes at lower growth but healthy margins
- Bear Case (25%): $30-70 → -75% to -42% if competitive pressures intensify, technology disruption, or management fails
Expected Annual Return: -5% to +15% (high uncertainty, wide distribution)
Final Investment Conclusion
Overall Grade: C+
Category Scores:
- Business Quality: 7/10 (Strong moat but eroding, essential technology)
- Financial Strength: 4/10 (Weak balance sheet, losses, but improving)
- Management Quality: 4/10 (Destroyed value but taking corrective action)
- Valuation: 6/10 (Fair to moderately attractive for risk-tolerant)
- Margin of Safety: 5/10 (Limited margin, high uncertainty)
Final Verdict: SPECULATIVE BUY (for aggressive value investors only, max 2-3% position)
Investment Thesis Summary
Illumina is a classic Templeton “maximum pessimism” opportunity with significant value trap risk. The business remains fundamentally strong: 80% market share, 65% gross margins, elite technology, growing market. The damage came from management hubris (GRAIL disaster), not core business deterioration. Sequential quarterly improvements (Q4'24: $0.86 → Q3'25: $1.35 EPS) suggest operational turnaround gaining traction.
However, trust is shattered after $7B value destruction. Equity collapsed 78%, three years of losses, competitive threats intensifying. Management must prove competence through consistent execution. The current $120 price reflects skepticism—not priced for perfection but not priced for disaster either.
The Math:
- Downside: $36-75 (-40% to -69%) if turnaround fails
- Upside: $150-200 (+25% to +66%) if turnaround succeeds
- Probability-adjusted: Slight positive expected value but wide confidence intervals
This is NOT a defensive investment. This is speculation on management’s ability to execute turnaround after catastrophic capital allocation failure.
The Masters Would Say:
Graham: “Fails every quantitative test. Losses, no dividend, debt exceeds working capital. Unquestionably speculative. Only for aggressive investors who can afford total loss.”
Buffett: “Wonderful business at one time, but management destroyed value. Do I trust this team? No. Can I assess the technology risk (nanopore disruption)? Outside my circle of competence. Pass.”
Lynch: “Turnaround stories require perfect timing. Too early and you catch falling knife. Too late and missed the move. This is middle innings—improving but not proven. Small position (2-3%) acceptable if you love the story.”
Templeton: “This exhibits maximum pessimism characteristics: stock down 75%, universal negativity, fundamentals stabilizing. But—is this the railroad industry in 1960 (permanent decline) or GM in 1981 (temporary crisis before recovery)? I’d buy a small position at $95-100, not $120.”
Munger: “What could go catastrophically wrong? (1) Technology leapfrog, (2) Chinese competition, (3) cash burn continues, (4) debt crisis. Am I compensated for these risks at $120? Barely. At $80? Yes.”
Framework Checklist
- ❌ Quantitative: Fails all 9 Graham criteria—this is speculation, not investment
- ⚠️ Moat: Still strong but narrowing—80% market share vs 90% five years ago
- ❌ Management: Destroyed $7B through GRAIL; new CEO taking appropriate actions but trust shattered
- ✅ Contrarian: Clear maximum pessimism signals—75% decline, sequential improvement ignored
- ⚠️ Simplicity: Can explain business model, but technology disruption risk is complex
Would I hold this for 10+ years if the market closed tomorrow?
NO. This requires active monitoring. If turnaround succeeds (revenue growth resumes, margins expand to 18%+, market share stabilizes), this could be 10-year hold. But current situation demands quarterly evaluation. One missed quarter, one bad product cycle, one technology setback—and thesis breaks. This is a trade on operational improvement, not a forever compounder.
At $95-105, I’d buy 2-3% position. At $120, I’d only buy 1-2% position. At $80, I’d buy 5% position. This is NOT a core holding—it’s a calculated speculation on recovery.
Recommendation Summary:
- If you’re aggressive value investor: Buy 2-3% position at $95-120, add on weakness to $80-95
- If you’re conservative: Avoid until profitability proven for 4+ consecutive profitable quarters
- Position sizing: Maximum 2-3% even for aggressive investors (this can go to zero)
- Stop loss: Exit if quarterly EPS deteriorates or revenue declines >5% YoY
Monitor these catalysts:
- Q4 2025 earnings (need to see $1.40-1.50+ EPS to confirm trajectory)
- Annual revenue growth returning (need +3% minimum)
- Market share data (need to stabilize at 75-80%)
- Cash balance (need to stabilize above $900M)
Analysis completed November 3, 2025. Reassess after each quarterly earnings report—this is NOT a set-and-forget position.