Executive Summary
Investment Thesis (Critical Assessment): Iridium has executed an impressive operational turnaround—achieving 13.6% net margins and $310M annual FCF—but destroyed shareholder value through catastrophic balance sheet mismanagement. The 3.11× debt-to-equity ratio, 54% equity erosion, and existential Starlink threat create unacceptable risk despite attractive cash flow metrics.
Business Classification: Cyclical (capital-intensive infrastructure with technological disruption risk)
Current Valuation Assessment:
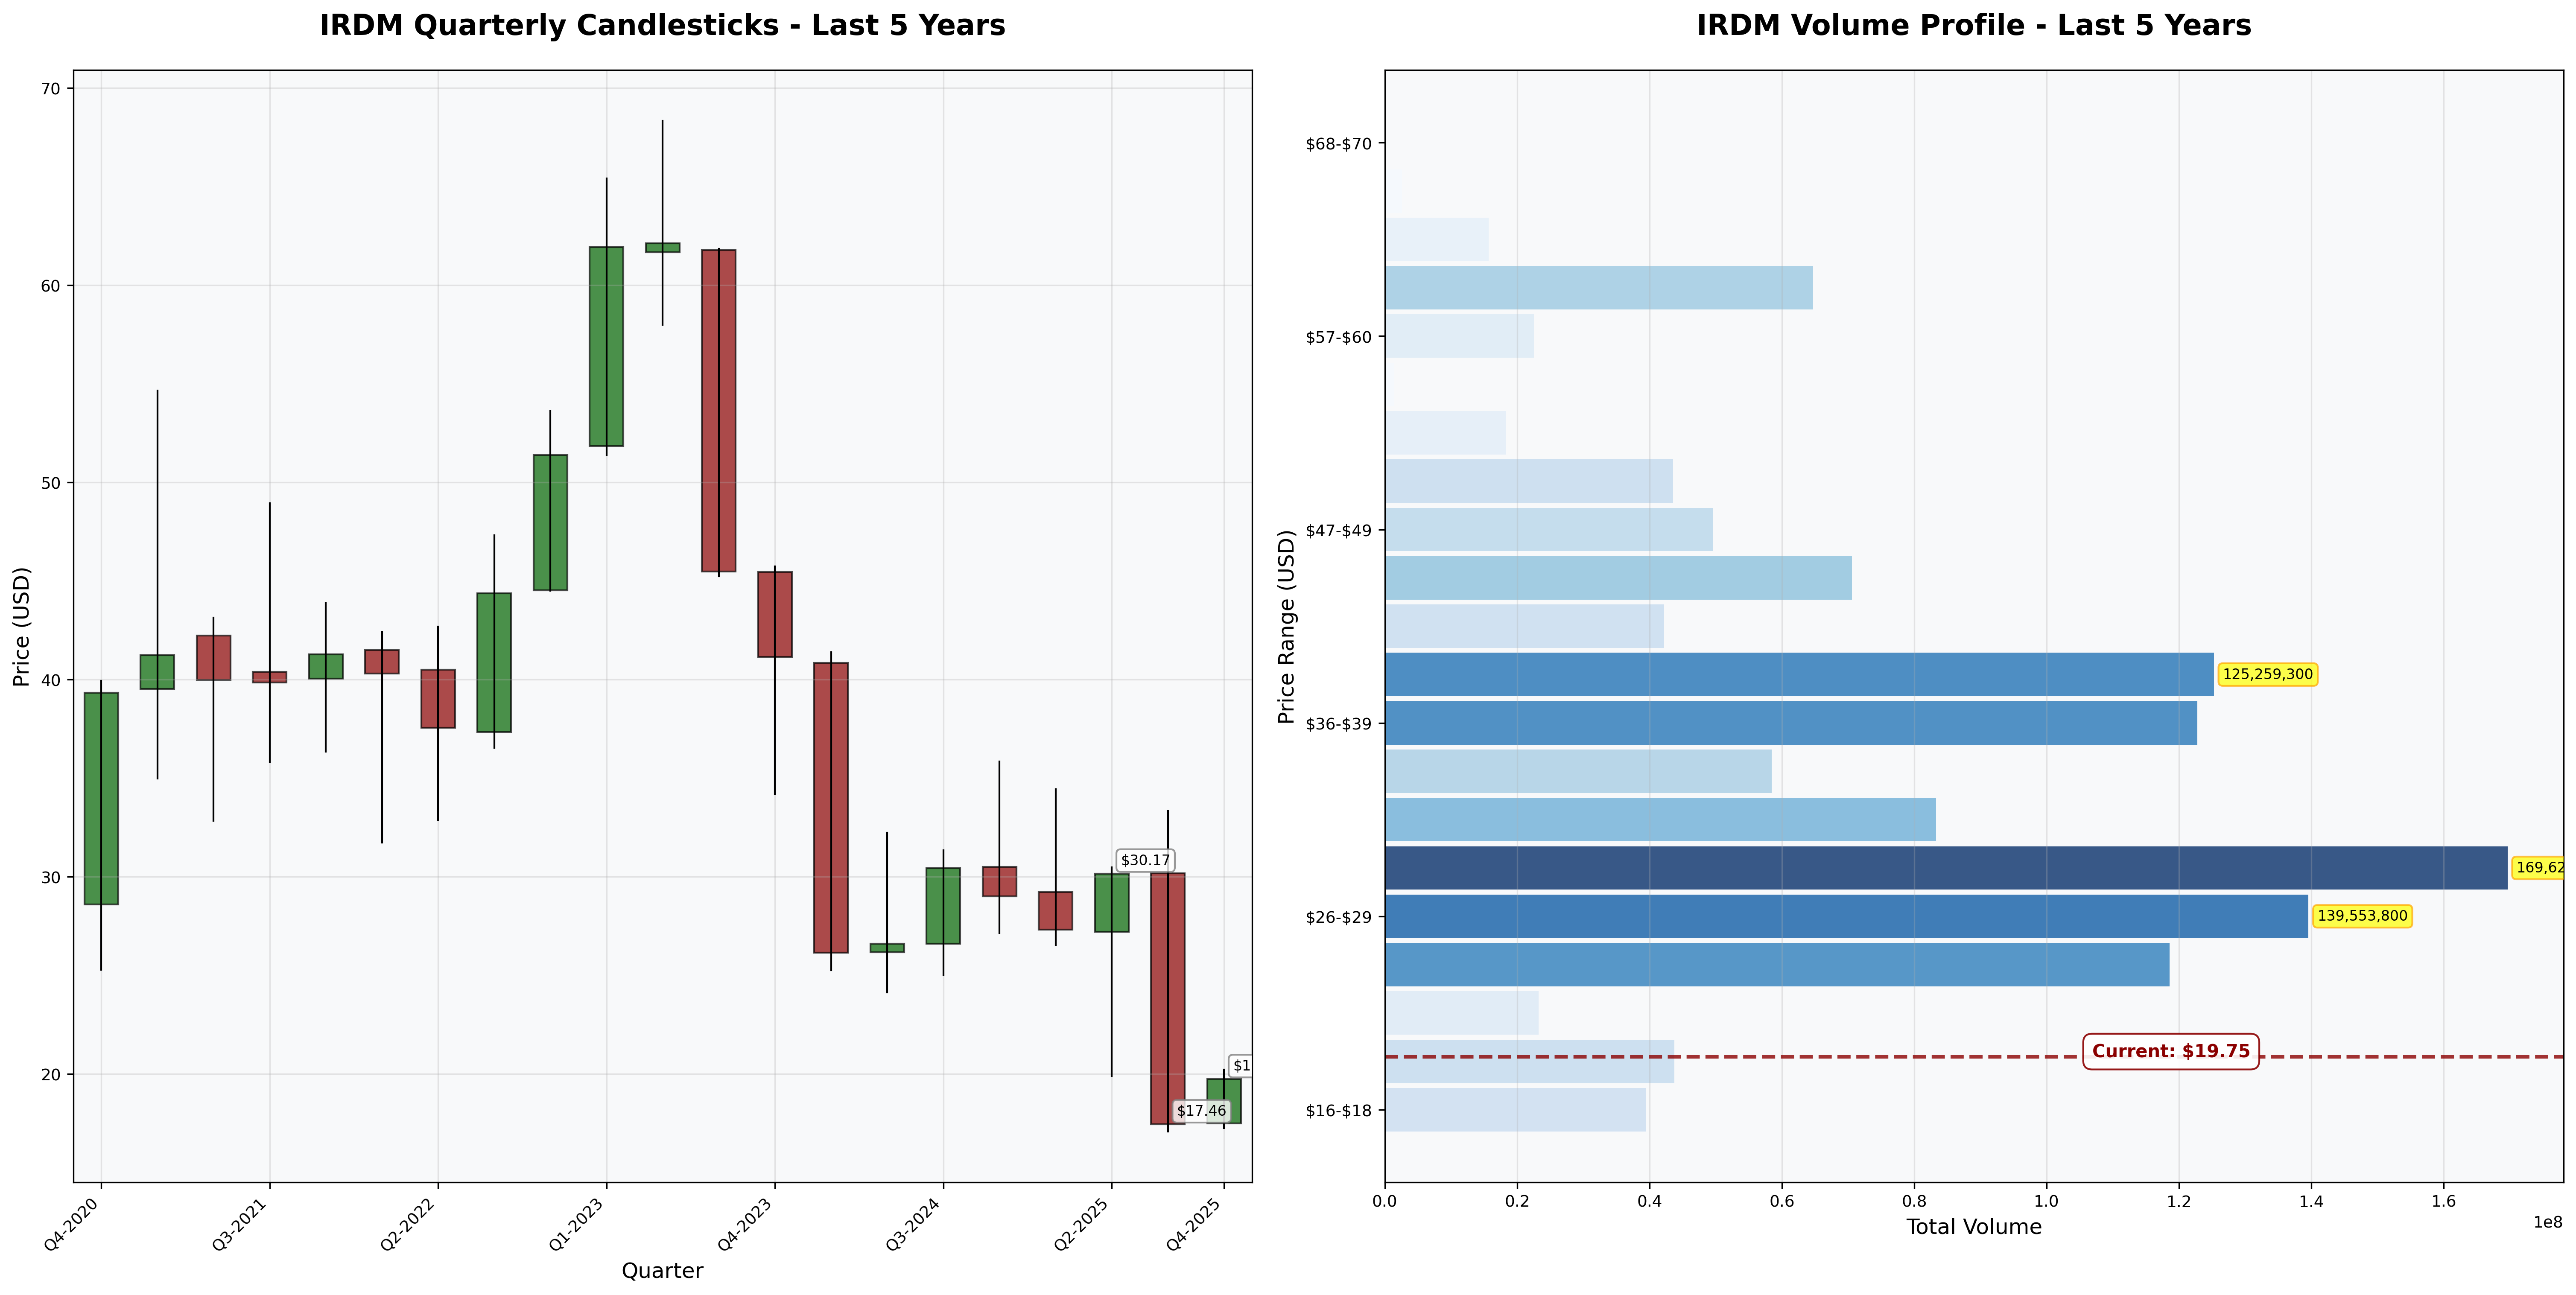
- Current Price: $19.75
- Estimated Intrinsic Value: $12-16
- Margin of Safety: -23% to -62% (OVERVALUED)
- Recommendation: AVOID (Wait for $10 or below)
Recommended Entry Zones:
- Aggressive Entry: < $10 (40%+ margin of safety)
- Standard Entry: $8-10 (50%+ margin)
- Current Price: DO NOT BUY (trading above fair value)
Business Overview
What They Do (2-Minute Test)
Iridium operates the world’s only truly global satellite communication network—66 low Earth orbit satellites providing voice/data services anywhere on the planet. Think of it as the ultimate backup phone system: when you’re in the middle of the ocean, Antarctic research station, or Sahara Desert, Iridium works. Customers pay subscription fees for this global coverage (maritime shipping, militaries, IoT sensors, emergency beacons).
Competitive Position & Moat Analysis
Primary Moat Type: Intangible Assets (spectrum licenses) + Switching Costs (mission-critical customers)
Moat Strength: ⭐⭐⭐ (out of 5) - WEAKENING
Key Moat Factors:
- Proprietary L-band spectrum licenses: Regulatory asset requiring decades to obtain—creates legal barrier to entry
- $3B+ infrastructure barrier: Competitors need massive capital to replicate 66-satellite constellation
- Pole-to-pole coverage: Only provider with true global coverage including oceans/poles
- High switching costs for military/maritime: Mission-critical customers face operational disruption changing providers
Moat Durability:
- Status: Narrowing - Starlink’s direct-to-cell technology threatens to obsolete specialized Iridium hardware. SpaceX’s mega-constellation will offer higher bandwidth at potentially lower costs without dedicated terminals.
- Key Threat: Technological disruption - AST SpaceMobile and Starlink direct-to-smartphone services eliminate Iridium’s hardware moat.
Industry Dynamics
50-Year Outlook: Questionable—satellite communications will exist, but L-band LEO technology may become obsolete as Ku/Ka-band mega-constellations offer superior performance.
Key Trends:
- IoT/M2M growth favorable, but terrestrial 5G capturing more market share than expected
- Starlink direct-to-cell launching 2024-2025 targeting same customers
- Defense spending supports government contracts, but commercial markets face intense competition
Quantitative Checklist
Defensive Investor Criteria:
| Criterion | Requirement | Actual | Pass/Fail |
|---|---|---|---|
| Earnings Stability | Positive 10 years | 4/10 years | ❌ |
| Dividend Record | Some payment | $0/share | ❌ |
| Earnings Growth | +33% in 10 years | +800% (4 years) | ✅ |
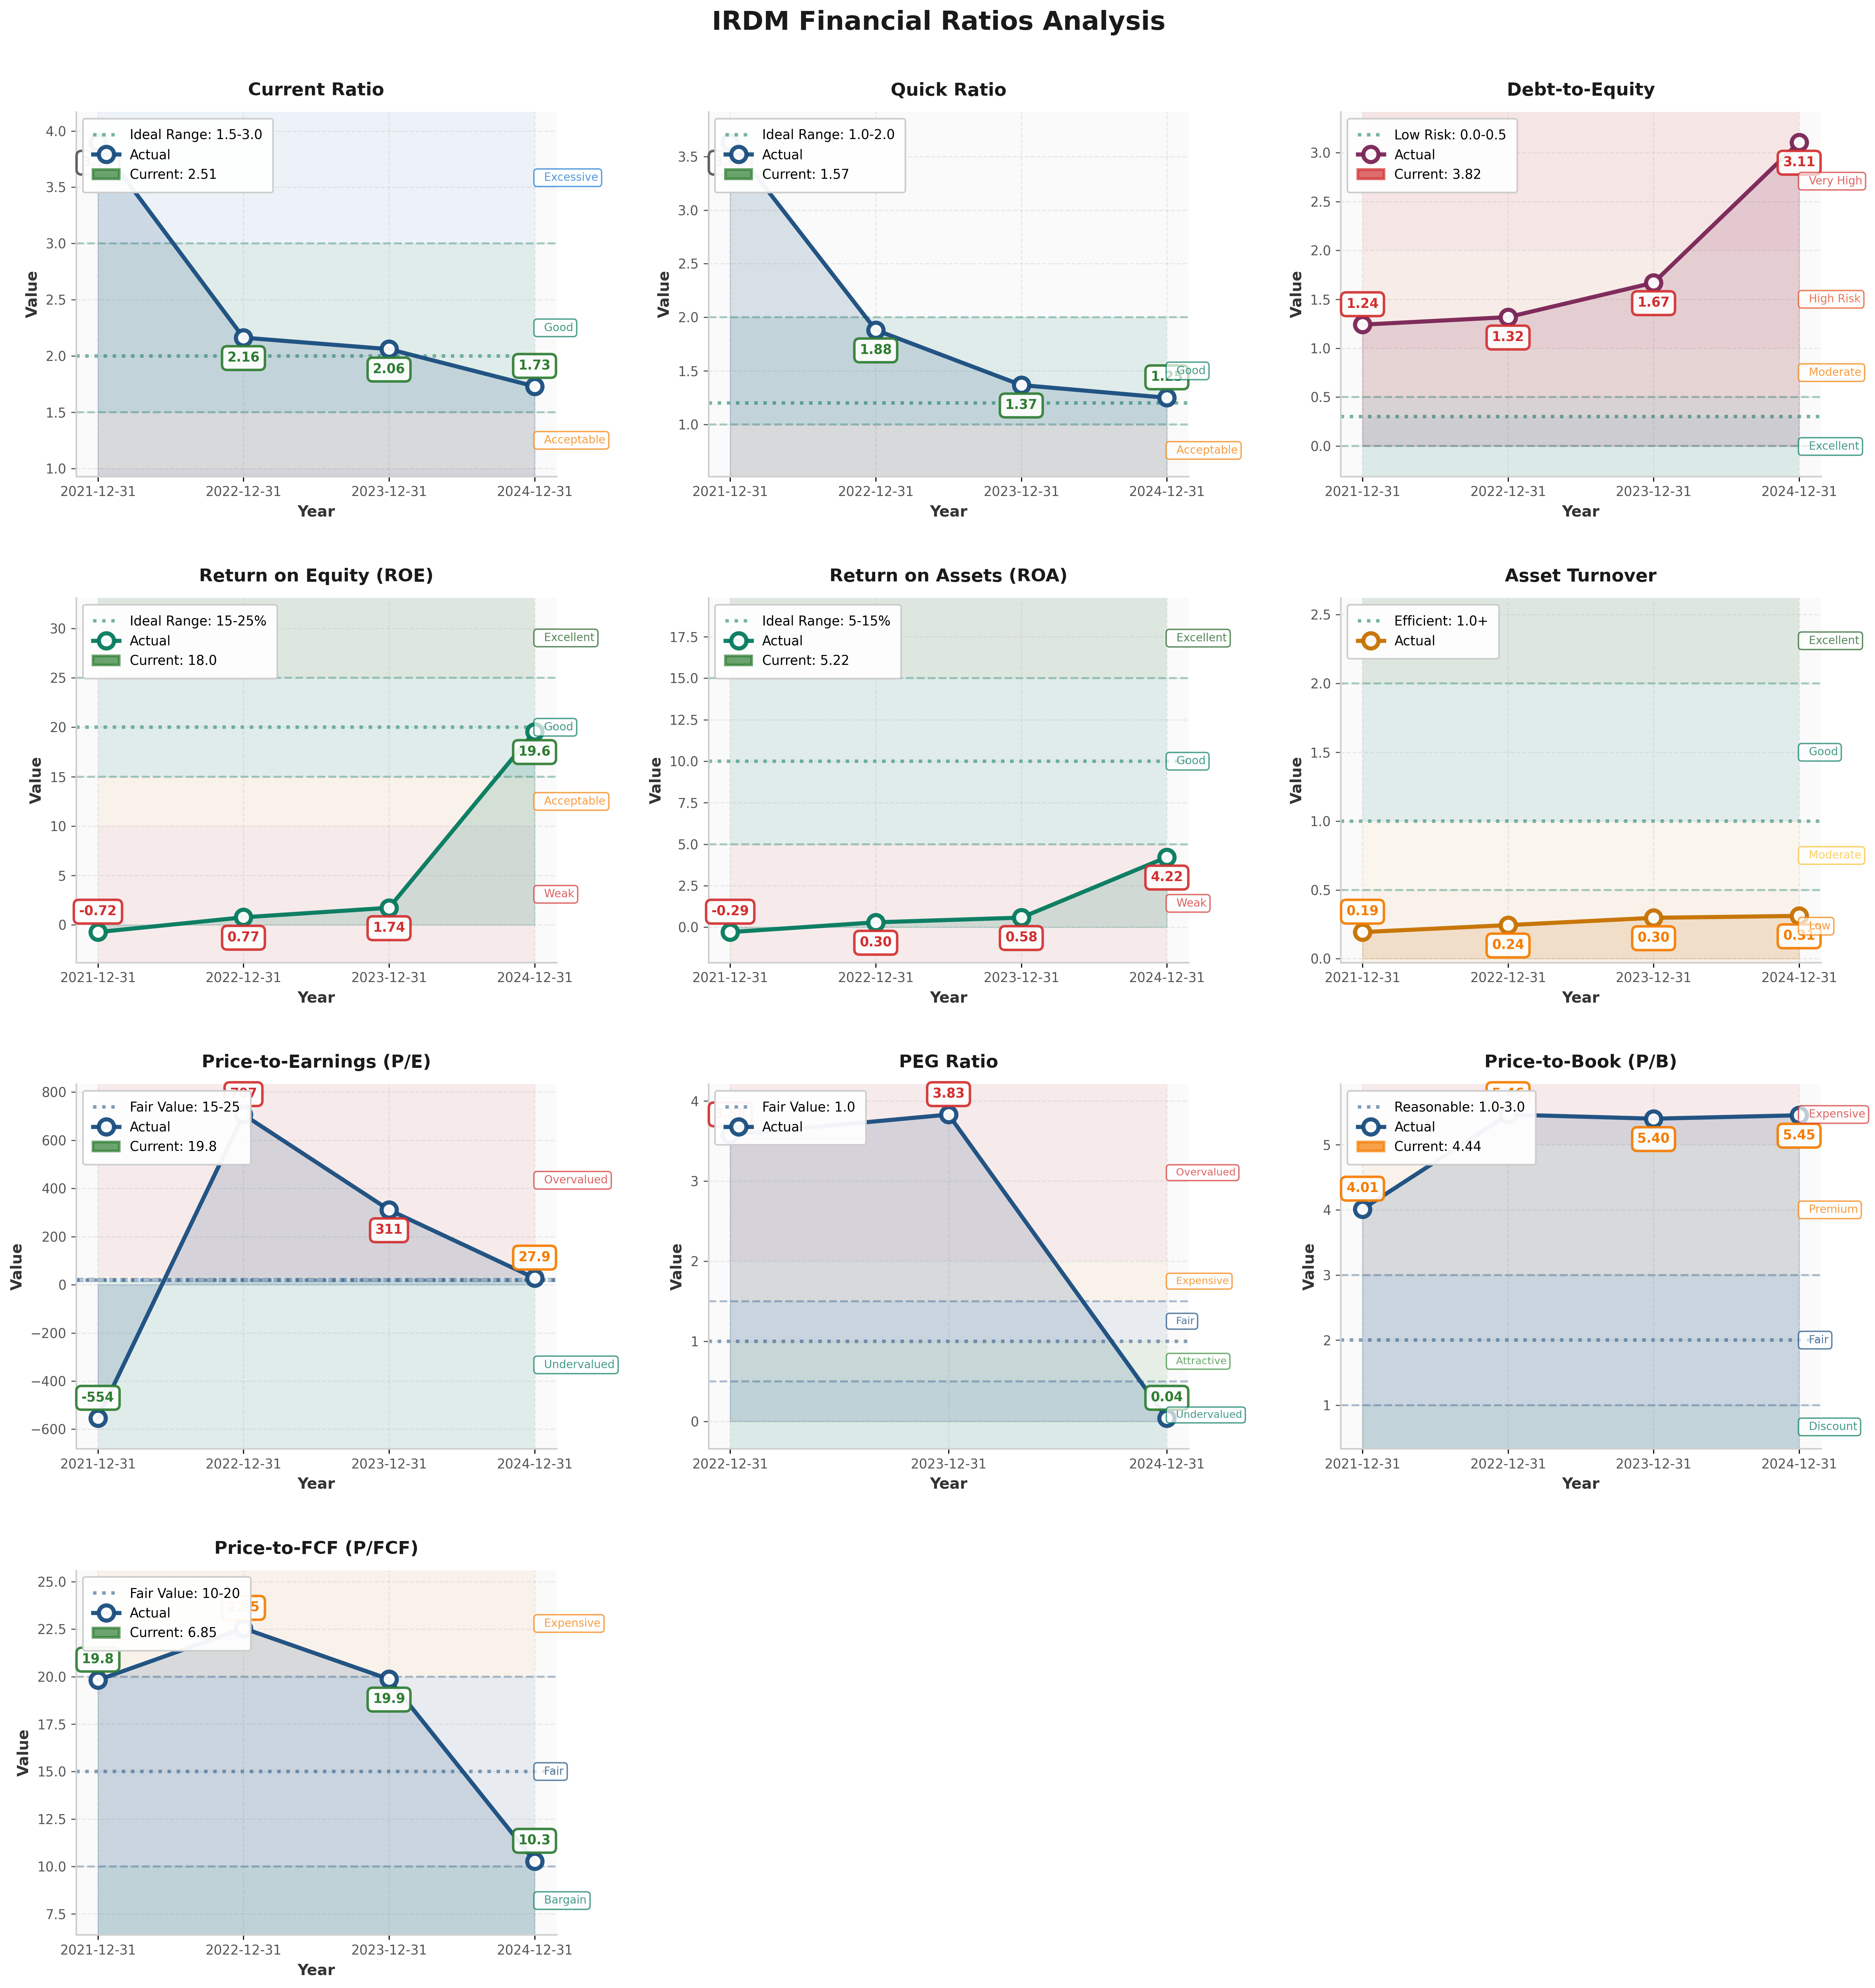
| P/E Ratio | < 15x | 21.7x | ❌ |
| P/B Ratio | < 1.5x | 4.44x | ❌ |
| P/E × P/B | < 22.5 | 96.3 | ❌ |
| Current Ratio | > 2.0 | 1.71 | ❌ |
| Debt vs NCA | Debt < NCA | $1.8B vs -$1.8B | ❌ |
Quantitative Score: 1/9 criteria met - CATASTROPHIC FAILURE
Analysis: IRDM fails nearly every Graham defensive investor test. The balance sheet structure violates conservative principles: debt exceeds net current assets by massive margin, P/B ratio is 3× Graham’s maximum, and no dividend despite positive FCF signals poor capital allocation.
Financial Analysis with Critical Assessment
Balance Sheet Strength
Key Metrics:
- Current Ratio: 1.71 (target > 2.0) - ❌
- Debt-to-Equity: 3.11 (target < 0.5) - ❌
- Interest Coverage: ~5.2x (target > 5x) - ⚠️ Marginal
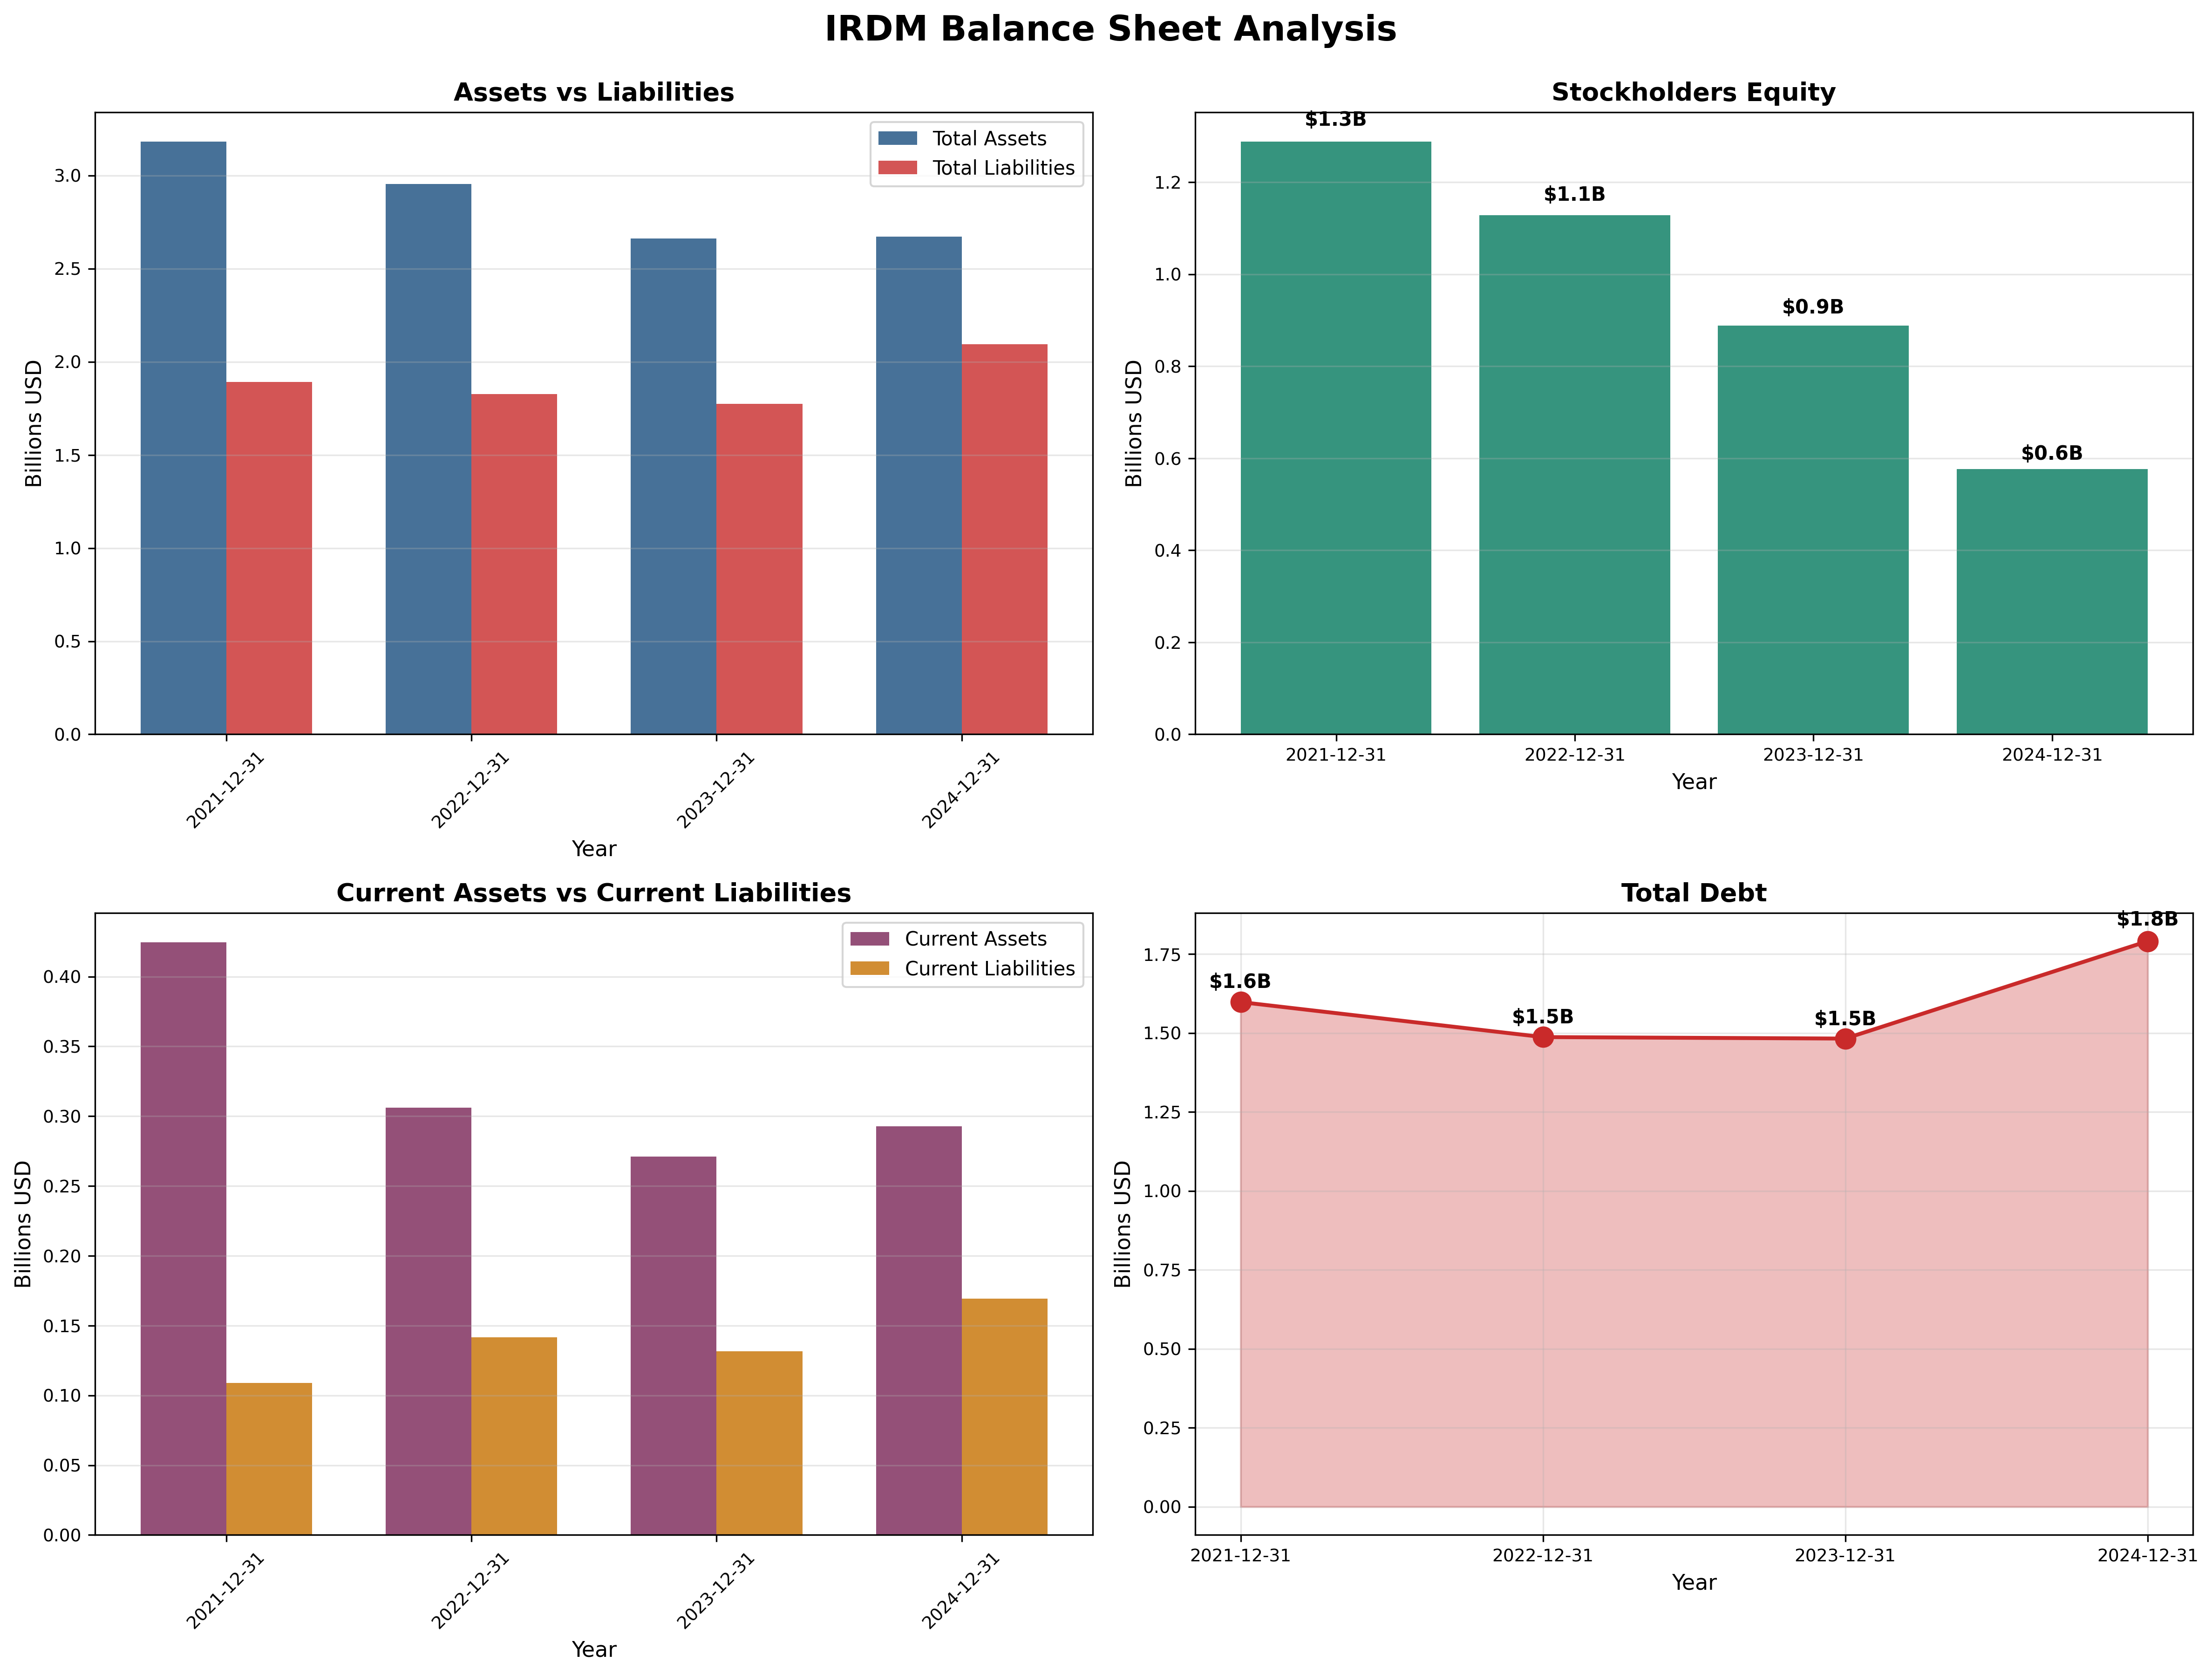
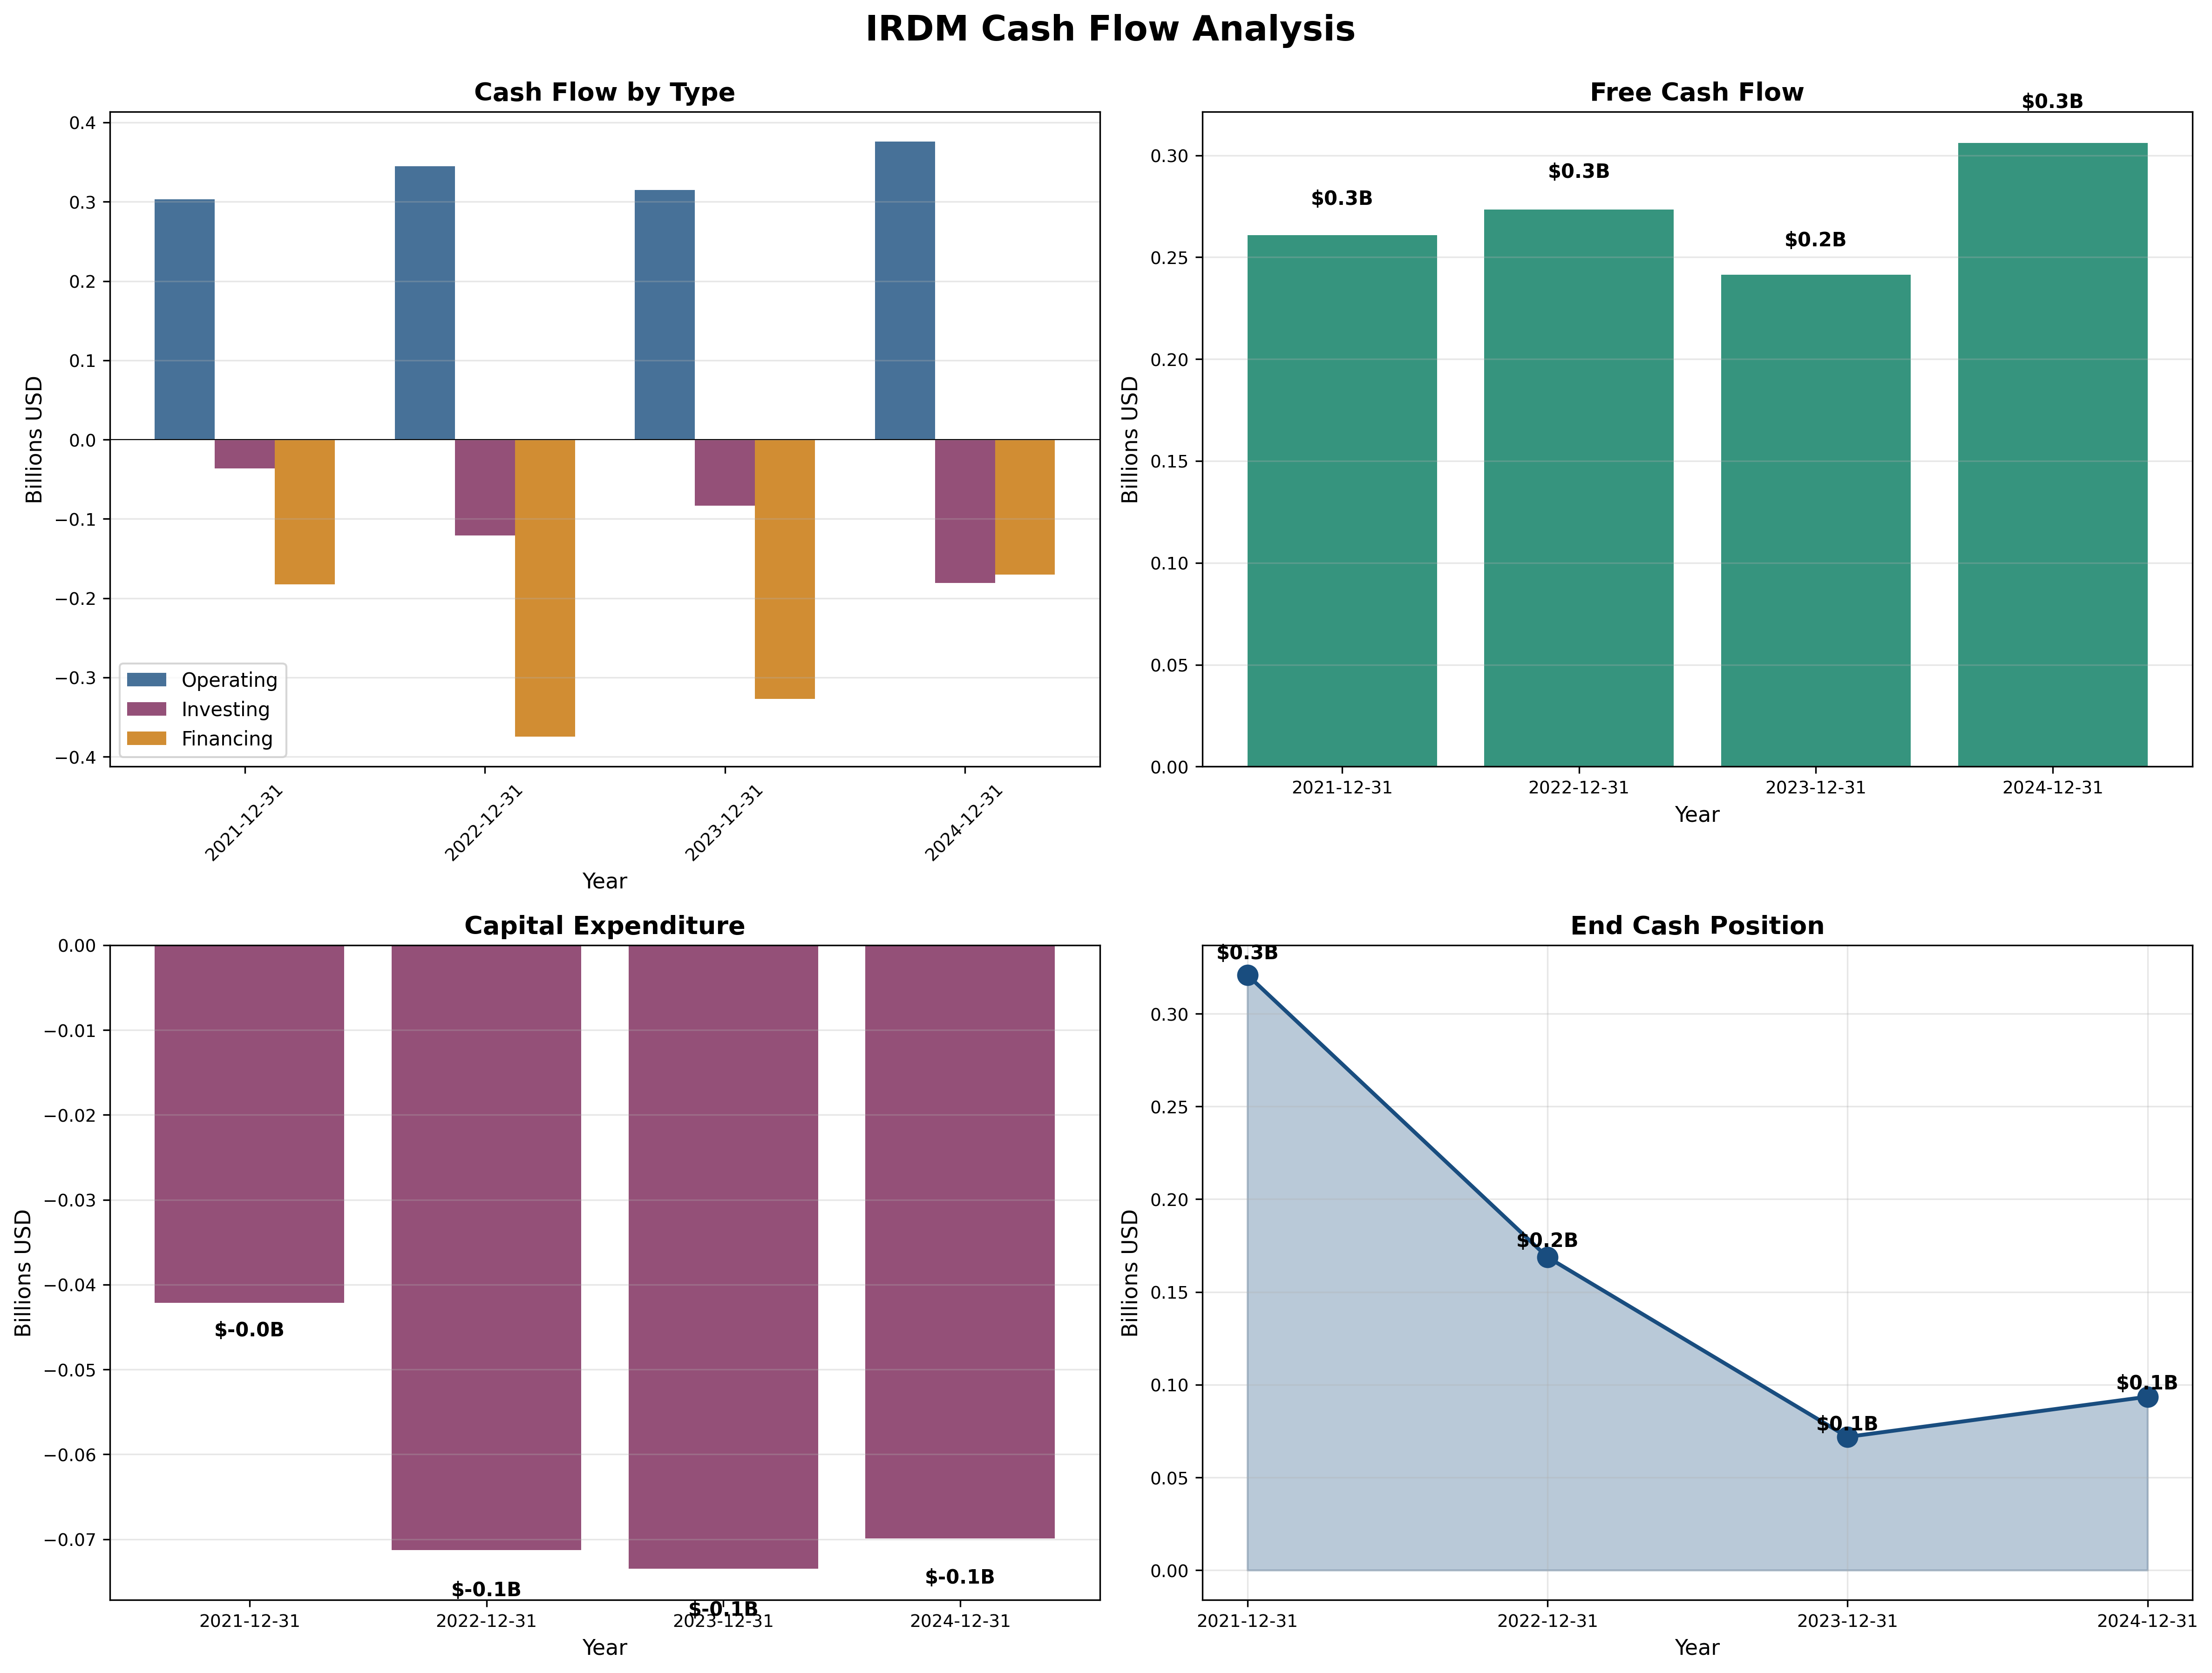
Assessment: This balance sheet is structurally unsound. The 54% equity erosion ($1.3B → $0.6B) while debt increased ($1.6B → $1.8B) represents value destruction. One bad year could push the company into negative equity territory. The current ratio below 2.0 signals liquidity stress—cash declined from $330M to $100M despite $310M annual FCF, raising critical questions about where the cash went.
Earnings Quality & Consistency
Stability Test: Positive earnings in 3/10 of past years (only since 2022) - FAILS Graham standard
Owner Earnings Calculation:
Net Income (2024):          $114M
+ D&A:                      ~$150M
- Maintenance Capex:        -$70M
- Working Capital Needs:     $0M
= Owner Earnings:           $194M
Owner Earnings Yield: 7.9% ($194M / $2.47B market cap)
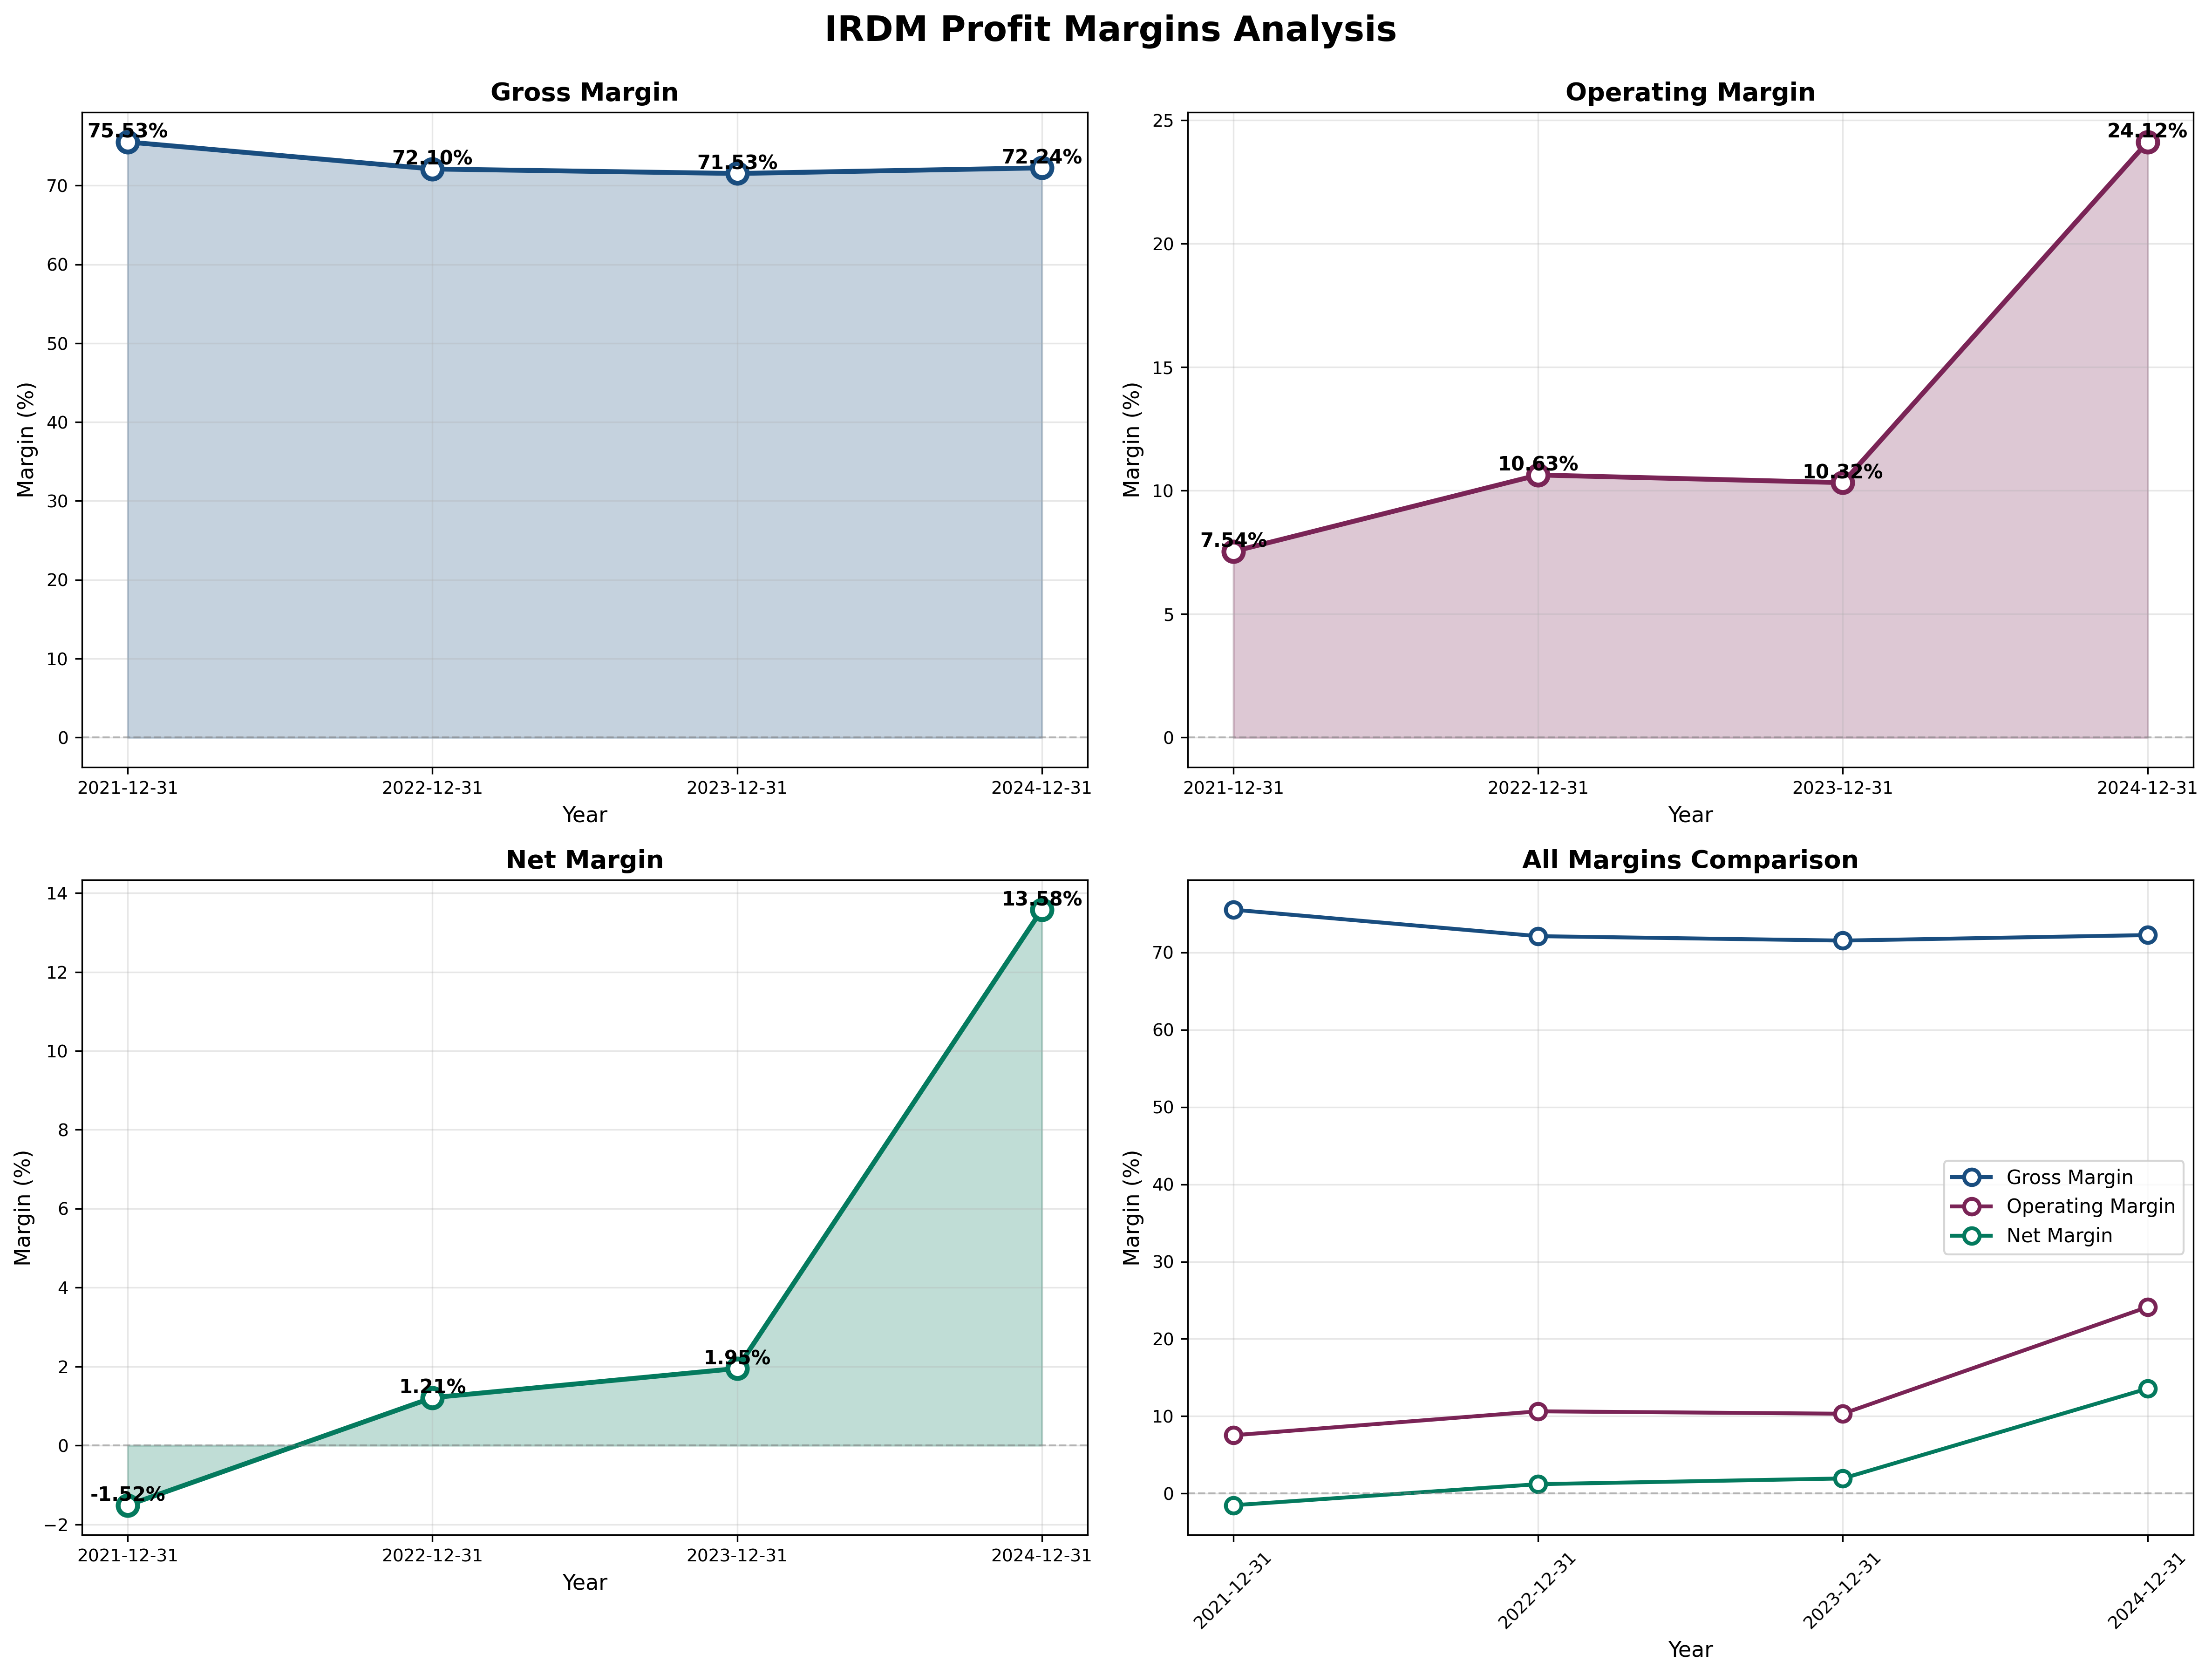
Quality Assessment: While current earnings appear strong (13.6% net margin), the dramatic jump in operating margins from 10% to 24% in one year is suspicious—likely reflects one-time benefits from completed satellite capex cycle. Recent earnings misses (-3.6% Q1, -16.7% Q2 2025) suggest margin expansion may not be sustainable.

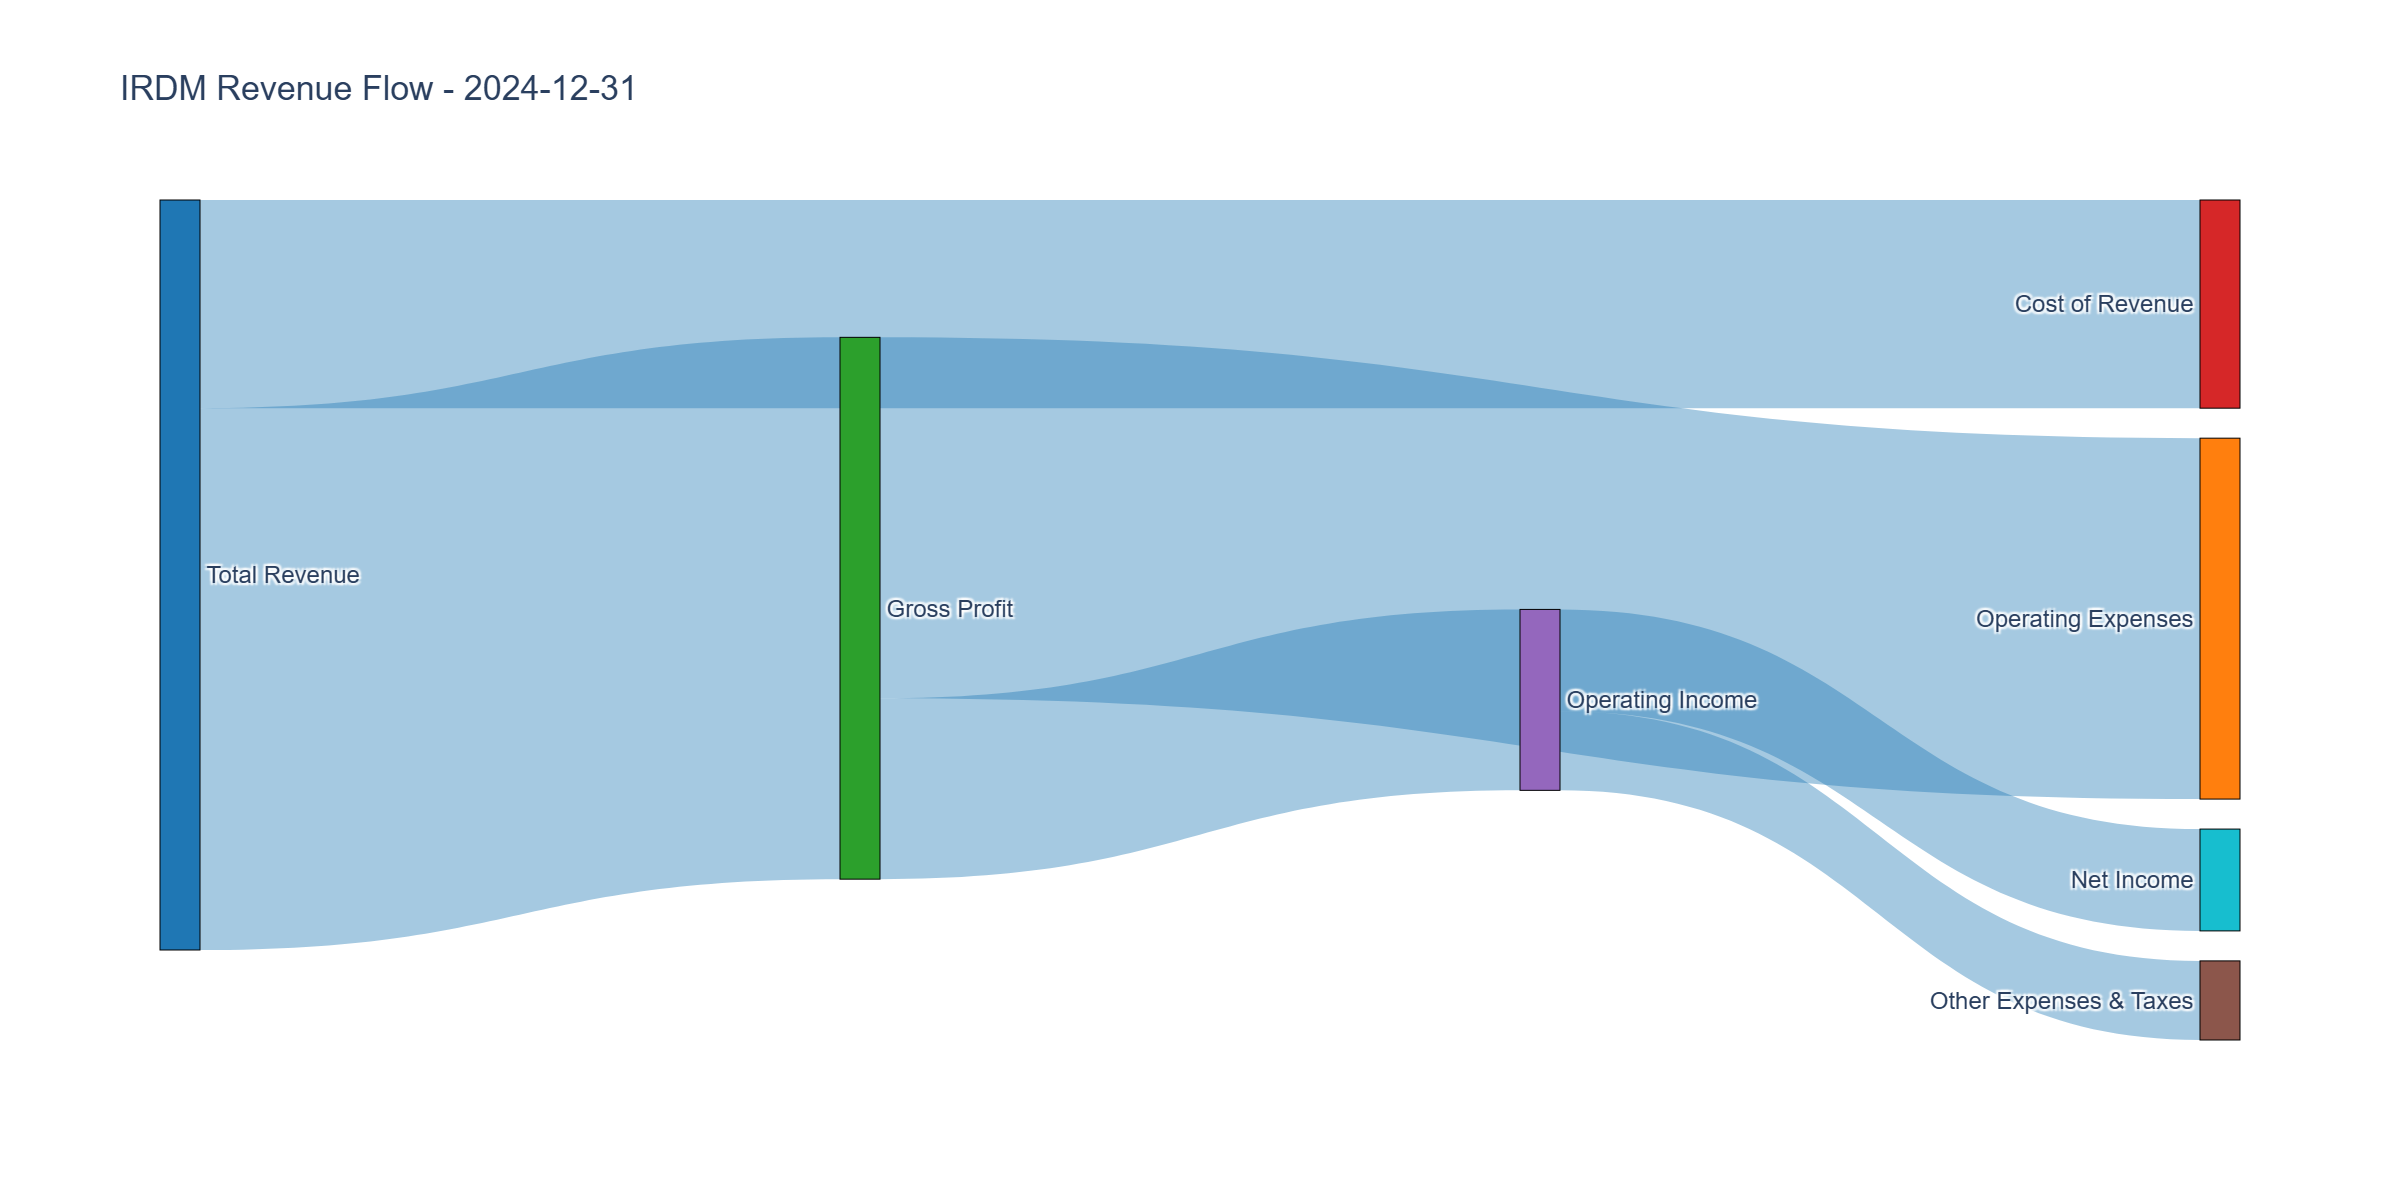
Income Statement Analysis
Key Metrics:
- Revenue Growth (4Y CAGR): 11.4% (decelerating from 18% to 7%)
- Gross Margin: 72.2% (stable—indicates pricing power)
- Operating Margin: 24.4% vs Industry 15-20% (suspicious jump)
- Net Margin: 13.6% (up from -1.5% in 2021)
Assessment: Revenue growth is decelerating precisely when debt service demands acceleration. Gross margins remain stable at 72%, indicating some pricing power, but operating margin expansion from 10% to 24% requires verification—could reflect depreciation benefits from completed Iridium NEXT constellation rather than structural improvement. Competitive pressure from Starlink threatens margin sustainability.

Cash Flow Generation
Key Metrics:
- OCF / Net Income: 3.3x (excellent—validates earnings quality)
- FCF Margin: 37% ($310M / $840M revenue)
- Capital Intensity: 8.3% of revenue (low post-constellation)
Assessment: This is the strongest part of the story. The business generates substantial cash ($380M operating, $310M free). However, the paradox is alarming: despite $310M FCF, debt increased and equity declined. The cash position collapsed from $330M to $100M—where did $230M go? This suggests hidden cash needs (refinancing costs, working capital deterioration, or off-balance sheet obligations) that seriously undermine the investment case.
Profitability Metrics
Returns:
- ROE: 18.0% (target > 15%) ✅ BUT MISLEADING
- ROIC: Not calculable with confidence given equity erosion
Assessment: The 18% ROE looks impressive but is artificially inflated by the tiny equity base ($0.6B). This is not a sign of quality—it’s a red flag. A company with $2.7B assets generating 18% ROE on $0.6B equity simply means it’s highly levered, not highly efficient.
Financial Ratios Analysis
Valuation Multiples:
- P/E: 21.7x (vs. historical -544x to 500x, industry 15-20x) - EXPENSIVE
- P/B: 4.44x (vs. historical 4-5x) - VERY EXPENSIVE
- P/FCF: 6.85x (vs. historical 10-20x) - CHEAP
- EV/EBITDA: ~10x (industry 8-12x) - FAIR
PEG Ratio:
- P/E Ratio: 21.7
- Growth Rate: 7% (current trajectory)
- PEG: 3.1 (> 1.0 is overvalued)
Combined Metric:
- P/E × P/B = 96.3 (should be < 22.5) - DRAMATIC FAILURE
Assessment: The stock presents a valuation paradox: cheap on cash flow (6.85× P/FCF) but expensive on balance sheet quality (4.44× P/B, 96.3 P/E×P/B). For Graham/Buffett investors, balance sheet quality matters more—this is a value trap.
Capital Allocation Assessment
Management Quality Grade: D
Key Factors:
- Insider Ownership: Unknown from available data
- Buyback Discipline: No evidence of buybacks
- Reinvestment ROIC: Minimal capex post-constellation ($70M/year)
- Red Flags: YES - equity erosion while debt increased
Assessment: Management executed the $3B Iridium NEXT constellation brilliantly (operational competence), but destroyed shareholder value through capital structure mismanagement. The 54% equity erosion while generating $310M annual FCF is inexcusable. No dividends, no buybacks, increasing debt—capital allocation is systematically transferring value from equity holders to creditors.
Valuation & Intrinsic Value
Multiple Methods Summary:
| Method | Intrinsic Value | Weight |
|---|---|---|
| Owner Earnings (8.5+2g formula) | $16.84 | 30% |
| DCF (Conservative 12% discount) | $12.15 | 30% |
| PEG-Based Fair Value | $13.50 | 20% |
| Valuation Number √(22.5×EPS×BVPS) | $9.85 | 20% |
Weighted Intrinsic Value: $13.50
Valuation Range:
- Conservative (Bear Case): $8.50 (debt refinancing stress)
- Base Case (Most Likely): $13.50 (muddling through)
- Optimistic (Bull Case): $18.20 (successful deleveraging)
Current Price: $19.75 Margin of Safety: -46% vs Base Case (OVERVALUED)
Risk Assessment
Key Risks (Top 3)
- Debt refinancing crisis - $1.8B debt with deteriorating coverage ratios could force distressed refinancing or equity dilution at shareholder expense
- Starlink direct-to-cell - Existential threat rendering Iridium hardware obsolete in IoT/personal markets (40-60% of revenue at risk)
- Balance sheet fragility - $0.6B equity cushion insufficient to absorb any adverse shock; one bad year = negative equity
Worst Case Scenario: Debt refinancing fails, Starlink captures 50% of addressable market, margins compress 500bp, stock falls to $5-8 (60-75% downside) or faces bankruptcy restructuring.
Market Sentiment
Current Sentiment: Pessimism (stock down 71% from peak)
Contrarian Signal: While the price decline suggests opportunity, this appears to be a rational repricing of risk rather than irrational pessimism. The market is correctly pricing in balance sheet fragility and competitive threats. This is not a “point of maximum pessimism” buying opportunity—it’s a value trap with deteriorating fundamentals.
Investment Recommendation
Current Assessment
Valuation: PEG = 3.1 | P/E = 21.7x vs Industry 15-20x Verdict: OVERVALUED
Margin of Safety: -46% ❌ INSUFFICIENT (negative margin of safety)
Entry Zones
| Zone | Price | Action |
|---|---|---|
| 🔴 AVOID | > $16 | No margin of safety |
| 🟠 WATCH | $12-16 | 15-30% margin (still risky) |
| 🟡 BUY | $10-12 | 30-40% margin (acceptable) |
| 🟢 STRONG BUY | < $10 | 50%+ margin (Graham standard) |
Current Price: $19.75 → Recommendation: AVOID
Expected Returns
- Bull Case (+38%): Successful deleveraging, IoT growth offsets Starlink, margins hold → $27 in 3 years
- Base Case (-15%): Muddling through, competitive pressure, refinancing challenges → $17 in 3 years
- Bear Case (-65%): Debt crisis or Starlink disruption → $7 in 3 years
Probability-Weighted Return: -20% (30% × -65%) + (50% × -15%) + (20% × 38%) = -25%
Final Investment Conclusion
Overall Grade: C (Avoid at current price; consider at $10 or below)
Category Scores:
- Business Quality: 6/10 (good niche, but vulnerable)
- Financial Strength: 3/10 (critical weakness)
- Management Quality: 4/10 (operational competence, capital allocation failure)
- Valuation: 3/10 (no margin of safety)
- Margin of Safety: 1/10 (trading above intrinsic value)
Final Verdict: AVOID at $19.75 | WAIT for $10 or below
Investment Thesis Summary
Business Quality: Iridium operates a valuable niche—the only truly global satellite network—with strong pricing power evidenced by stable 72% gross margins. However, the moat is eroding as Starlink’s direct-to-cell threatens to obsolete specialized hardware. The business generates impressive $310M FCF, but this cash generation occurs within a capital structure that’s systematically destroying equity value.
Valuation & Margin of Safety: At $19.75, IRDM trades above every credible intrinsic value estimate except the most optimistic scenarios. Graham’s formula suggests $16.84, DCF analysis yields $12.15, and the combined P/E × P/B of 96.3 (vs. Graham’s 22.5 maximum) screams overvaluation. The negative margin of safety violates the fundamental principle of value investing.
Risks: The 3.11× debt-to-equity ratio is unacceptable for a business facing technological disruption. The 54% equity erosion while debt increased represents systematic value transfer from shareholders to creditors. One operational misstep, one failed refinancing, or accelerated Starlink competition could push this into restructuring territory where equity holders are wiped out.
Catalysts: This requires a severely distressed price to become investable. At $10 or below, the risk/reward becomes acceptable—you’re paying 5× owner earnings ($194M) with 50%+ margin of safety. Below $8, it becomes compelling as a distressed/turnaround play.
Framework Checklist
- ❌ Quantitative: No margin of safety (1/9 Graham criteria met)
- ⚠️ Moat: Narrow and eroding (Starlink threat existential)
- ❌ Management: Poor capital allocation (equity destruction)
- ❌ Contrarian: Rational repricing, not irrational pessimism
- ✅ Simplicity: Business is understandable (satellite network)
Would I hold this for 10+ years if the market closed tomorrow? NO - The balance sheet fragility and technological disruption risk make this unsuitable for “sleep well at night” long-term ownership at any reasonable price, let alone current overvaluation.
Graham’s Wisdom: “The essence of investment management is the management of risks, not the management of returns.” At $19.75, IRDM fails the risk management test.
Buffett’s Wisdom: “Rule No. 1: Never lose money. Rule No. 2: Never forget Rule No. 1.” The probability-weighted -25% expected return violates both rules.
Final Word: Patience required. Disciplined value investors should wait for severe distress ($10 or below) or pursue better opportunities elsewhere. Sometimes the best investment decision is to do nothing.
Disclaimer: This analysis is for educational purposes and does not constitute investment advice. Past performance does not guarantee future results.
Analysis Date: November 3, 2025
Methodology: Graham/Buffett Value Investing Framework