Executive Summary
Investment Thesis: Micron is a leading memory chip manufacturer riding the AI wave but trading at peak valuations with extreme cyclicality risk. While fundamentally recovering strongly from 2023’s downturn, the stock has run ahead of intrinsic value with minimal margin of safety.
Business Classification: Cyclical (highly sensitive to semiconductor industry cycles)
Current Valuation Assessment:
- Current Price: $223.77
- Estimated Intrinsic Value: $140 - $170
- Margin of Safety: -32% to -24% (OVERVALUED)
- Recommendation: AVOID at current levels
Recommended Entry Zones:
- Aggressive Entry: < $120 (40%+ margin)
- Standard Entry: $120 - $150 (30% margin)
- Hold/Avoid: > $170 (current price significantly exceeds)
Business Overview
What They Do (2-Minute Test)
Micron makes memory chips—DRAM and NAND flash—that store data in everything from smartphones to data centers. Think of them as the “short-term memory” provider for the computing world. Customers buy because there are only three major global suppliers (Micron, Samsung, SK Hynix), and switching suppliers involves costly requalification. Recently, their high-bandwidth memory (HBM) chips have become critical for AI systems.
Competitive Position & Moat Analysis
Primary Moat Type: Efficient Scale + Cost Advantage
Moat Strength: ⭐⭐⭐ (out of 5)
Key Moat Factors:
- Oligopoly structure: Only 3 major global DRAM producers, massive $10B+ capital barriers to entry
- Technological leadership: HBM4 memory at 2.8TB/s bandwidth, ahead of Samsung and SK Hynix
- Vertical integration: Controls entire production process from design to manufacturing
- Customer lock-in: Product requalification costs create moderate switching barriers
Moat Durability:
- Status: Stable but vulnerable - Technology leadership provides advantage, but memory is inherently commoditized and Chinese competition is emerging long-term
- Key Threat: Industry overcapacity cycles and potential Chinese market disruption in 5-10 years
Industry Dynamics
50-Year Outlook: Memory demand should grow with computing proliferation, but this is a cyclical commodity business prone to boom-bust cycles. Likely consolidation to 2-3 global players long-term.
Key Trends:
- AI driving exponential demand for HBM (high-bandwidth memory) with 2025 supply already sold out
- Data center modernization favoring advanced memory solutions (56% of Micron’s revenue)
- Geopolitical reshoring creating $200B US manufacturing investment opportunity
Quantitative Checklist
Defensive Investor Criteria:
| Criterion | Requirement | Actual | Pass/Fail |
|---|---|---|---|
| Earnings Stability | Positive 10 years | 7/10 years | ❌ |
| Dividend Record | Some payment | $0 current | ❌ |
| Earnings Growth | +33% in 10 years | Cyclical, volatile | ❌ |
| P/E Ratio | < 15x | 22.4x | ❌ |
| P/B Ratio | < 1.5x | 4.03x | ❌ |
| P/E × P/B | < 22.5 | 90.3 | ❌ |
| Current Ratio | > 2.0 | 2.52 | ✅ |
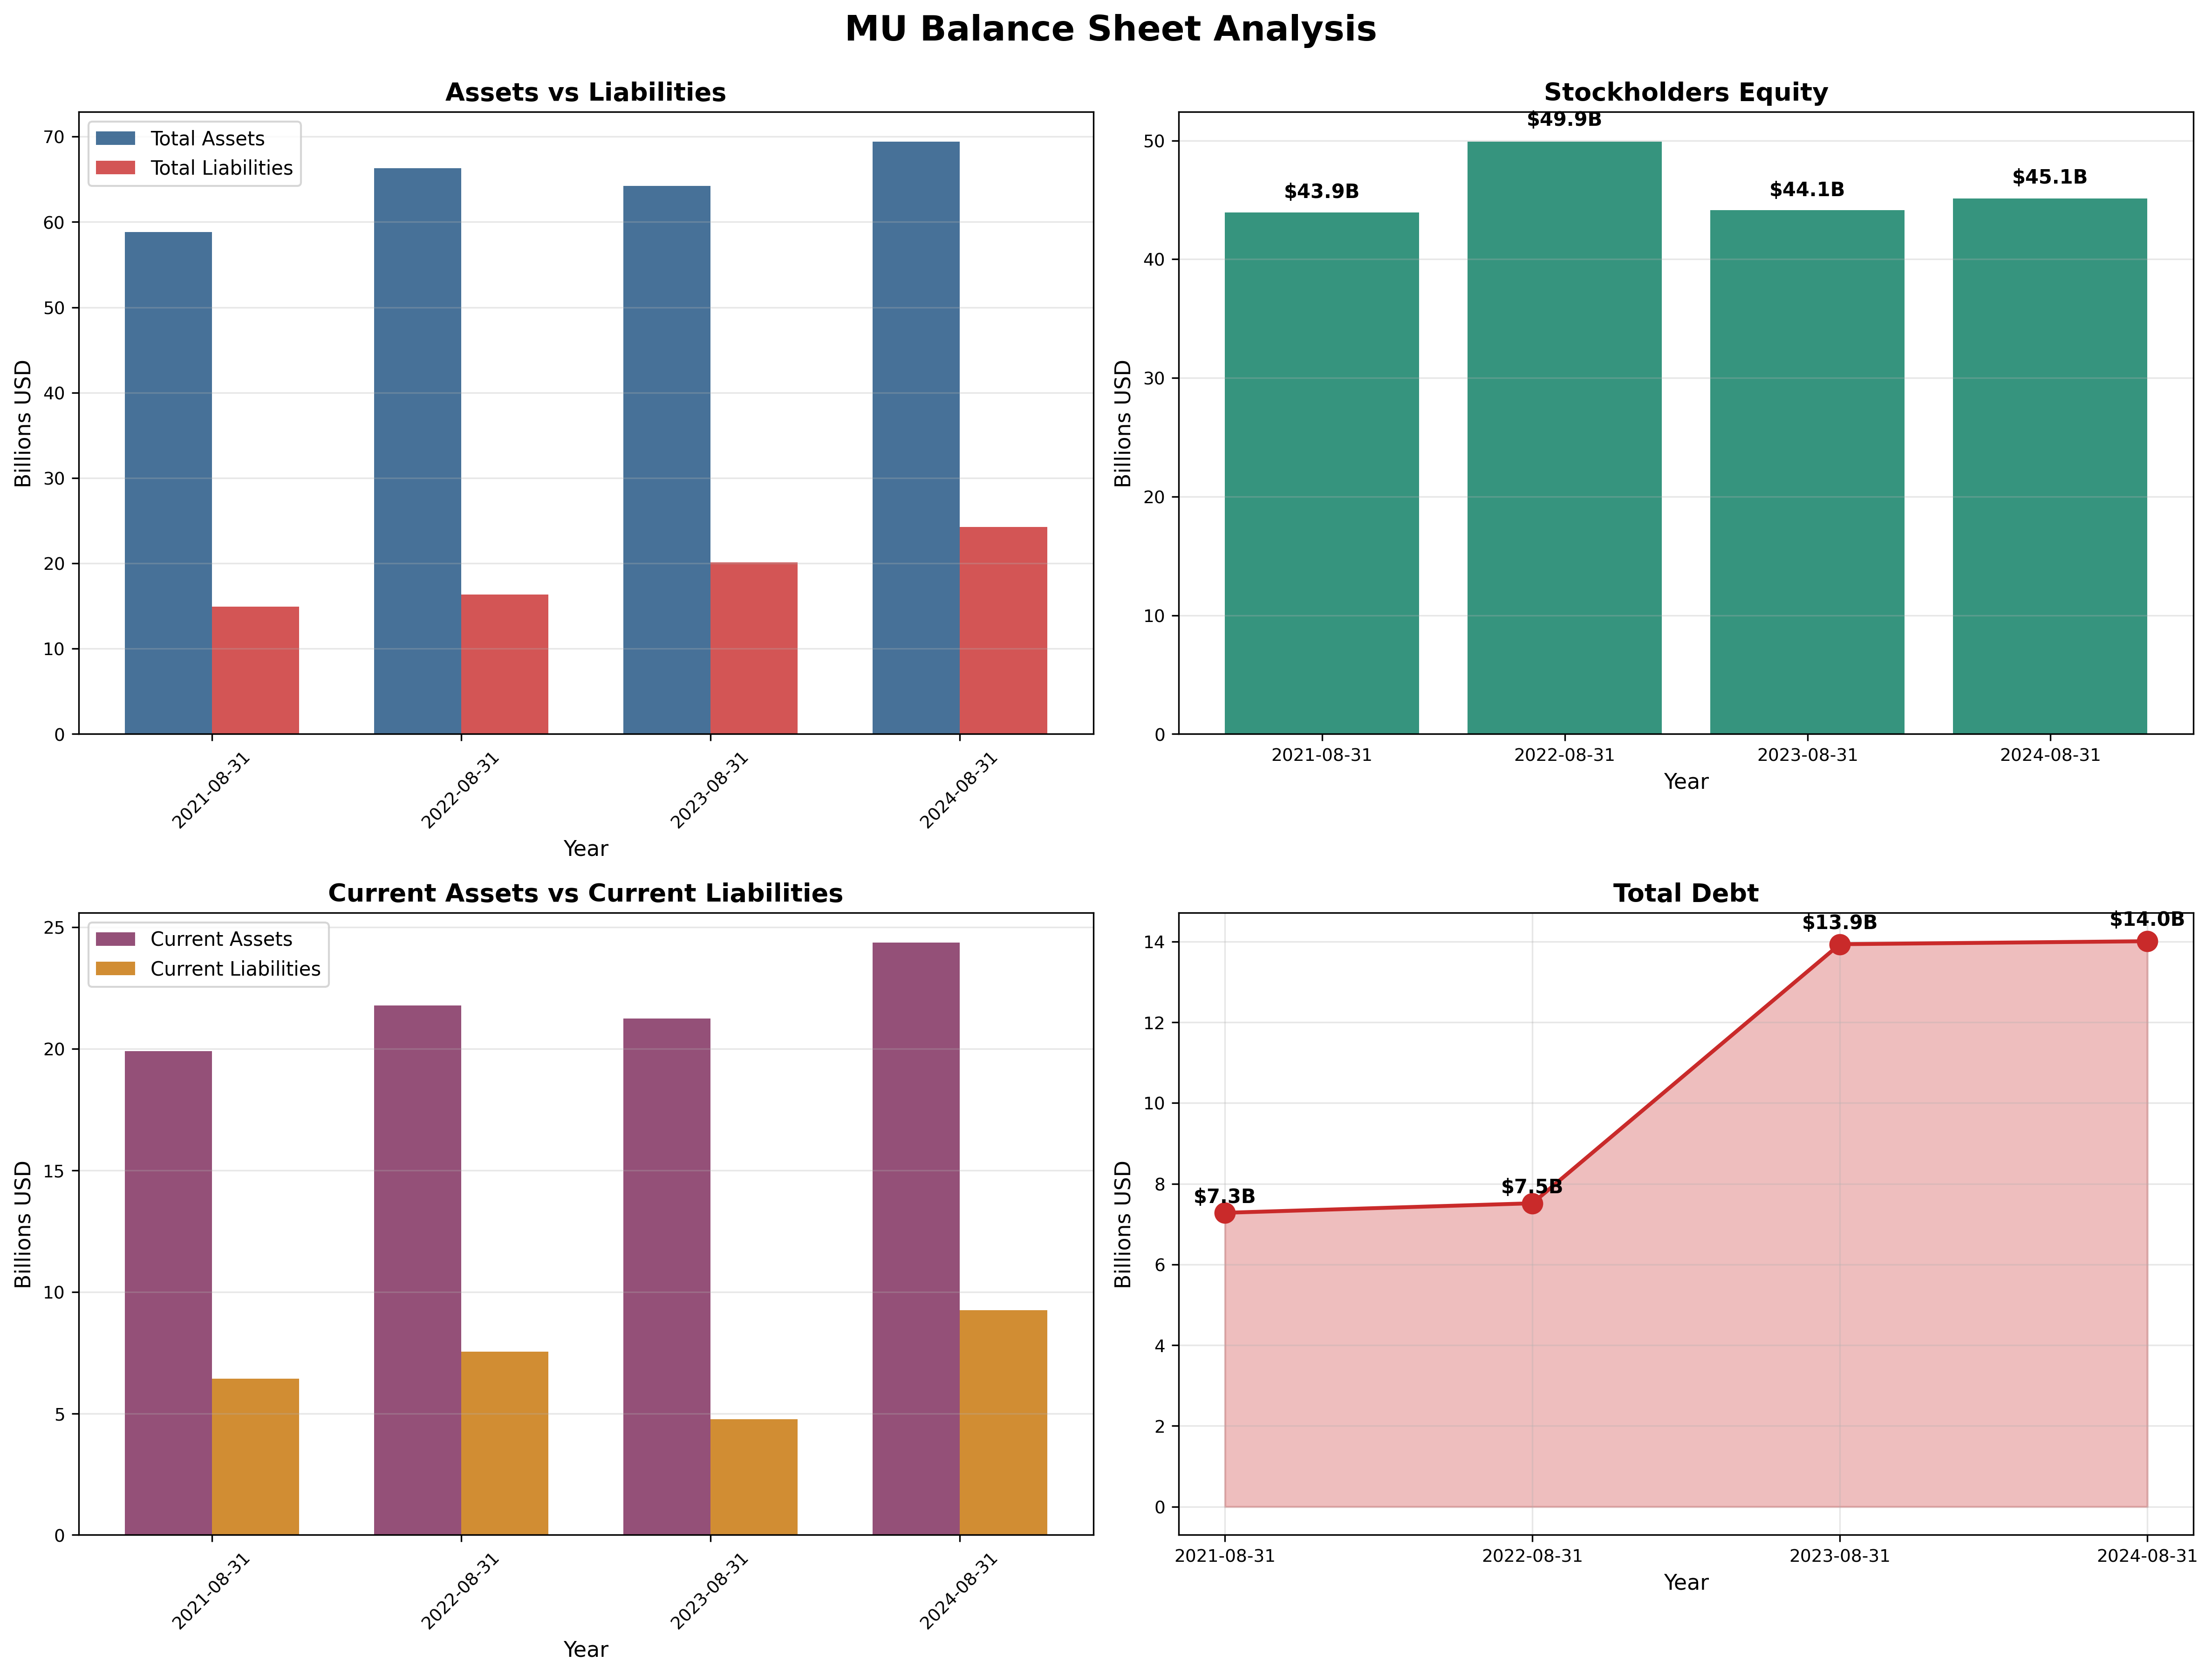
| Debt vs NCA | Debt < NCA | $14B vs $15B | ✅ |
Quantitative Score: 2/9 criteria met
Analysis: Micron fails most defensive investor tests. The company is inherently cyclical with negative earnings in 3 of the last 10 years (including brutal -$5.8B loss in 2023). No dividend. Valuation multiples are stretched after the stock’s recovery rally. Only balance sheet strength passes—decent liquidity and manageable debt relative to equity. This is NOT a defensive investment; it’s a cyclical speculation.
Financial Analysis with Critical Assessment
Balance Sheet Strength
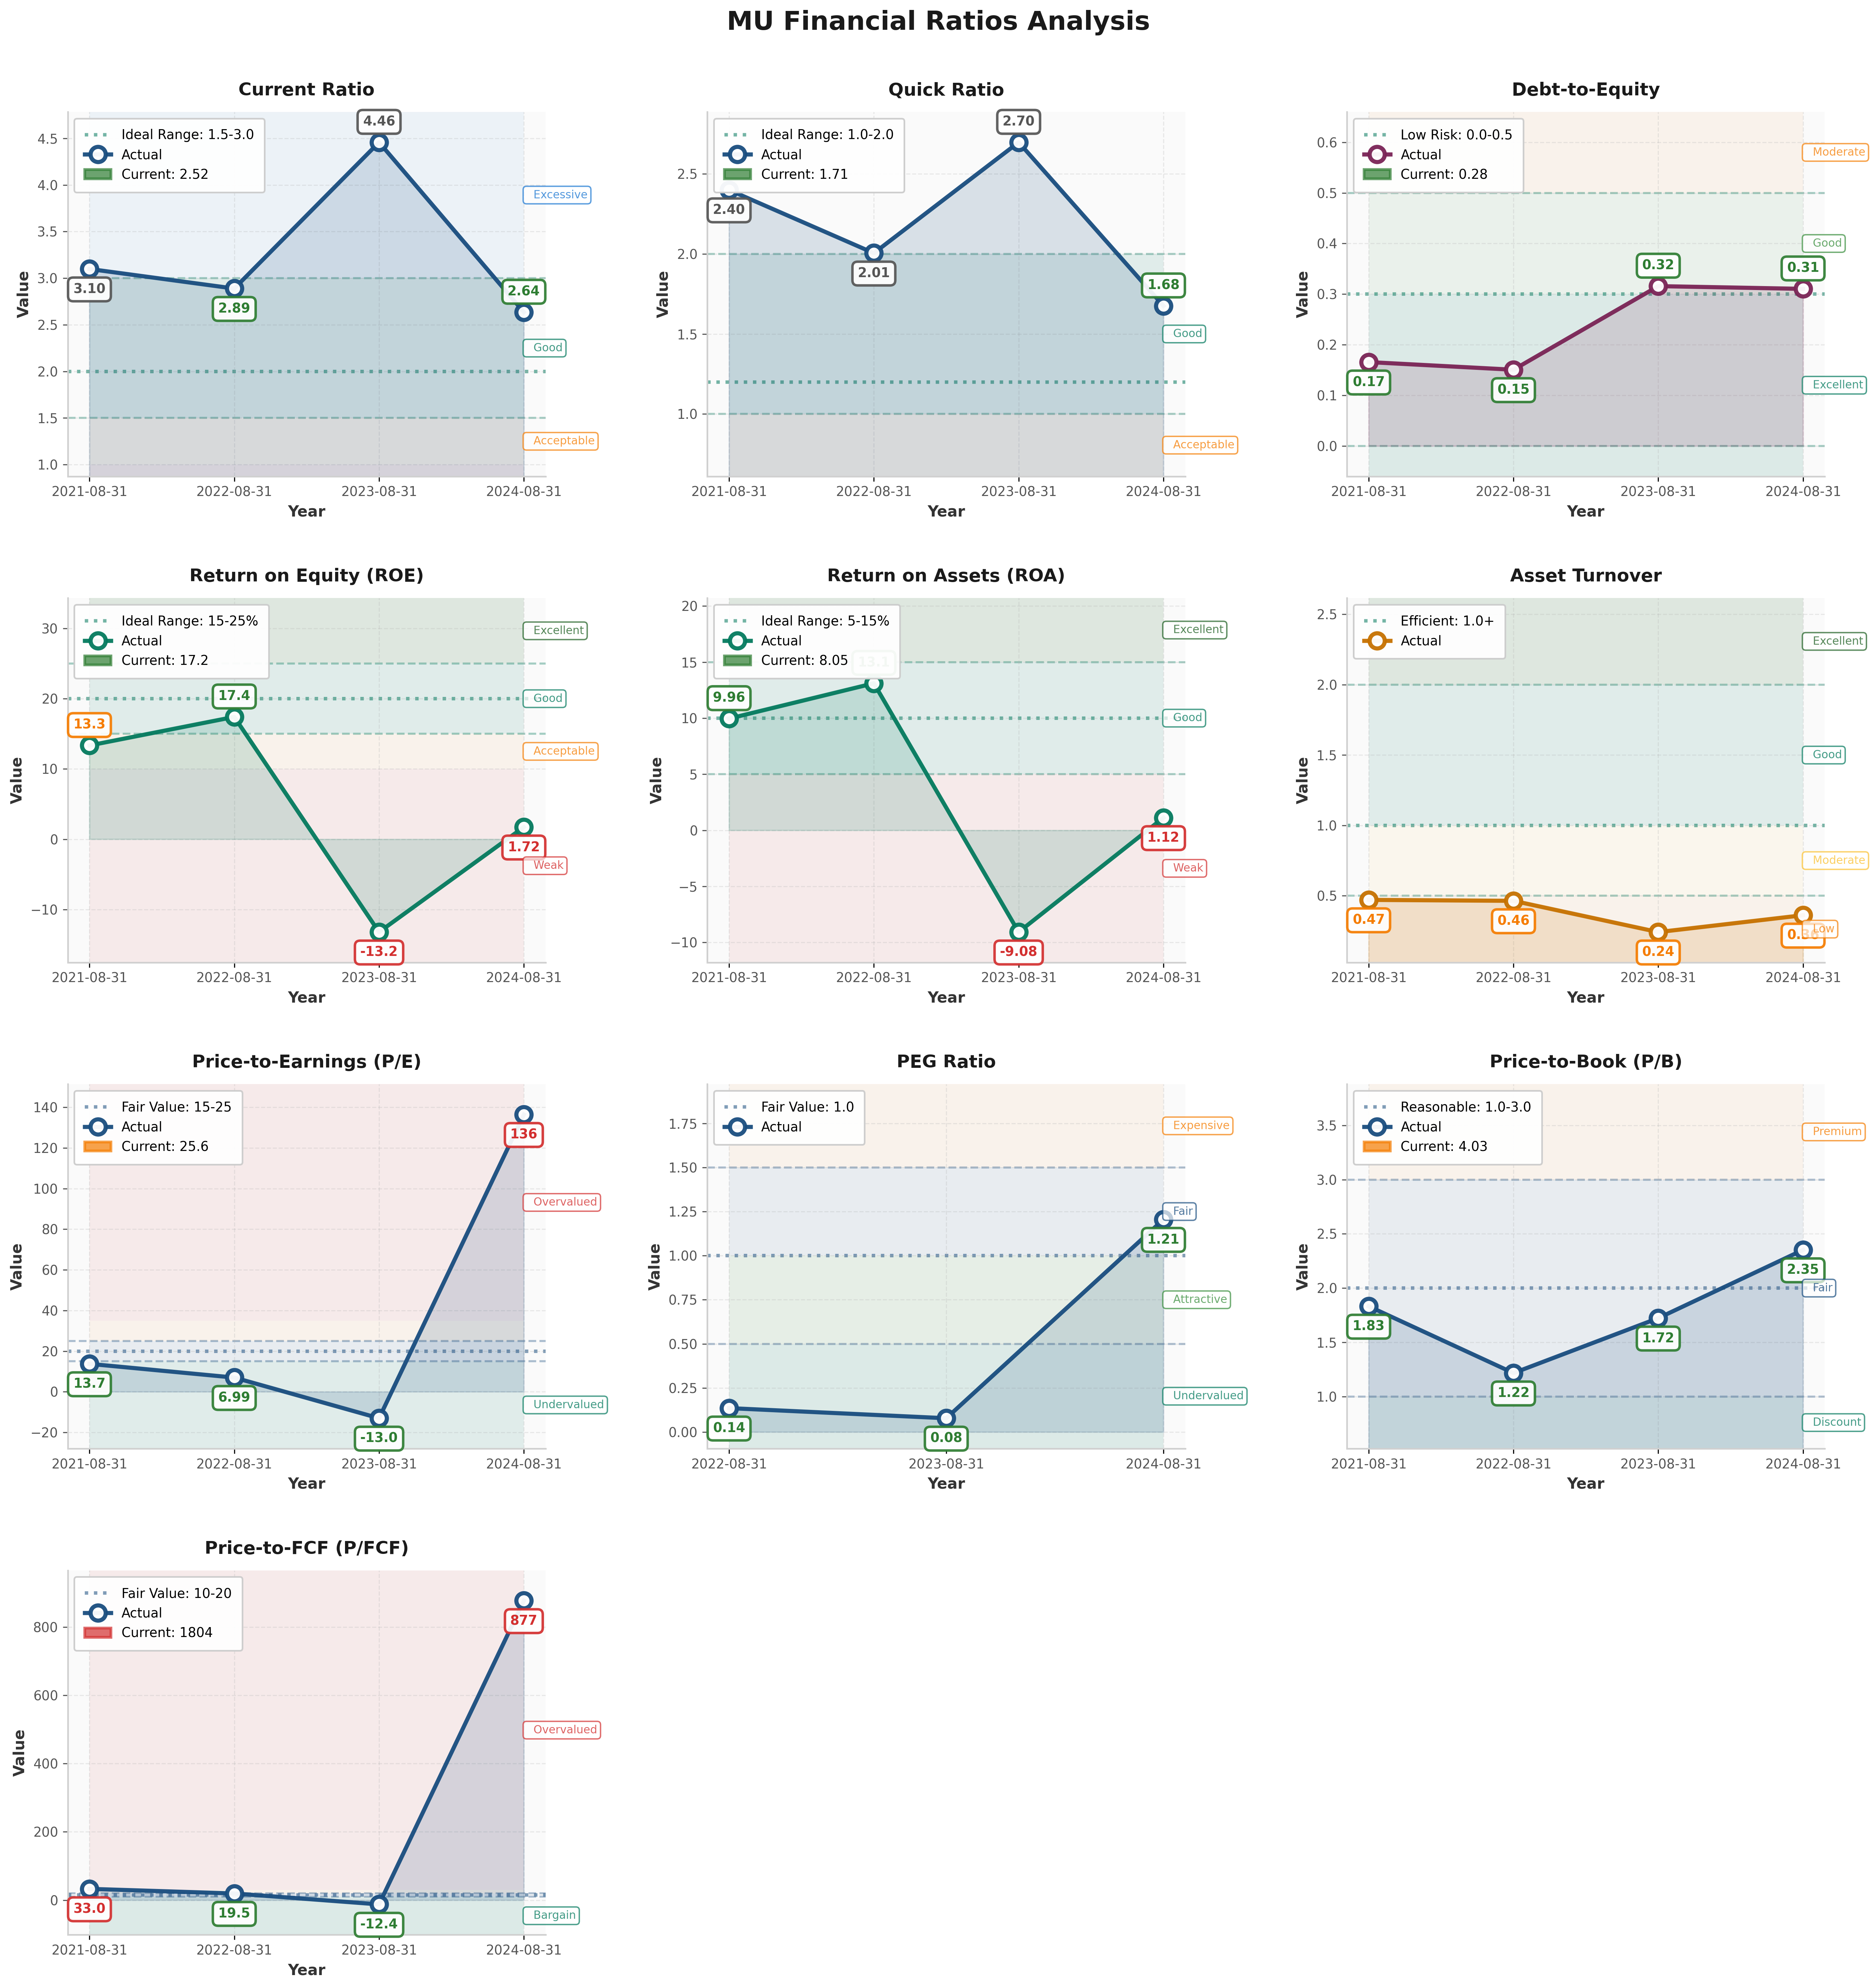
Key Metrics:
- Current Ratio: 2.52 (target > 2.0) - ✅
- Debt-to-Equity: 0.28 (target < 0.5) - ✅
- Interest Coverage: >10x (target > 5x) - ✅
Assessment: Fortress balance sheet. Micron learned from past downturns and maintains strong liquidity ($7.1B cash) with conservative leverage (debt nearly doubled to $14B but still only 31% of equity). Current assets of $24B easily cover $9B in current liabilities. This financial discipline provides crucial survival cushion during industry downturns.
Earnings Quality & Consistency
Stability Test: Positive earnings in 7/10 of past 10 years (major losses in 2016, 2020, 2023)
Owner Earnings Calculation:
Net Income (FY2024): $0.8B
+ D&A: ~$9B
- Maintenance Capex: ~$7B (est. 80% of total $8.4B)
- Working Capital Needs: ~$1B
= Owner Earnings: ~$1.8B
Owner Earnings Yield: 0.8% (Market Cap ~$243B / Owner Earnings $1.8B) - TERRIBLE
Quality Assessment: Earnings are highly cyclical and unreliable. FY2024 shows only $0.8B profit on $25B revenue (3% margin) after catastrophic -$5.8B loss in FY2023. The 997% earnings growth is purely cyclical recovery, not sustainable quality. Massive D&A reflects capital intensity. Free cash flow near zero ($0.1B) after $8.4B capex demonstrates this is a capital-hungry business.
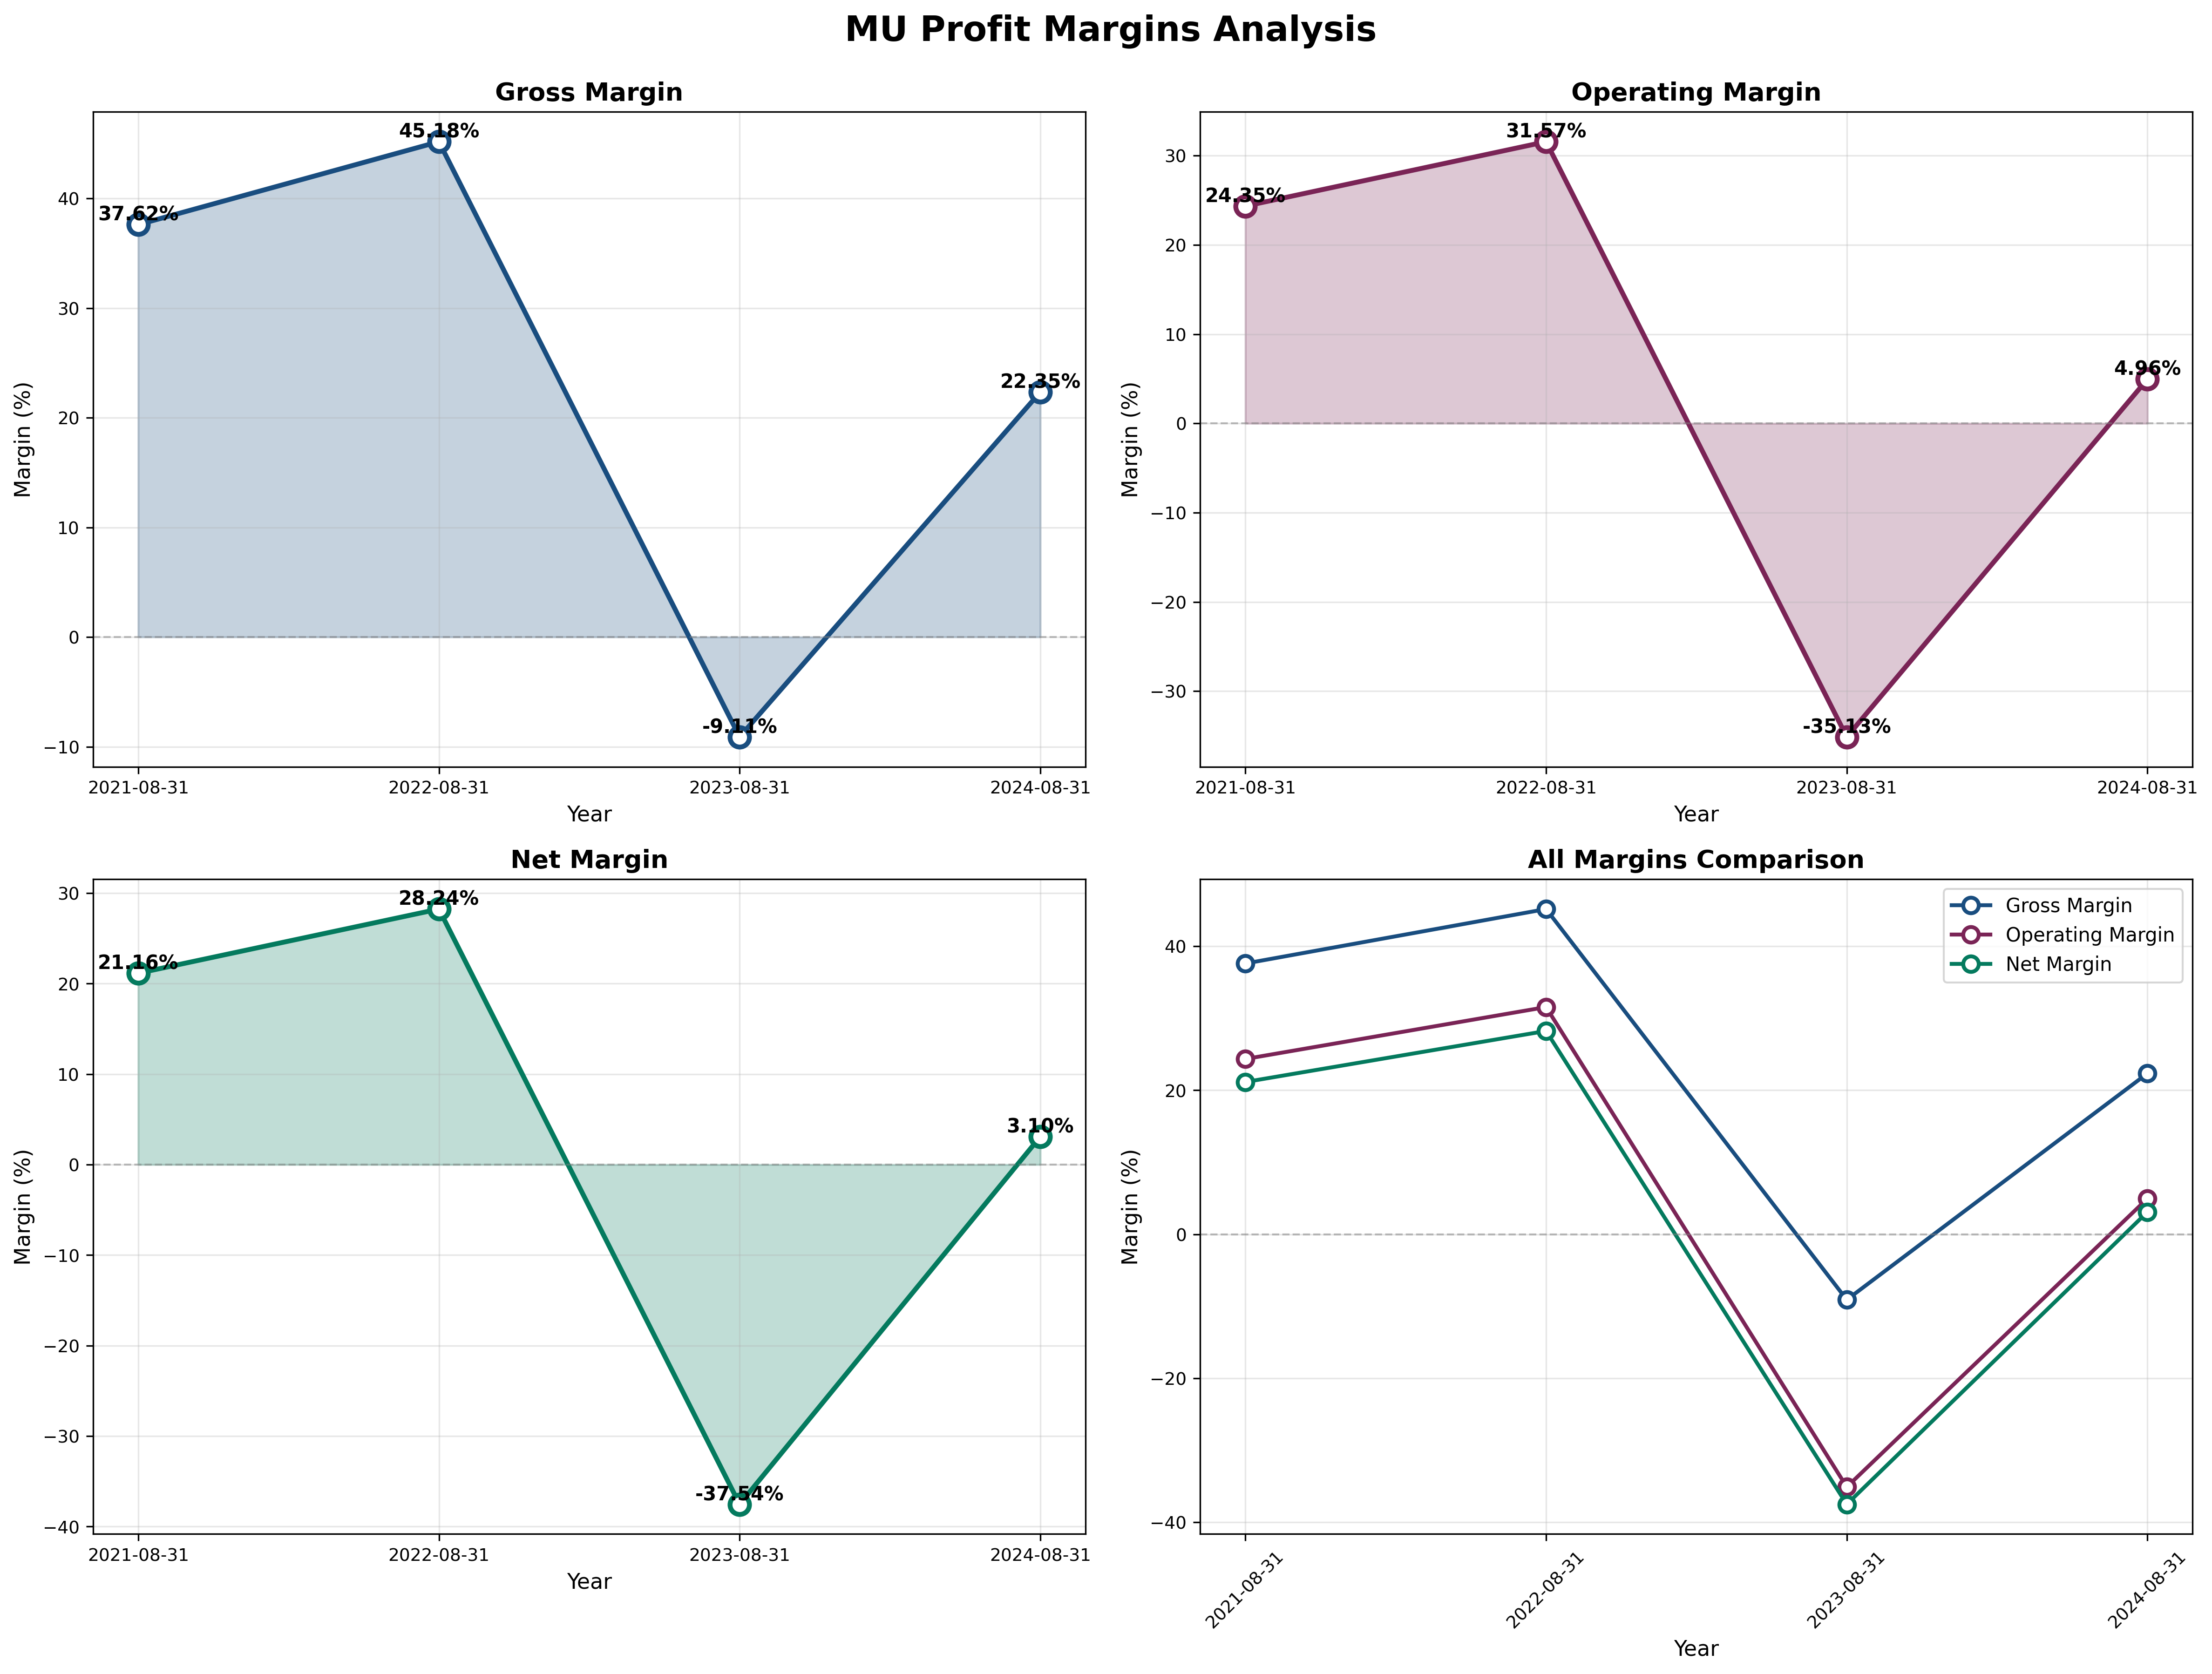
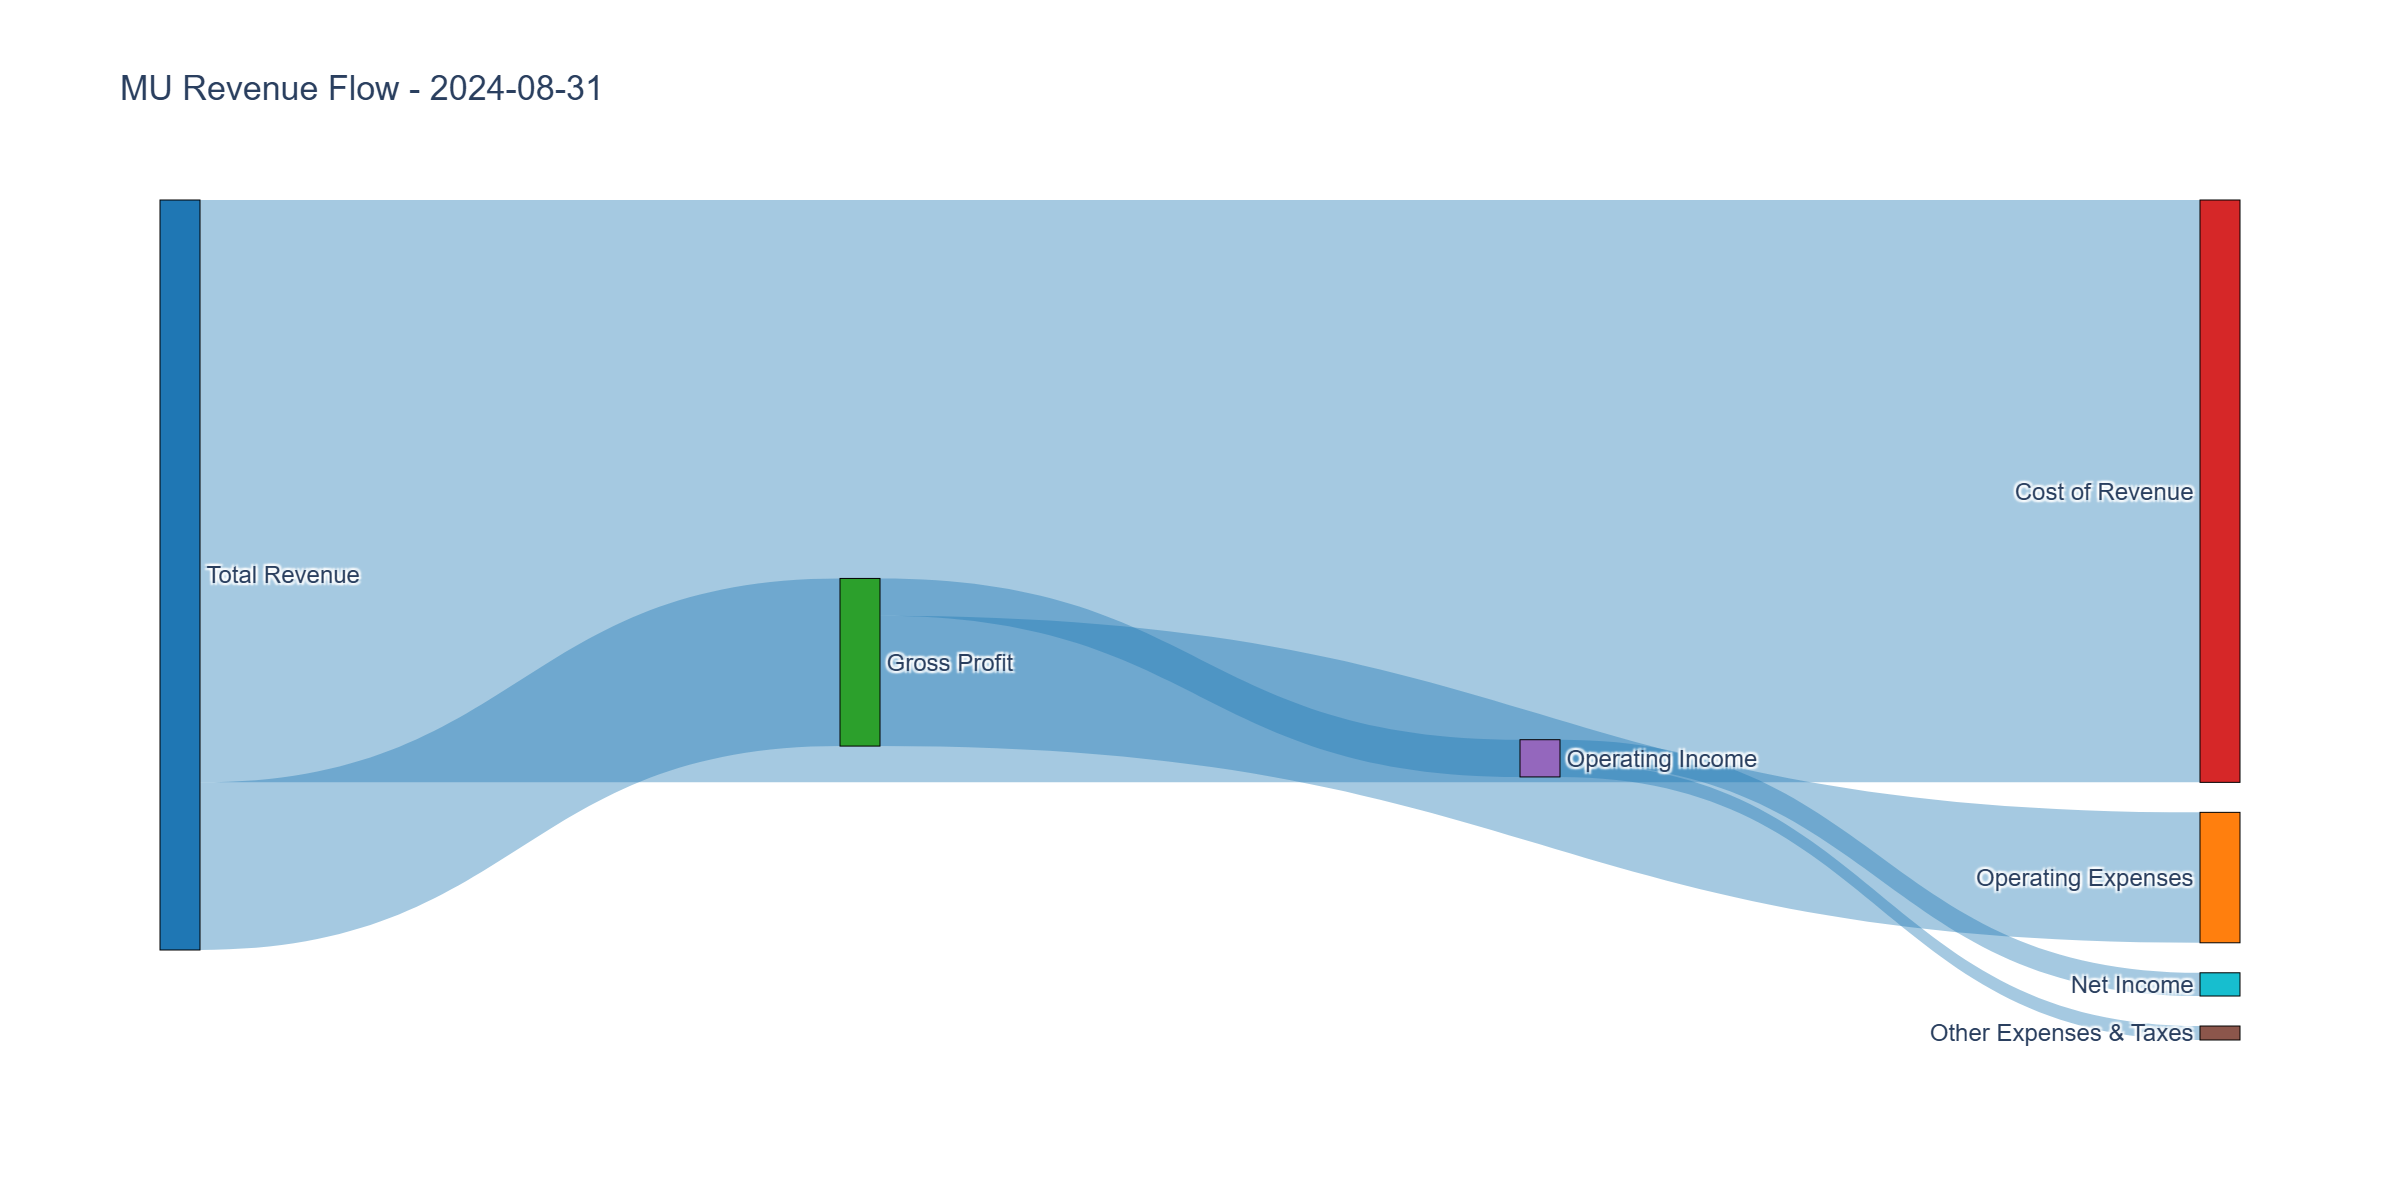
Income Statement Analysis
Key Metrics:
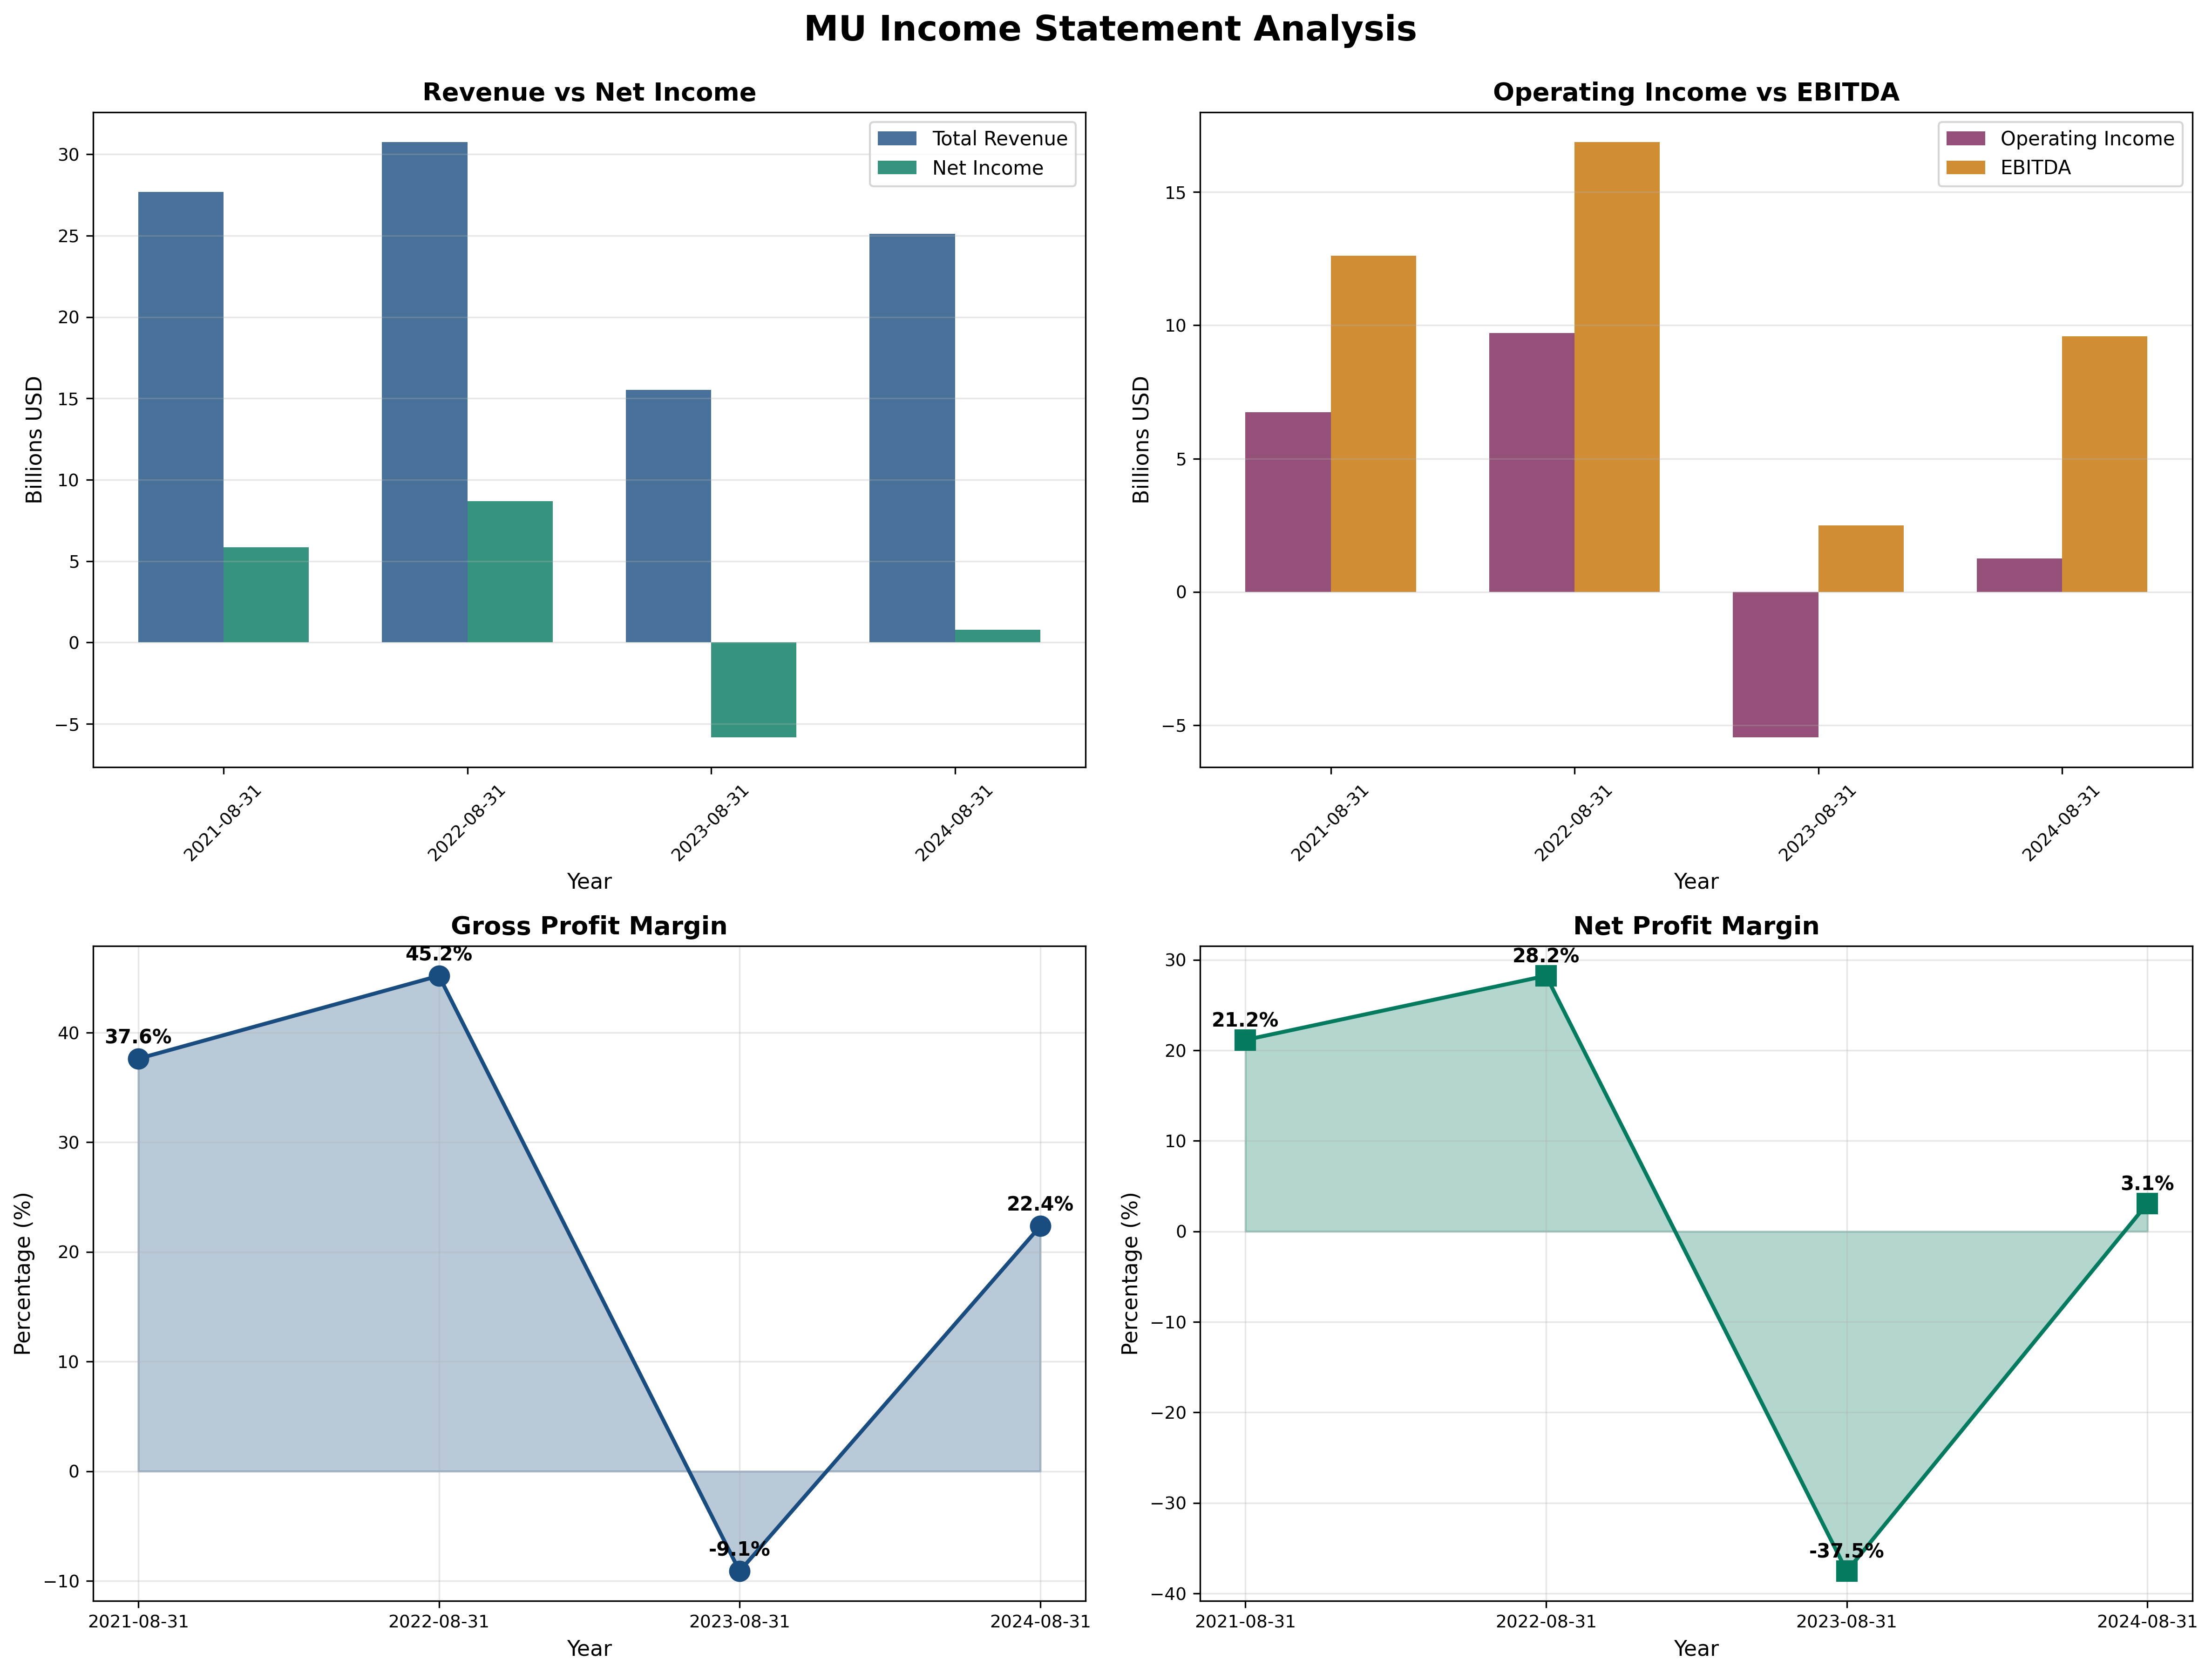
- Revenue Growth (FY2024 vs FY2023): +61% cyclical recovery (but still below FY2022 peak of $30B)
- Gross Margin: 22.4% (recovering from -9.3%, well below 45% peak)
- Operating Margin: 4.9% vs Industry ~15-20%
- Net Margin: 3.1% (razor-thin, was -37.5% in downturn)
Assessment: Classic cyclical pattern—margins collapsed to negative in 2023 downturn, now recovering but nowhere near peak levels. The 45% gross margin in 2022 boom shows pricing power in upcycles, but the -9% margin in 2023 shows vulnerability in downturns. Currently recovering but still weak margins suggest we’re mid-cycle, not early cycle. No meaningful pricing power—this is commodity memory pricing.
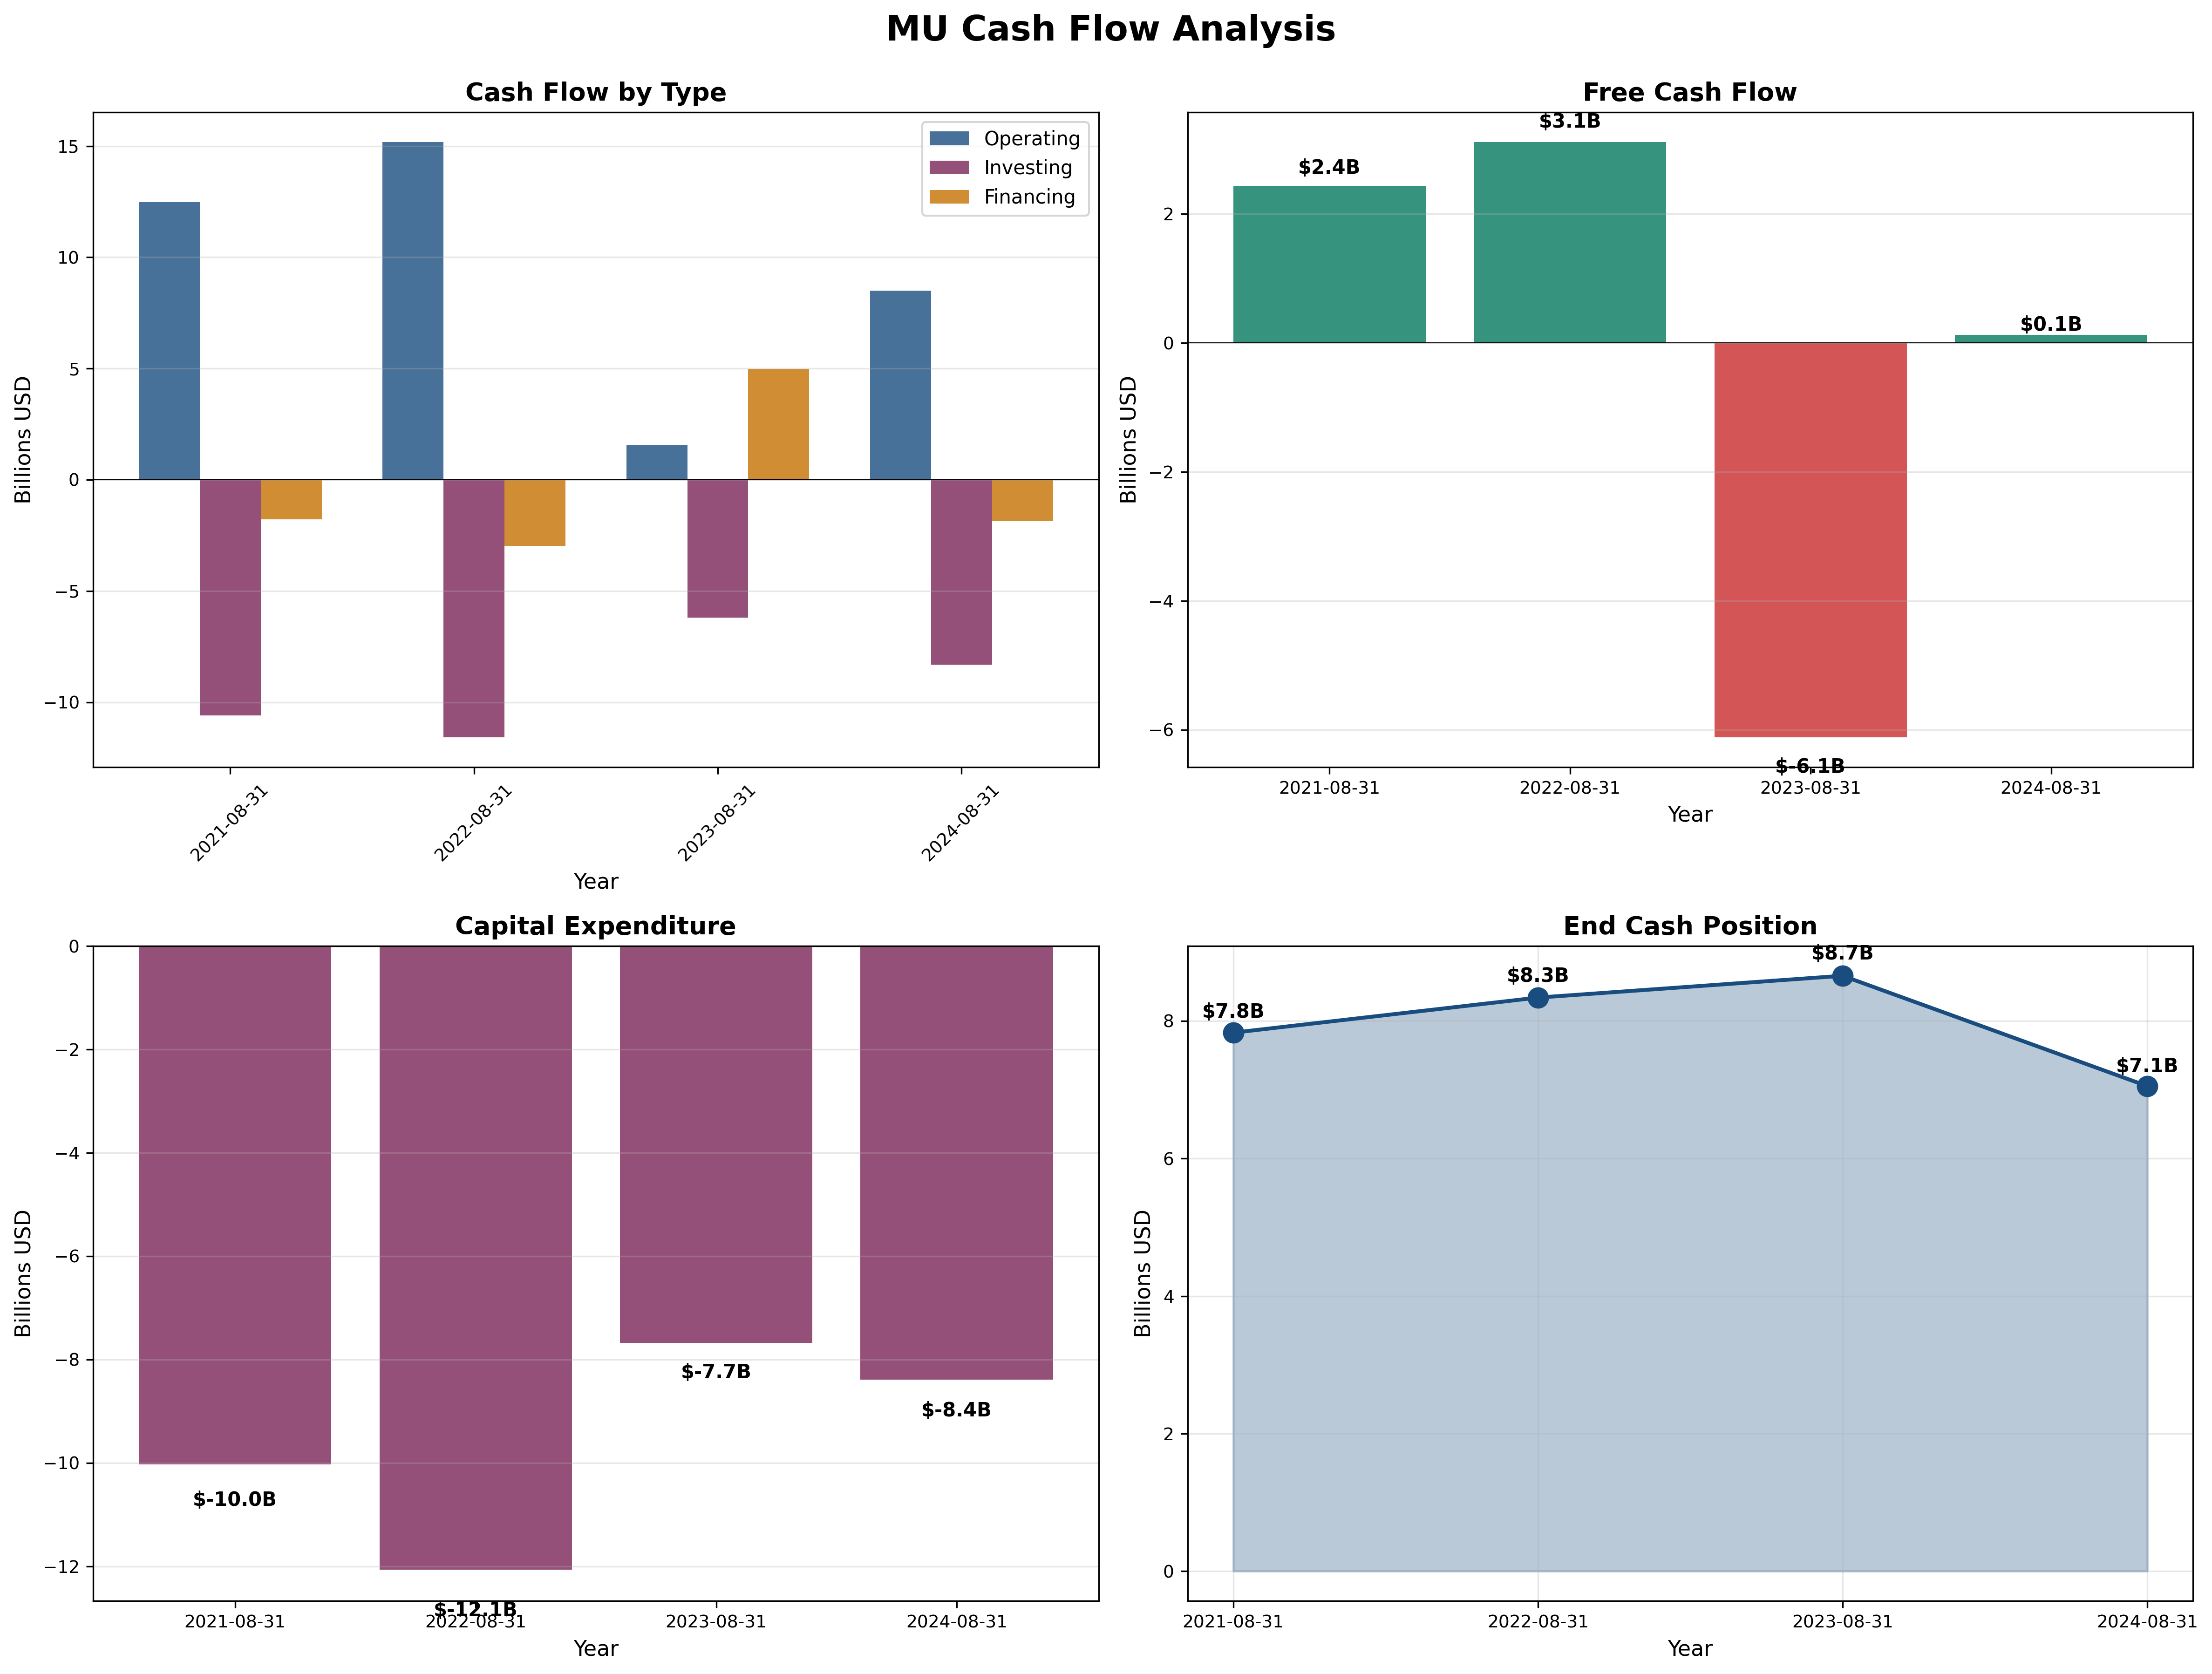
Cash Flow Generation
Key Metrics:
- OCF / Net Income: 10.4x (Operating CF $8.3B vs Net Income $0.8B)
- FCF Margin: 0.4% (nearly break-even)
- Capital Intensity: 33% of revenue ($8.4B capex / $25B revenue)
Assessment: Operating cash flow recovery is encouraging ($8.3B), but massive capex requirements ($8.4B annually) leave virtually no free cash flow. This is an extremely capital-intensive business requiring continuous $8-12B annual investments just to stay competitive. Can’t return cash to shareholders during growth periods—all cash goes to capex. Only generates meaningful FCF at peak cycle.
Profitability Metrics
Returns:
- ROE: 1.7% vs 15% target (recovering from -13%, peak was 17%) ❌
- ROIC: Estimated ~5% vs 12% target ❌
Assessment: Returns on capital are currently abysmal (1.7% ROE barely beats inflation). This reflects the massive equity base ($45B) generating minimal earnings ($0.8B). At peak cycle (2022), ROE was solid at 17%, proving the business can generate returns, but we’re nowhere near that now. Cyclical businesses at mid-cycle don’t generate acceptable returns.
Financial Ratios Analysis
Valuation Multiples:
- P/E: 22.4x (vs. historical range: negative to 136x, industry 15-25x)
- P/B: 4.03x (vs. historical avg: 1.5-2.0x)
- P/FCF: 1,804x (essentially infinite due to near-zero FCF)
- EV/EBITDA: ~15x (reasonable for semiconductors)
PEG Ratio:
- P/E Ratio: 22.4x
- Normalized Growth Rate: ~15-20% (cyclically adjusted)
- PEG: 1.21 (fair value, but misleading for cyclicals)
Combined Metric:
- P/E × P/B = 90.3 (should be < 22.5) ❌
Capital Allocation Assessment
Management Quality Grade: B
Key Factors:
- Insider Ownership: Low (~1-2%)
- Buyback Discipline: Poor timing historically (bought high in 2022, suspended during 2023 crisis)
- Reinvestment ROIC: 5-10% currently, 15-20% at peak
- Red Flags: No dividend despite $8.5B earnings in FY2025, all cash absorbed by capex
Assessment: Management has improved financial discipline (maintained fortress balance sheet through downturn) but capital allocation remains problematic. Massive capex commitments ($200B US investment) during recovery could prove poorly timed if another downcycle hits. No dividends mean shareholders only benefit from stock appreciation. Buybacks have been poorly timed. Compensation reasonable but lacks meaningful insider ownership.
Valuation & Intrinsic Value
Multiple Methods Summary:
| Method | Intrinsic Value | Weight | Notes |
|---|---|---|---|
| Normalized Earnings (P/E 10-12x) | $100-145 | 40% | Using normalized $12B earnings, conservative multiple |
| DCF Conservative (5-year) | $120-160 | 30% | 10% WACC, terminal growth 3% |
| Replacement Value | $180-220 | 10% | Book value plus strategic premium |
| Peak Cycle Value | $250-300 | 10% | FY2022-level profitability |
| Graham Formula | $85-110 | 10% | Using normalized EPS $8-10 |
Weighted Intrinsic Value: $140
Valuation Range:
- Bear Case (Down Cycle): $60-80 (1.5x book, negative earnings)
- Base Case (Normalized): $140-170 (15x normalized earnings)
- Bull Case (Peak AI Cycle): $250-300 (sustained premium margins)
Current Price: $223.77
Margin of Safety: -32% vs Base Case (OVERVALUED)
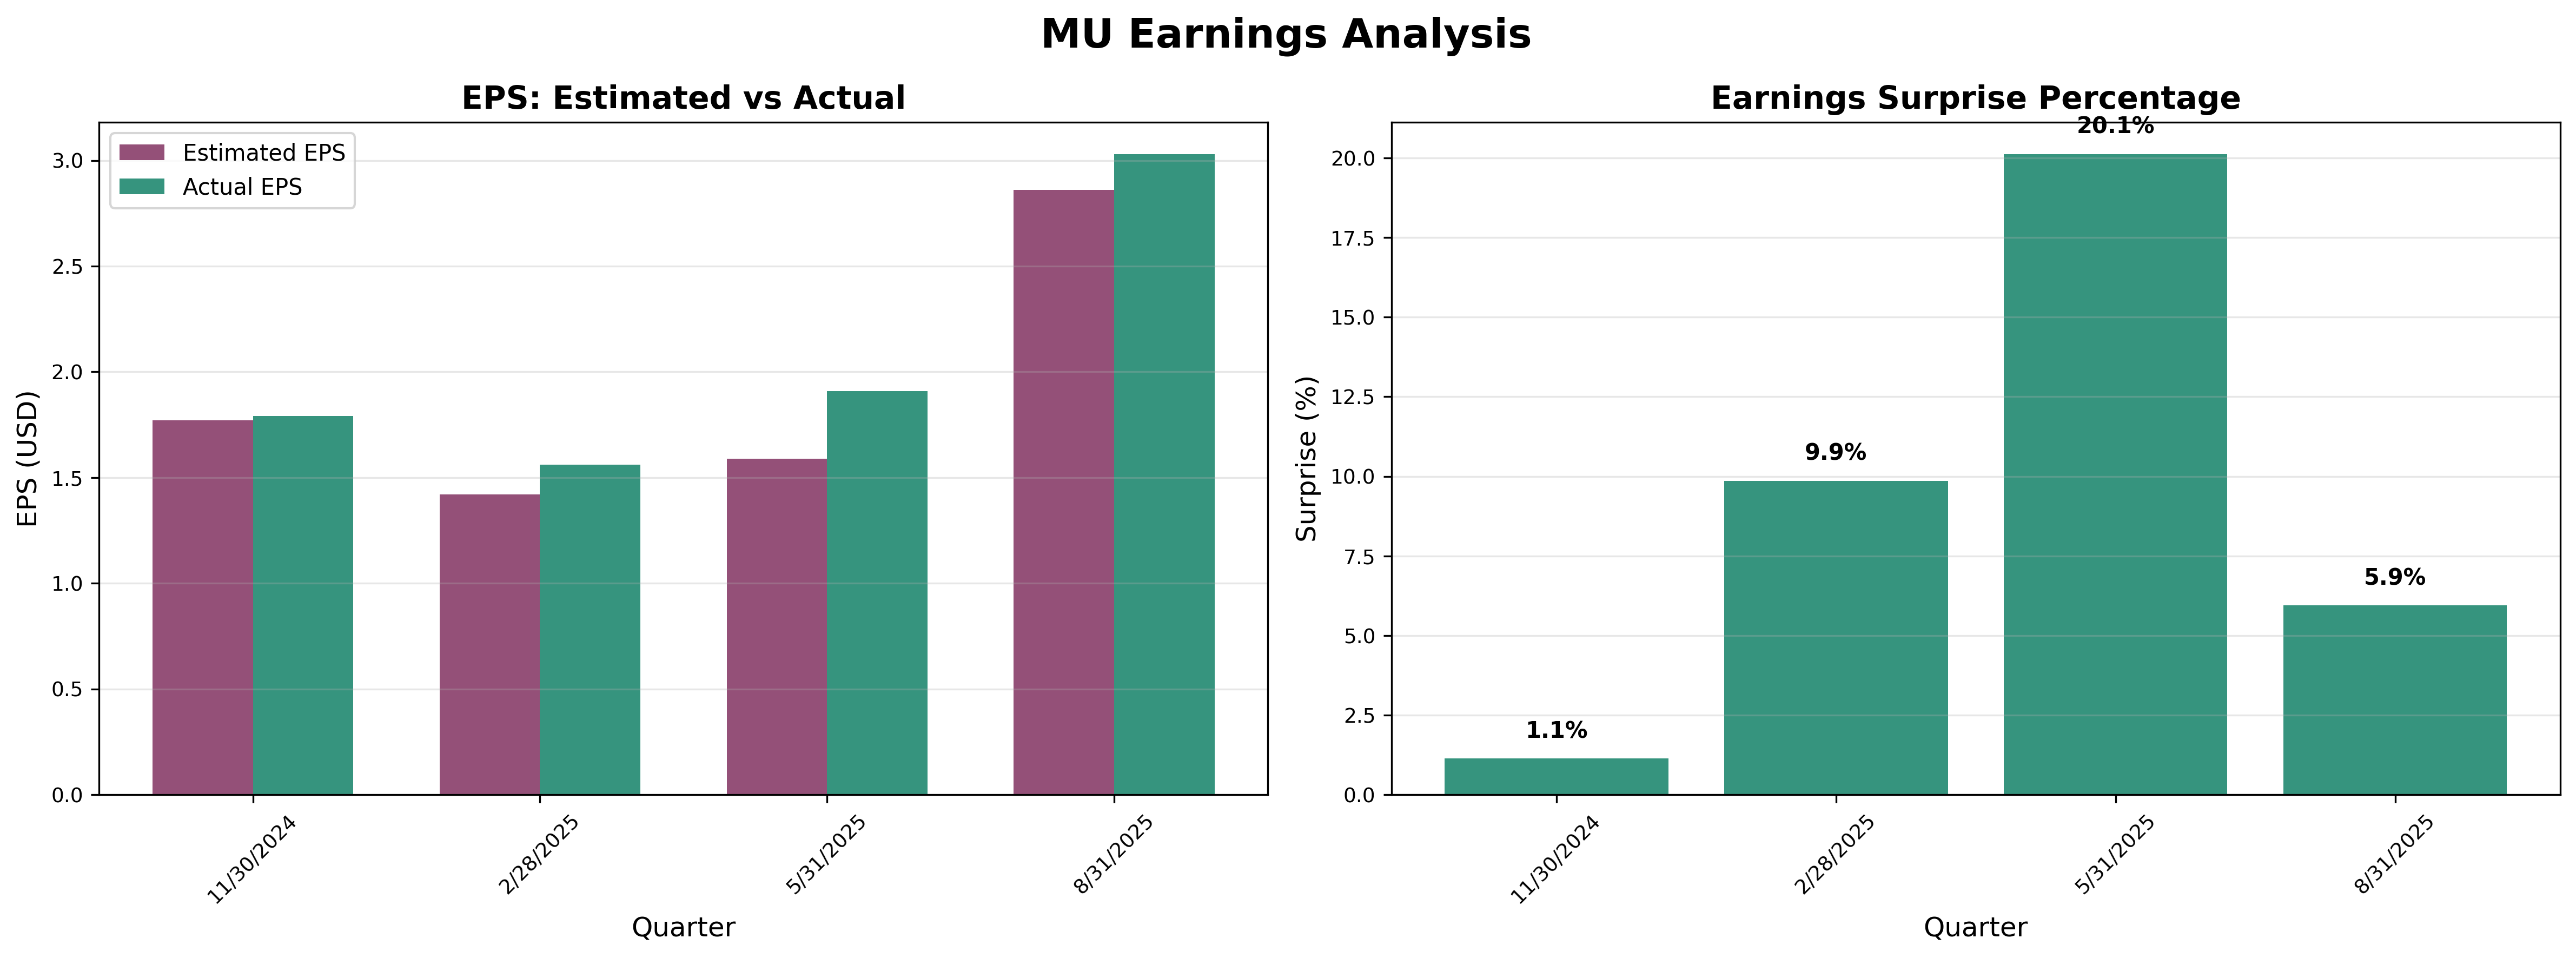
Critical Assessment: Stock is pricing in sustained peak-cycle profitability. FY2025 guidance suggests $8.54 EPS (997% growth) but this represents cyclical recovery, not sustainable earnings power. At $224, market applies 26x P/E to cyclical peak earnings—dangerous. Historical pattern shows memory cycles mean-revert every 3-4 years. Current valuation assumes “this time is different” due to AI, but memory remains commodity.
Risk Assessment
Key Risks (Top 3)
Cyclical Downturn Risk (CRITICAL): Memory markets historically crash every 3-4 years due to oversupply; stock could fall 60-70% in next downturn as margins collapse.
AI Hype Bubble Risk: Current valuation assumes sustained AI-driven HBM demand, but if AI capex slows (likely 2026-2027), memory prices could crater as they did in 2023.
Chinese Competition: China aggressively developing domestic memory production (YMTC, CXMT); could create structural oversupply by 2027-2030, permanently compressing margins.
Worst Case Scenario: Combination of AI spending pullback and Chinese oversupply creates 2023-style crash. Stock could fall to $60-80 (book value), stay there for 2-3 years with negative earnings. Unlike 2023 recovery, structural oversupply could mean permanently lower peak margins.
Market Sentiment
Current Sentiment: Optimism bordering on Euphoria (AI hype driving premium valuations)
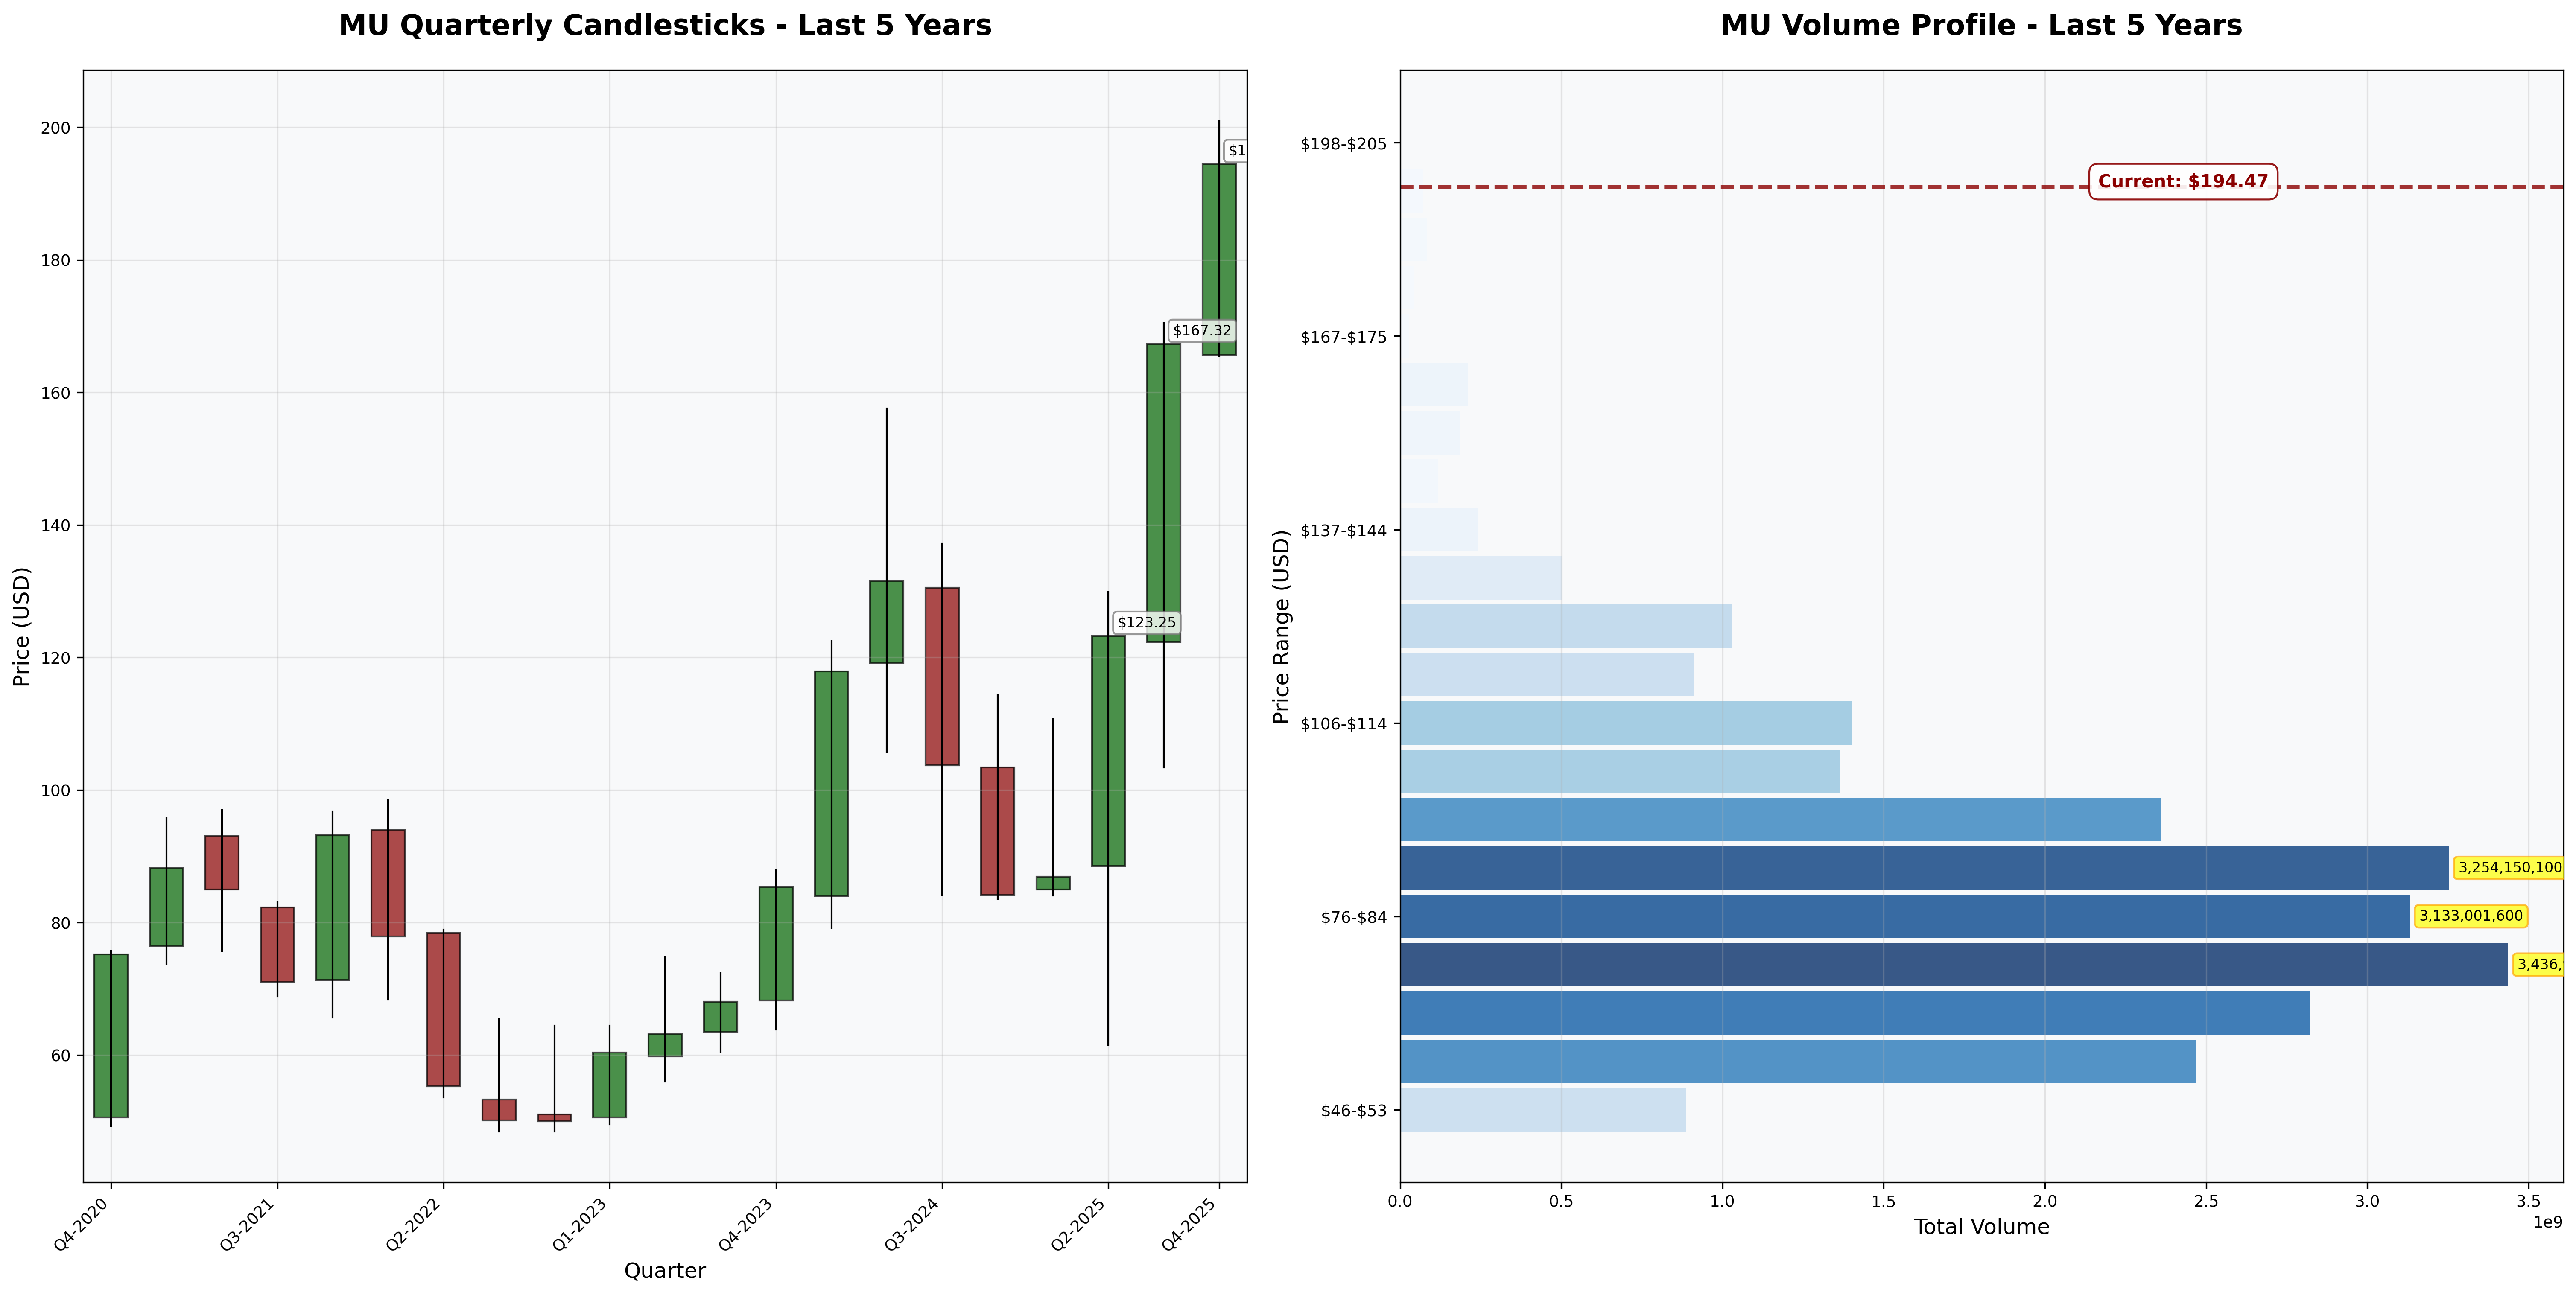
Contrarian Signal: This is NOT the time to buy. Stock has recovered from $46 (March 2023) to $224 (current)—a 387% move. HBM supply shortages have created “fear of missing out” mentality. Analyst consensus at $194 suggests even Street thinks it’s run too far. Classic late-cycle overvaluation when everyone is bullish on cyclicals.
Investment Recommendation
Current Assessment
Valuation: P/E = 22.4x | P/B = 4.03x | PEG = 1.21
Verdict: Significantly Overvalued (trading at 1.3-1.6x estimated fair value)
Margin of Safety: -32% (would need 32% decline to reach fair value) ❌
Entry Zones
| Zone | Price | Action | Margin of Safety |
|---|---|---|---|
| 🔴 Strong Sell | > $200 | Sell/Avoid | Negative |
| 🟠 Overvalued | $170-$200 | Avoid | < 10% |
| 🟡 Fair Value | $140-$170 | Wait | 10-20% |
| 🟢 Buy Zone | $100-$140 | Accumulate | 30-40% |
| 🟢 Strong Buy | < $100 | Aggressive Buy | 40%+ |
Current Price: $223.77 → Recommendation: STRONG AVOID / SELL
Expected Returns
- Bull Case (+25%): AI supercycle continues through 2027, sustained 40%+ gross margins, HBM premium pricing, target $280
- Base Case (-30%): Mean reversion to normalized valuation by 2026, cyclical plateau, target $150
- Bear Case (-65%): Memory oversupply returns by late 2025/2026, margin compression, next downturn, target $70-80
Risk/Reward Ratio: Terrible. 25% upside vs. 65% downside. Asymmetric risk to downside.
Final Investment Conclusion
Overall Grade: B (Good Business, Wrong Price)
Category Scores:
- Business Quality: 7/10 (oligopoly with moat, but commoditized)
- Financial Strength: 8/10 (fortress balance sheet, conservative debt)
- Management Quality: 6/10 (disciplined but poor capital allocation timing)
- Valuation: 2/10 (significantly overvalued, no margin of safety)
- Margin of Safety: 0/10 (negative margin, stock needs 30-40% decline)
Final Verdict: AVOID / SELL
Investment Thesis Summary
Business Quality: Micron operates in an oligopolistic industry with high barriers to entry and is currently benefiting from the AI-driven memory boom. The company demonstrates technological leadership in HBM4 and maintains a fortress balance sheet that allowed survival through 2023’s brutal downturn. The memory chip business is essential to computing infrastructure and will remain relevant for decades.
Valuation Problem: However, at $224, the stock prices in perfection. The market is applying a 22x P/E multiple to what are likely peak-cycle earnings in a notoriously cyclical business. Historical patterns show memory cycles crash every 3-4 years—we’re currently 2 years into recovery. The P/B ratio of 4x is double the historical average, and the P/E × P/B of 90 fails Graham’s 22.5 test by 4x. With effectively zero free cash flow due to massive capex requirements, shareholders are paying $224 for $0.80 of earnings that could easily turn negative in 18-24 months.
Cyclicality Risk: Memory is commodity. Despite AI hype, DRAM and NAND pricing follows supply/demand dynamics. When Chinese production scales up (2026-2028) and AI capex inevitably moderates, oversupply will return. The 2023 downturn (gross margins went negative!) demonstrated how quickly this business can deteriorate. Current valuation assumes sustained peak margins—historically naive for commodity semiconductors.
The Contrarian Reality: Everyone bullish on memory right now is fighting the last war. “AI will be different” is this cycle’s version of “this time is different.” It never is. The time to buy Micron was March 2023 at $46 when everyone was apocalyptic. Now, with analysts setting $194 targets while the stock trades at $224, with HBM hype everywhere, with 387% gains in 20 months—this is precisely when value investors should be selling, not buying.
Framework Checklist
- ❌ Quantitative: No margin of safety—stock significantly overvalued, fails 7/9 Graham criteria
- ✅ Moat: Moderate moat from oligopoly structure and scale advantages
- ⚠️ Management: Decent on balance sheet discipline, poor on capital allocation timing
- ❌ Contrarian: This is maximum optimism territory, not maximum pessimism opportunity
- ✅ Simplicity: Business model is simple (make memory chips, sell to device makers)
Would I hold this for 10+ years if the market closed tomorrow?
No. At current valuation, I’d be locked into a cyclical commodity business trading at 4x book value with zero free cash flow, knowing that 2-3 major downturns are statistically likely over 10 years. Each downturn will see 60-70% drawdowns and extended periods of negative earnings. Even if the business survives (likely given balance sheet), the opportunity cost of capital is enormous.
Investment Discipline: Wait for the next downcycle (it’s coming—it always does). When MU trades at 1.2-1.5x book value ($50-70), when margins are negative, when analysts downgrade, when media writes “memory industry dead”—that’s when you back up the truck. Not today at 4x book with everyone euphoric about AI. Patience is the value investor’s greatest weapon.
Price Target for Entry: $100-120 (40% decline from current levels, 2.0-2.5x book value)