Executive Summary
Investment Thesis: NextEra Energy operates the world’s largest renewable energy portfolio while owning Florida Power & Light (FPL), America’s most efficient regulated utility. The company generates stable earnings from regulated operations while capturing renewable energy growth through NextEra Energy Resources. However, valuation at 26x P/E with 8% ROE, deteriorating free cash flow conversion, and $82B debt load (1.64x equity) create limited margin of safety despite the quality franchise.
Business Classification: Stalwart (regulated utility with growth component)
Current Valuation Assessment:
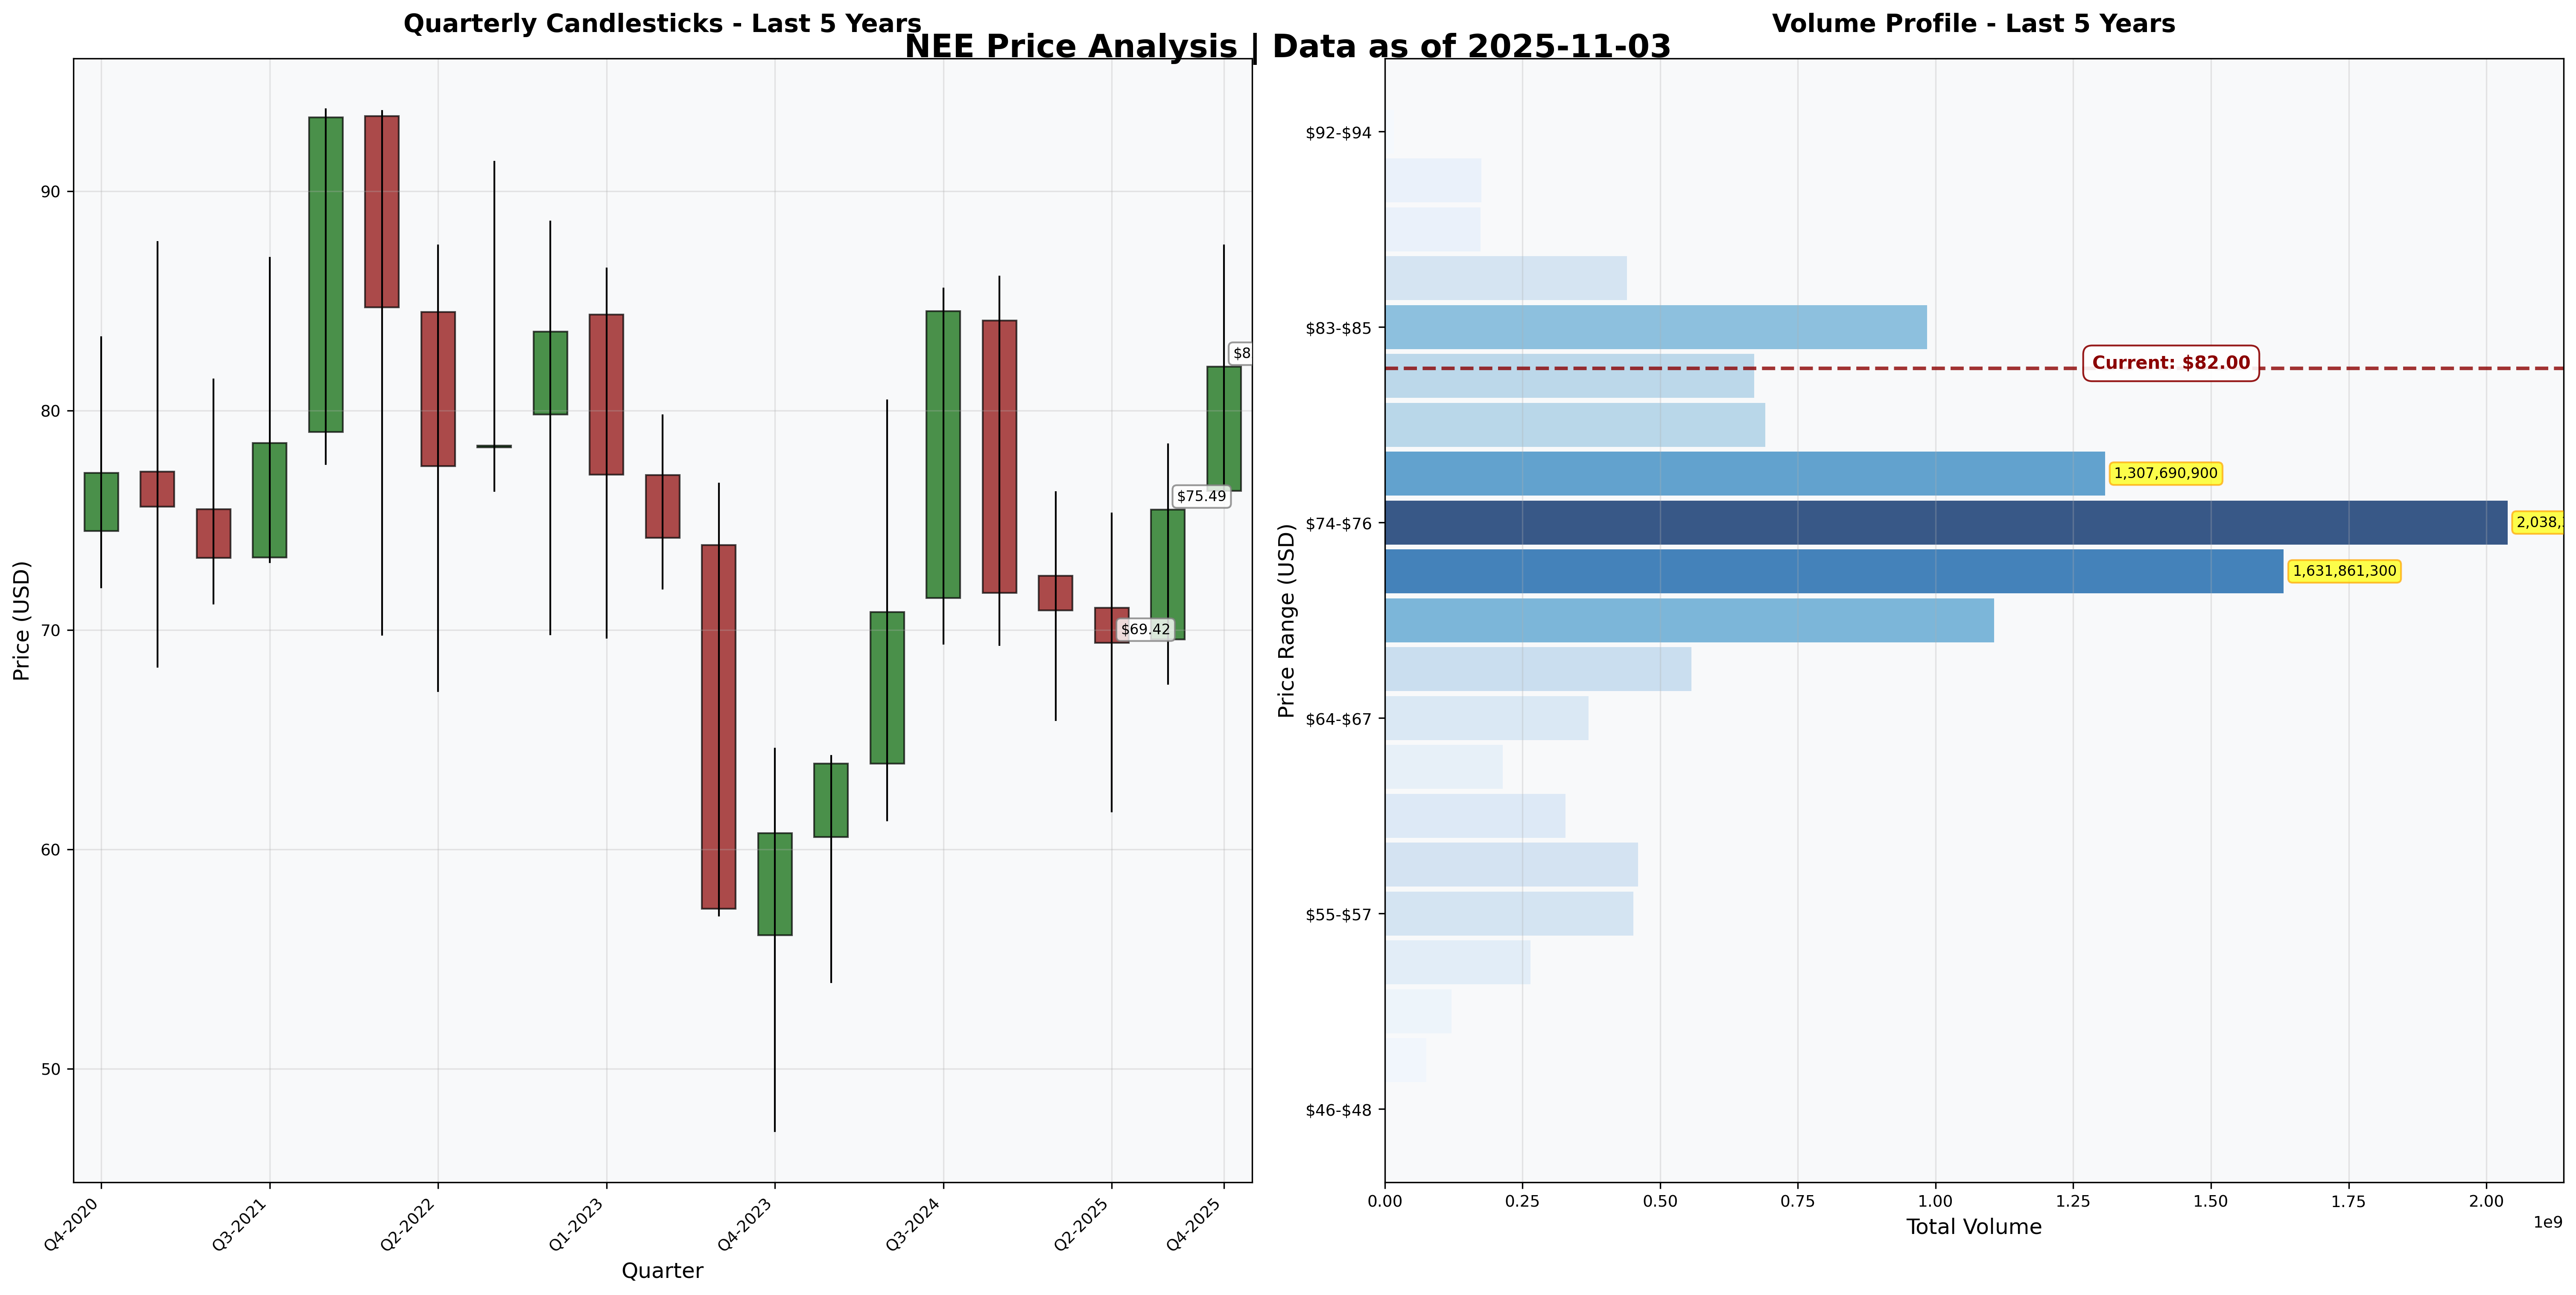
- Current Price: $82.00
- Estimated Intrinsic Value: $70 - $85
- Margin of Safety: 2.4% (insufficient)
- Recommendation: HOLD / WAIT FOR BETTER ENTRY
Recommended Entry Zones:
- 🟢 Strong Buy: < $59 (30%+ margin)
- 🟡 Buy: $59 - $66 (20-30% margin)
- 🟠 Hold: $70 - $85 (fair value)
- 🔴 Avoid: > $85 (overvalued)
Business Overview
What They Do (2-Minute Test)
NextEra Energy owns two businesses: Florida Power & Light (FPL) serves 12 million people with reliable electricity in Florida through regulated monopoly, and NextEra Energy Resources builds and operates wind and solar farms selling renewable power under long-term contracts. The regulated utility provides stable earnings (~60% of profits), while the renewables division captures clean energy growth (~40% of profits). They’re the world’s largest renewable energy generator, making money from both guaranteed utility returns and the secular shift to clean power.
Competitive Position & Moat Analysis
Primary Moat Type: Efficient Scale (Regulated Monopoly) + Cost Advantages
Moat Strength: ⭐⭐⭐⭐☆ (4 out of 5)
Key Moat Factors:
- Regulated monopoly: FPL holds exclusive franchise in Florida—customers cannot switch, providing guaranteed returns on invested capital
- Scale advantages: World’s largest renewable generator with 30+ GW capacity creates procurement leverage and operational efficiencies
- Low-cost producer: FPL ranks #1 in efficiency among U.S. utilities; renewables achieve grid parity making them cost-competitive
- Long-term contracts: 20-30 year power purchase agreements lock in predictable cash flows from renewables
Moat Durability:
- Widening: Renewable energy mandates expanding, scale advantages increasing, FPL service territory growing with Florida population
- Key Threat: Distributed solar and battery storage could disrupt centralized utility model in 15-20 years; regulatory risk from adverse rate decisions
Industry Dynamics
50-Year Outlook: Electricity demand is fundamental and growing (EVs, AI data centers). Regulated utilities will exist but face disruption from distributed generation. Winners will be low-cost, well-regulated operators serving growth markets. Florida’s population growth supports long-term FPL demand.
Key Trends: Clean energy mandates accelerating renewable buildout. Interest rate sensitivity for capital-intensive utilities. Grid modernization spending increasing. Battery storage becoming economically viable, threatening peak power economics.
Quantitative Checklist
Defensive Investor Criteria:
| Criterion | Requirement | Actual | Pass/Fail |
|---|---|---|---|
| Earnings Stability | Positive 10 years | 10/10 years | ✅ |
| Dividend Record | Some payment | $1.87/share | ✅ |
| Earnings Growth | +33% in 10 years | +94% | ✅ |
| P/E Ratio | < 15x | 26.0x | ❌ |
| P/B Ratio | < 1.5x | 3.15x | ❌ |
| P/E × P/B | < 22.5 | 81.9 | ❌ |
| Current Ratio | > 2.0 | 0.55x | ❌ |
| Debt vs NCA | Debt < NCA | $82B vs -$13B | ❌ |
Quantitative Score: 3/9 criteria met
Analysis: NEE passes operational quality tests (stability, growth, dividends) but catastrophically fails balance sheet and valuation tests. Current ratio of 0.55x is typical for utilities but concerning nonetheless. P/E of 26x is expensive for a utility with 8% ROE. The combination of premium valuation and weak balance sheet offers no margin of safety. This fails Graham’s defensive investor standard.
Financial Analysis with Critical Assessment
Balance Sheet Strength
Key Metrics:
- Current Ratio: 0.55 (target > 2.0) ❌ Poor but typical for utilities
- Debt-to-Equity: 1.64 (target < 0.5) ❌ Heavily leveraged
- Interest Coverage: ~14x EBIT/Interest ✅ Adequate
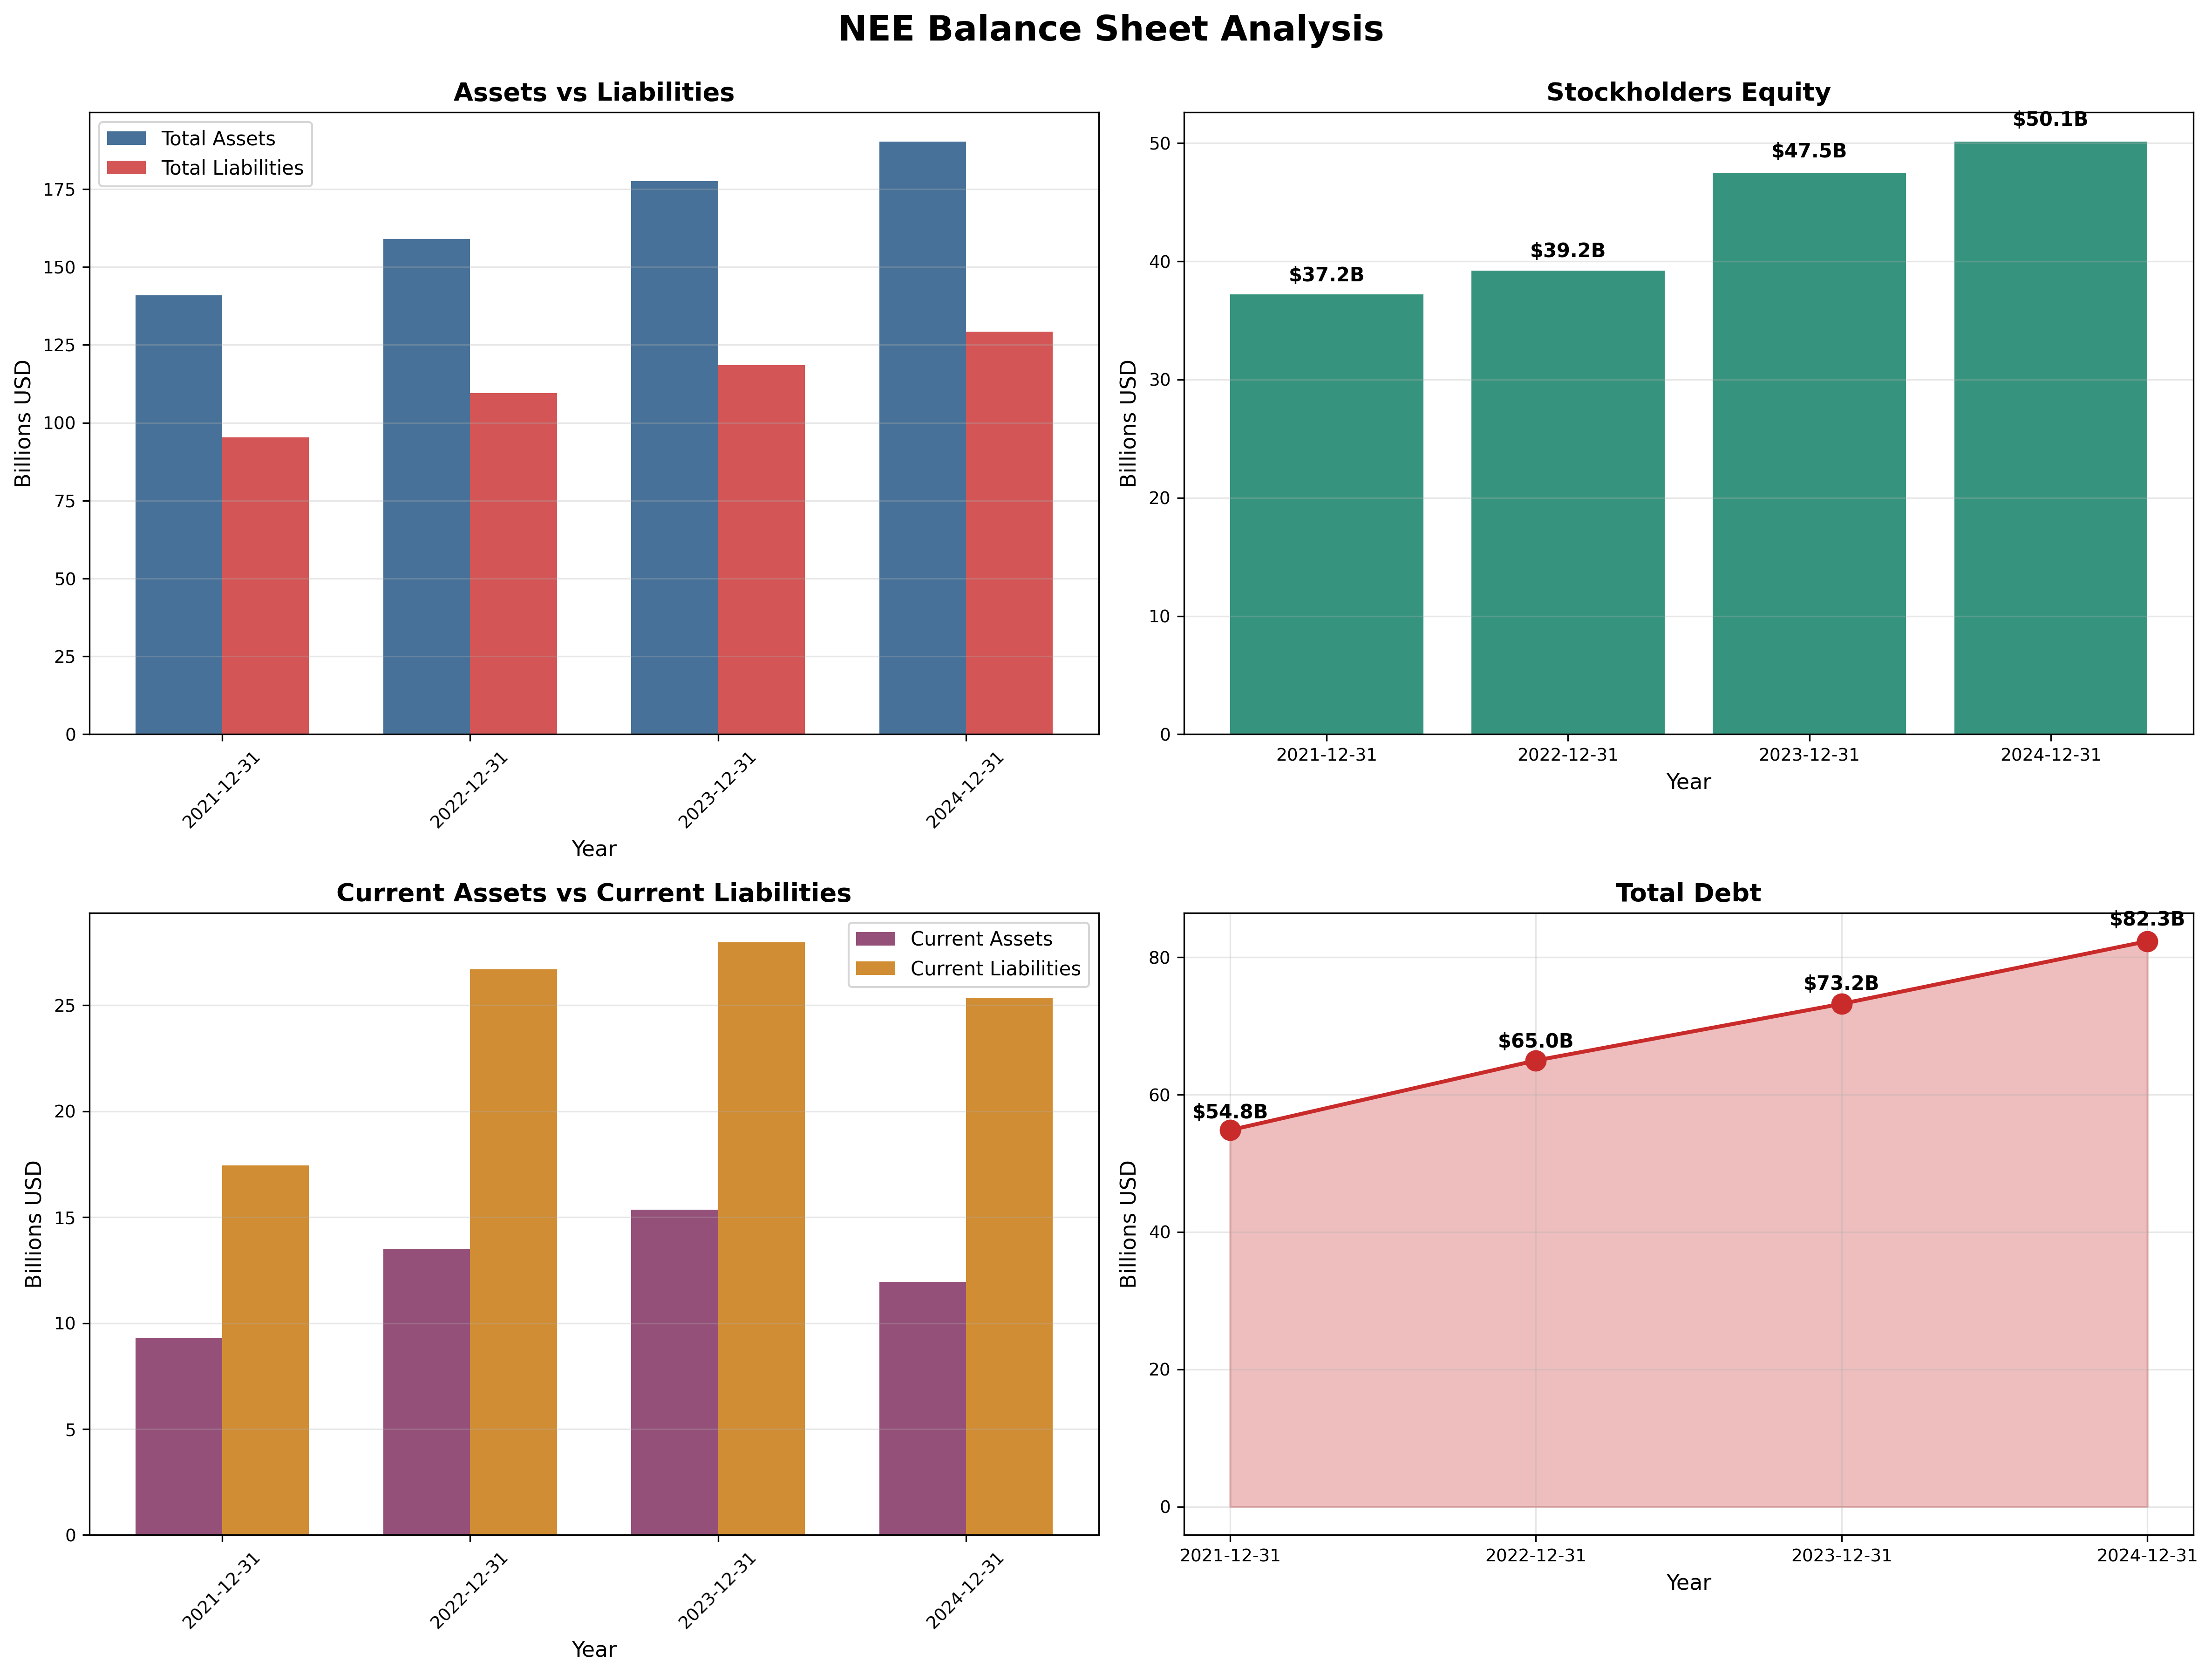
- Cash: $1.4B vs $82.3B total debt
Assessment: NEE’s balance sheet is weak by Graham standards but acceptable for a regulated utility. The $82B debt load (up 50% from $55B in 2021) finances capital-intensive infrastructure. Interest coverage of 14x provides cushion, but refinancing risk exists if rates stay elevated. Current ratio of 0.55x means NEE relies on operating cash flow and capital markets access—any disruption to either is catastrophic. Not a fortress balance sheet.
Earnings Quality & Consistency
Stability Test: Positive earnings in 10/10 of past 10 years ✅
Owner Earnings Calculation (2024):
Net Income:                 $7.0B
+ Depreciation:             ~$5.5B
+ Other non-cash:           ~$1.0B
- Maintenance Capex:        ($4.5B)
- Growth Capex:             ($4.0B)
- Working Capital:          ($0.5B)
= Owner Earnings:           $4.5B
Owner Earnings per Share: ~$2.29/share Owner Earnings Yield: $2.29 ÷ $82 = 2.8% (far below 10% target, indicating severe overvaluation)
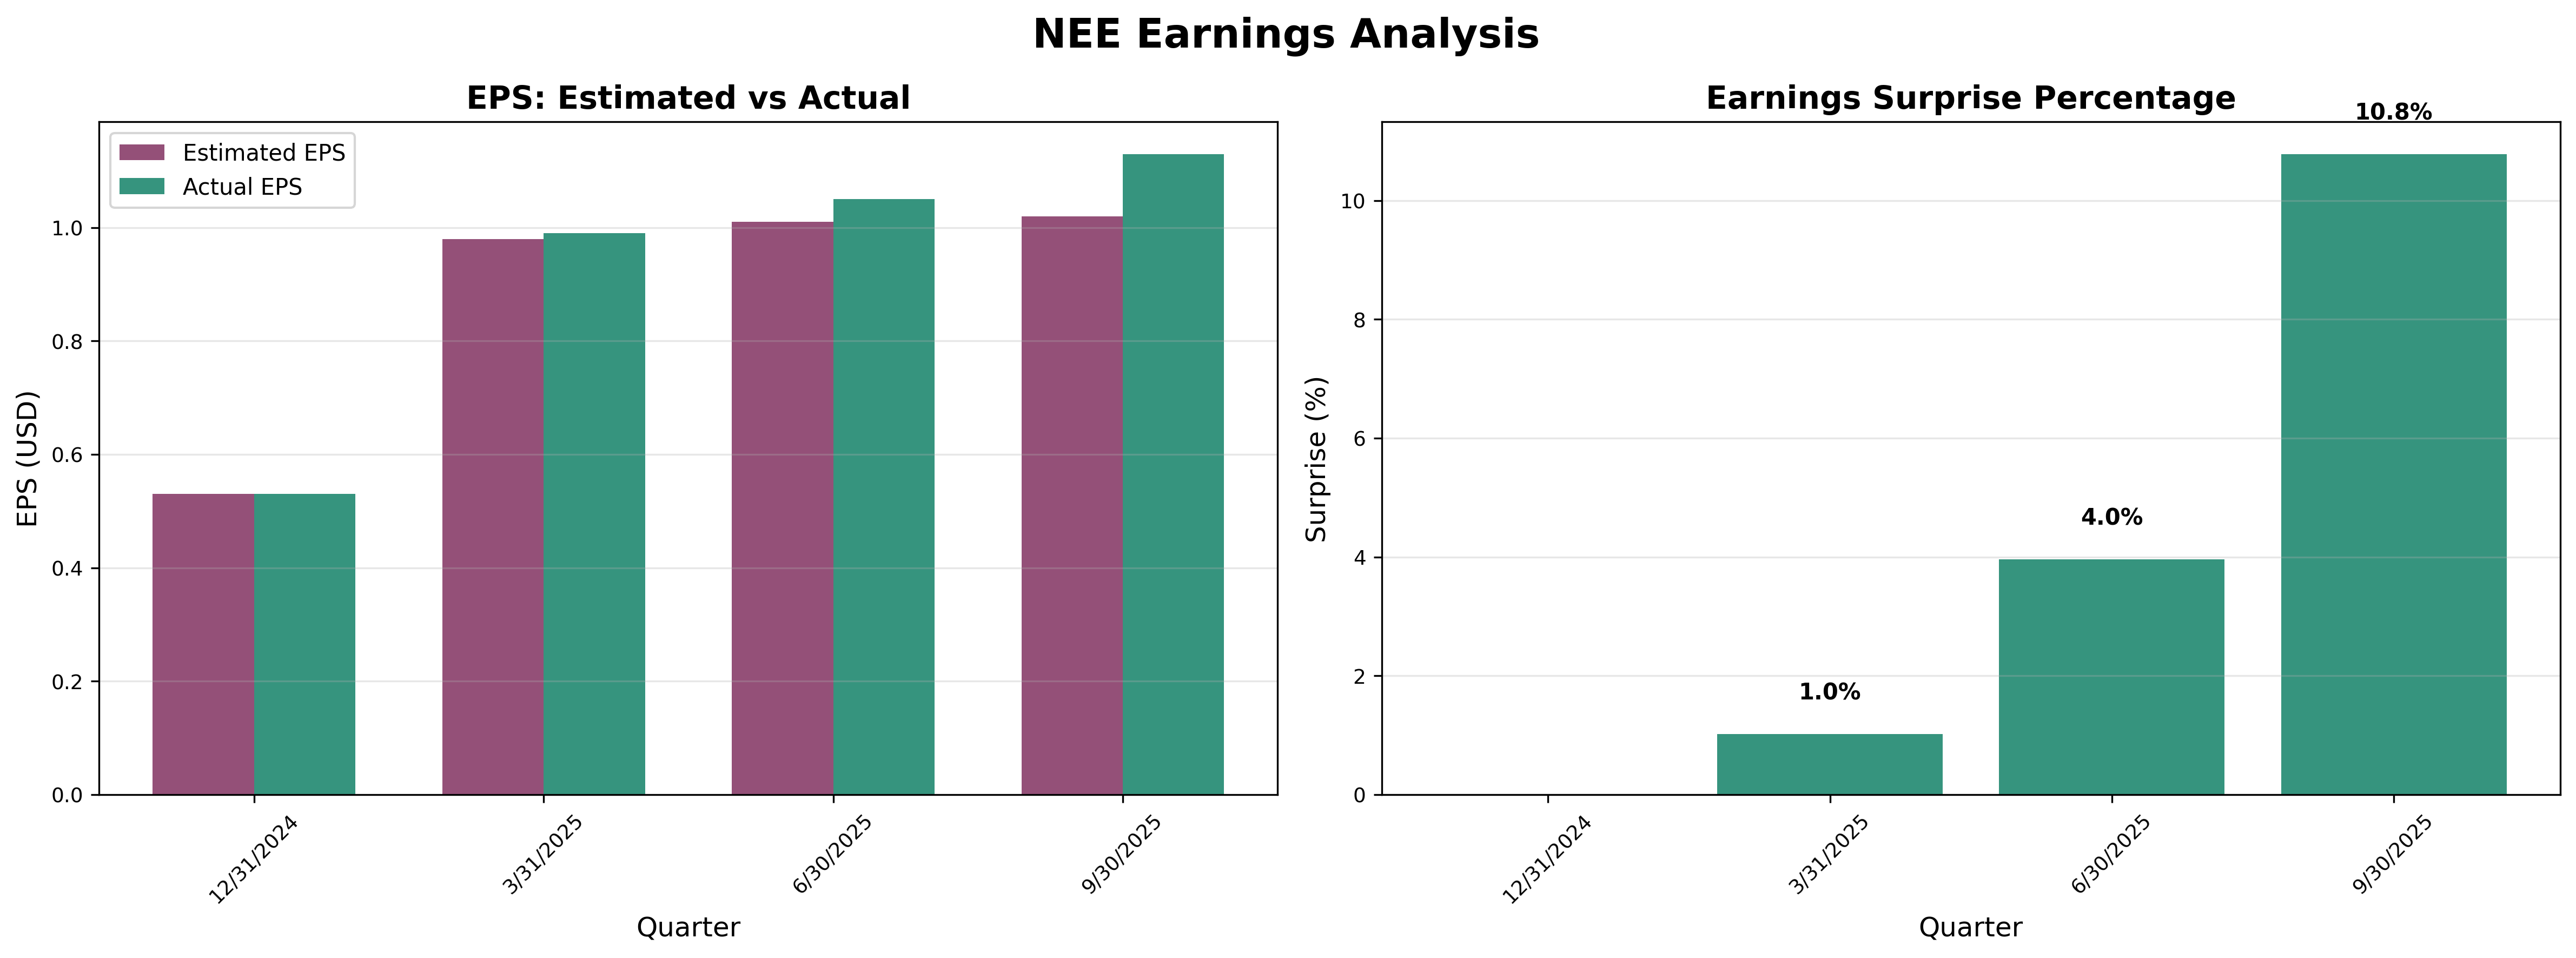
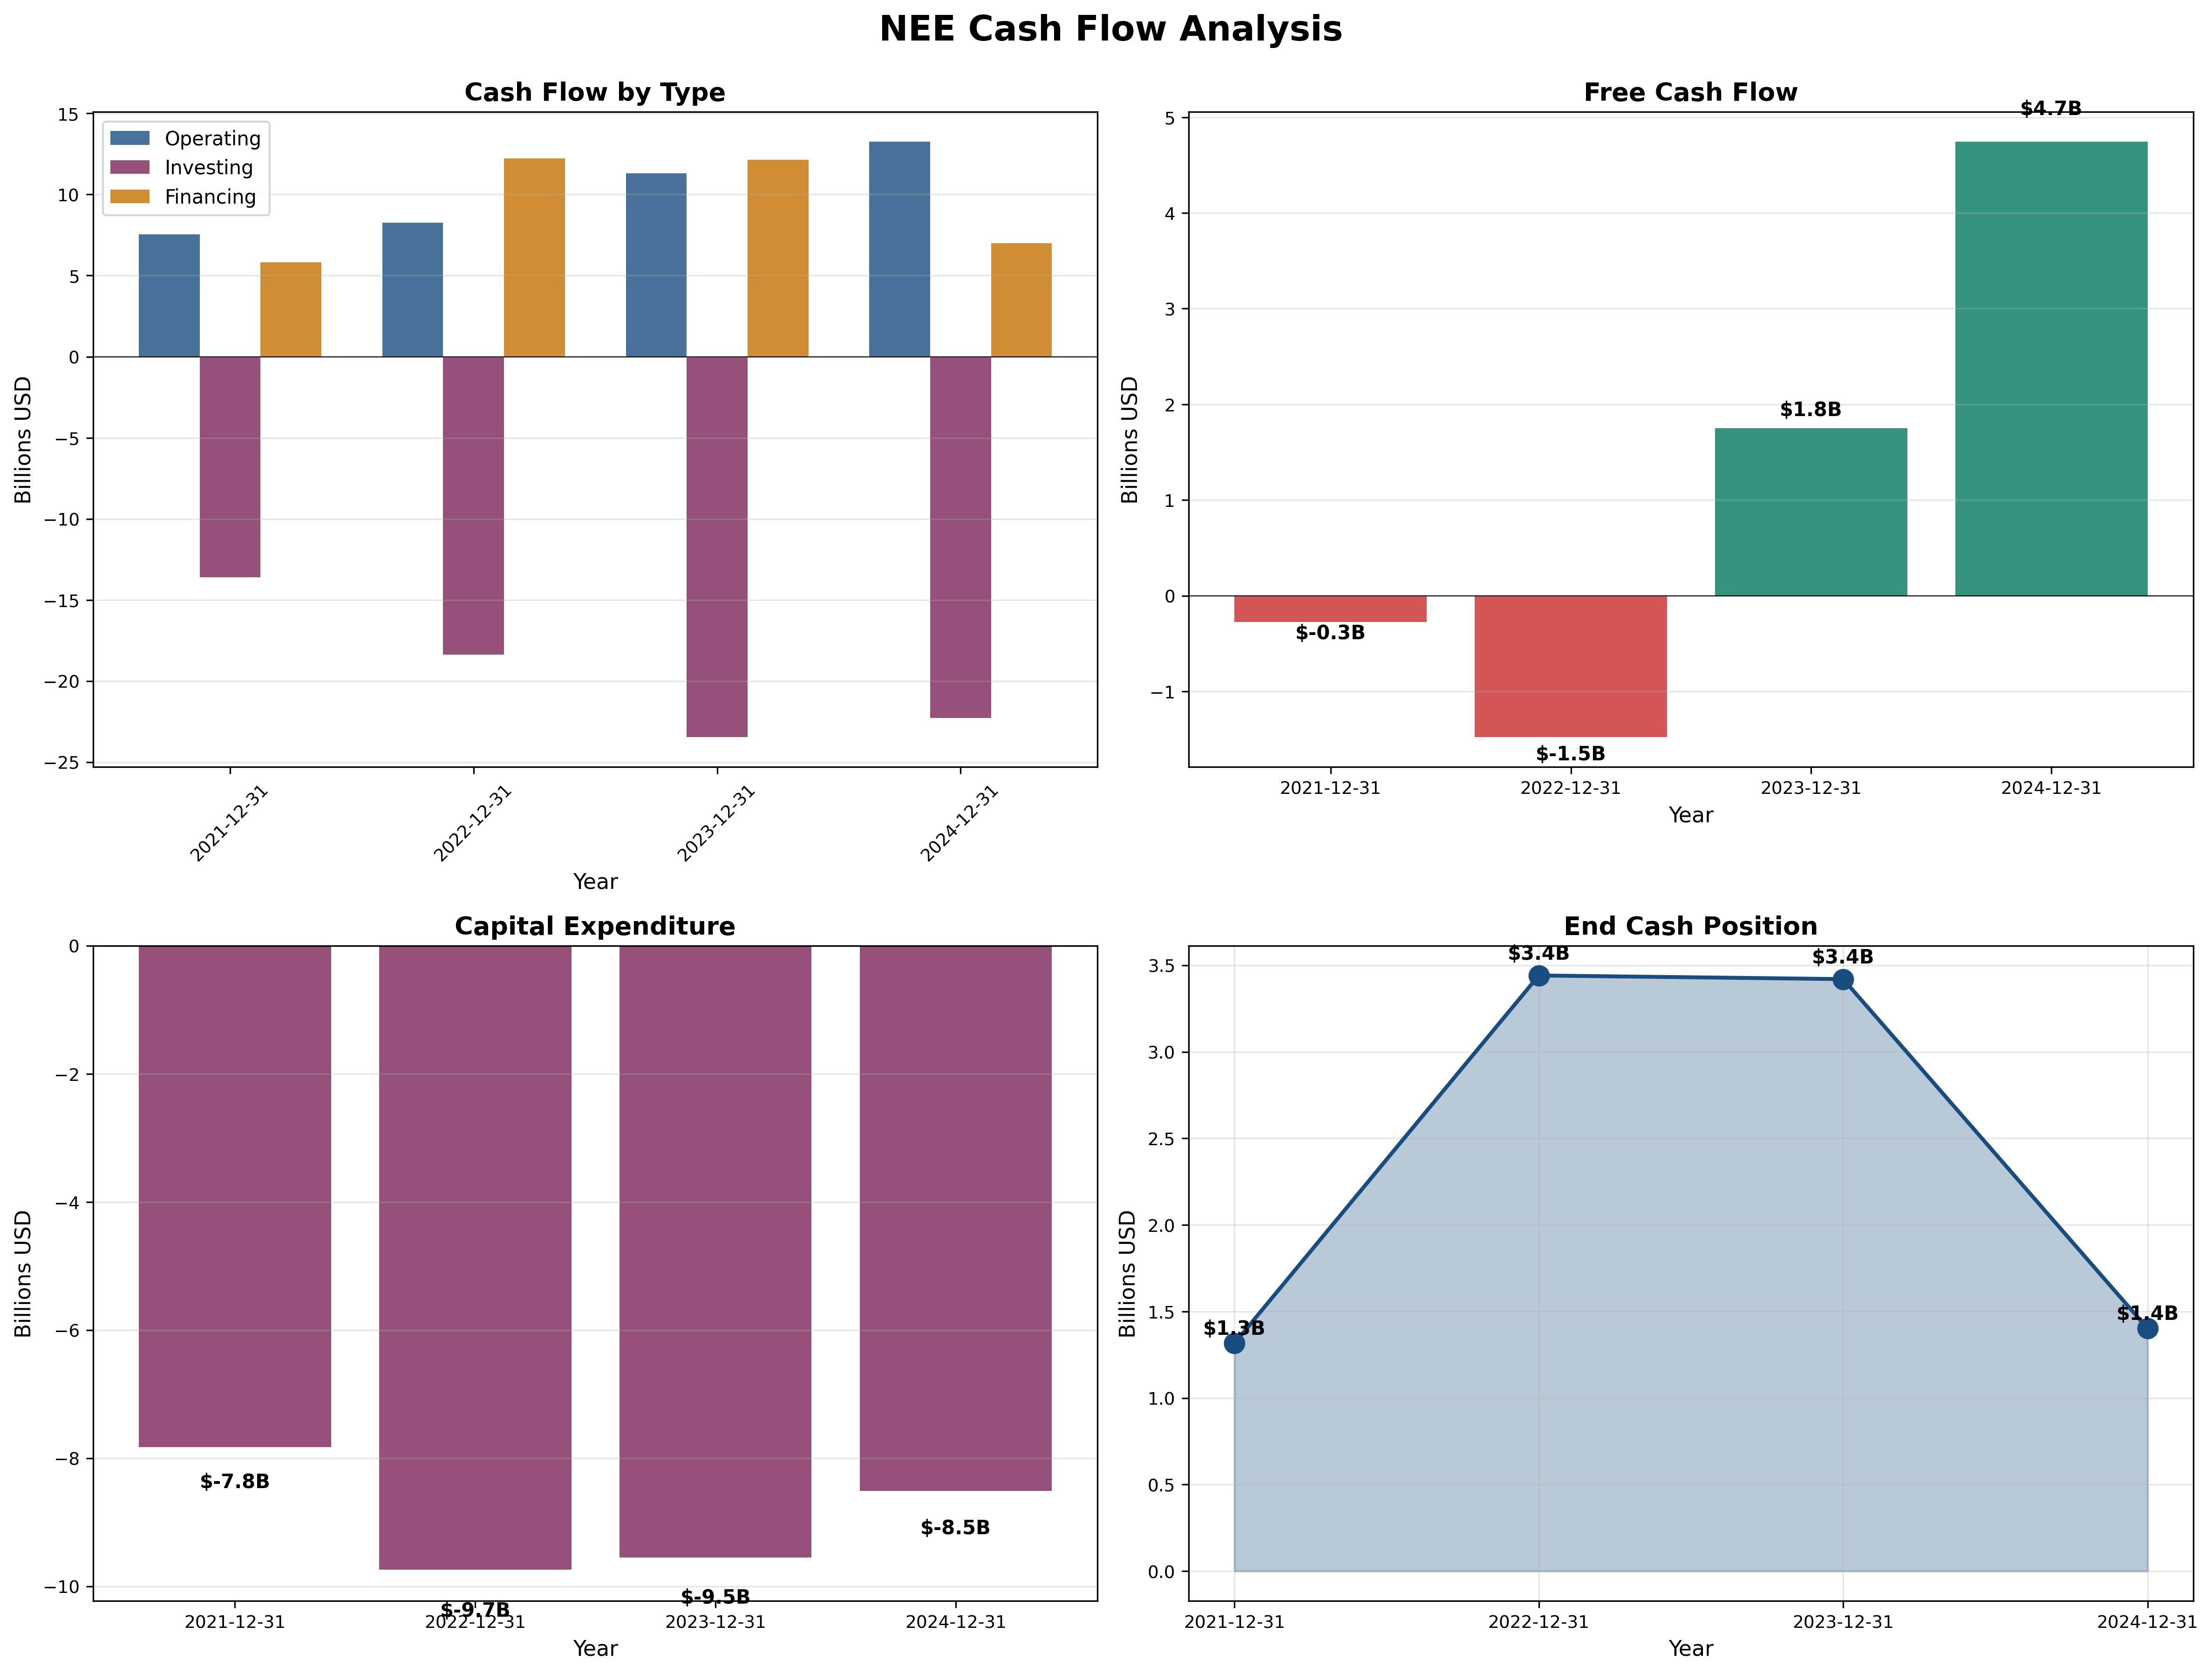
Quality Assessment: Earnings are highly predictable from regulated operations but cash flow conversion is deteriorating. OCF of $13B minus $8.5B capex leaves just $4.7B FCF (36% FCF margin, down from breakeven in 2021-2022). The business requires continuous reinvestment—no “maintenance-only” scenario exists. Quarterly earnings show consistent 1-11% beats, indicating conservative guidance.
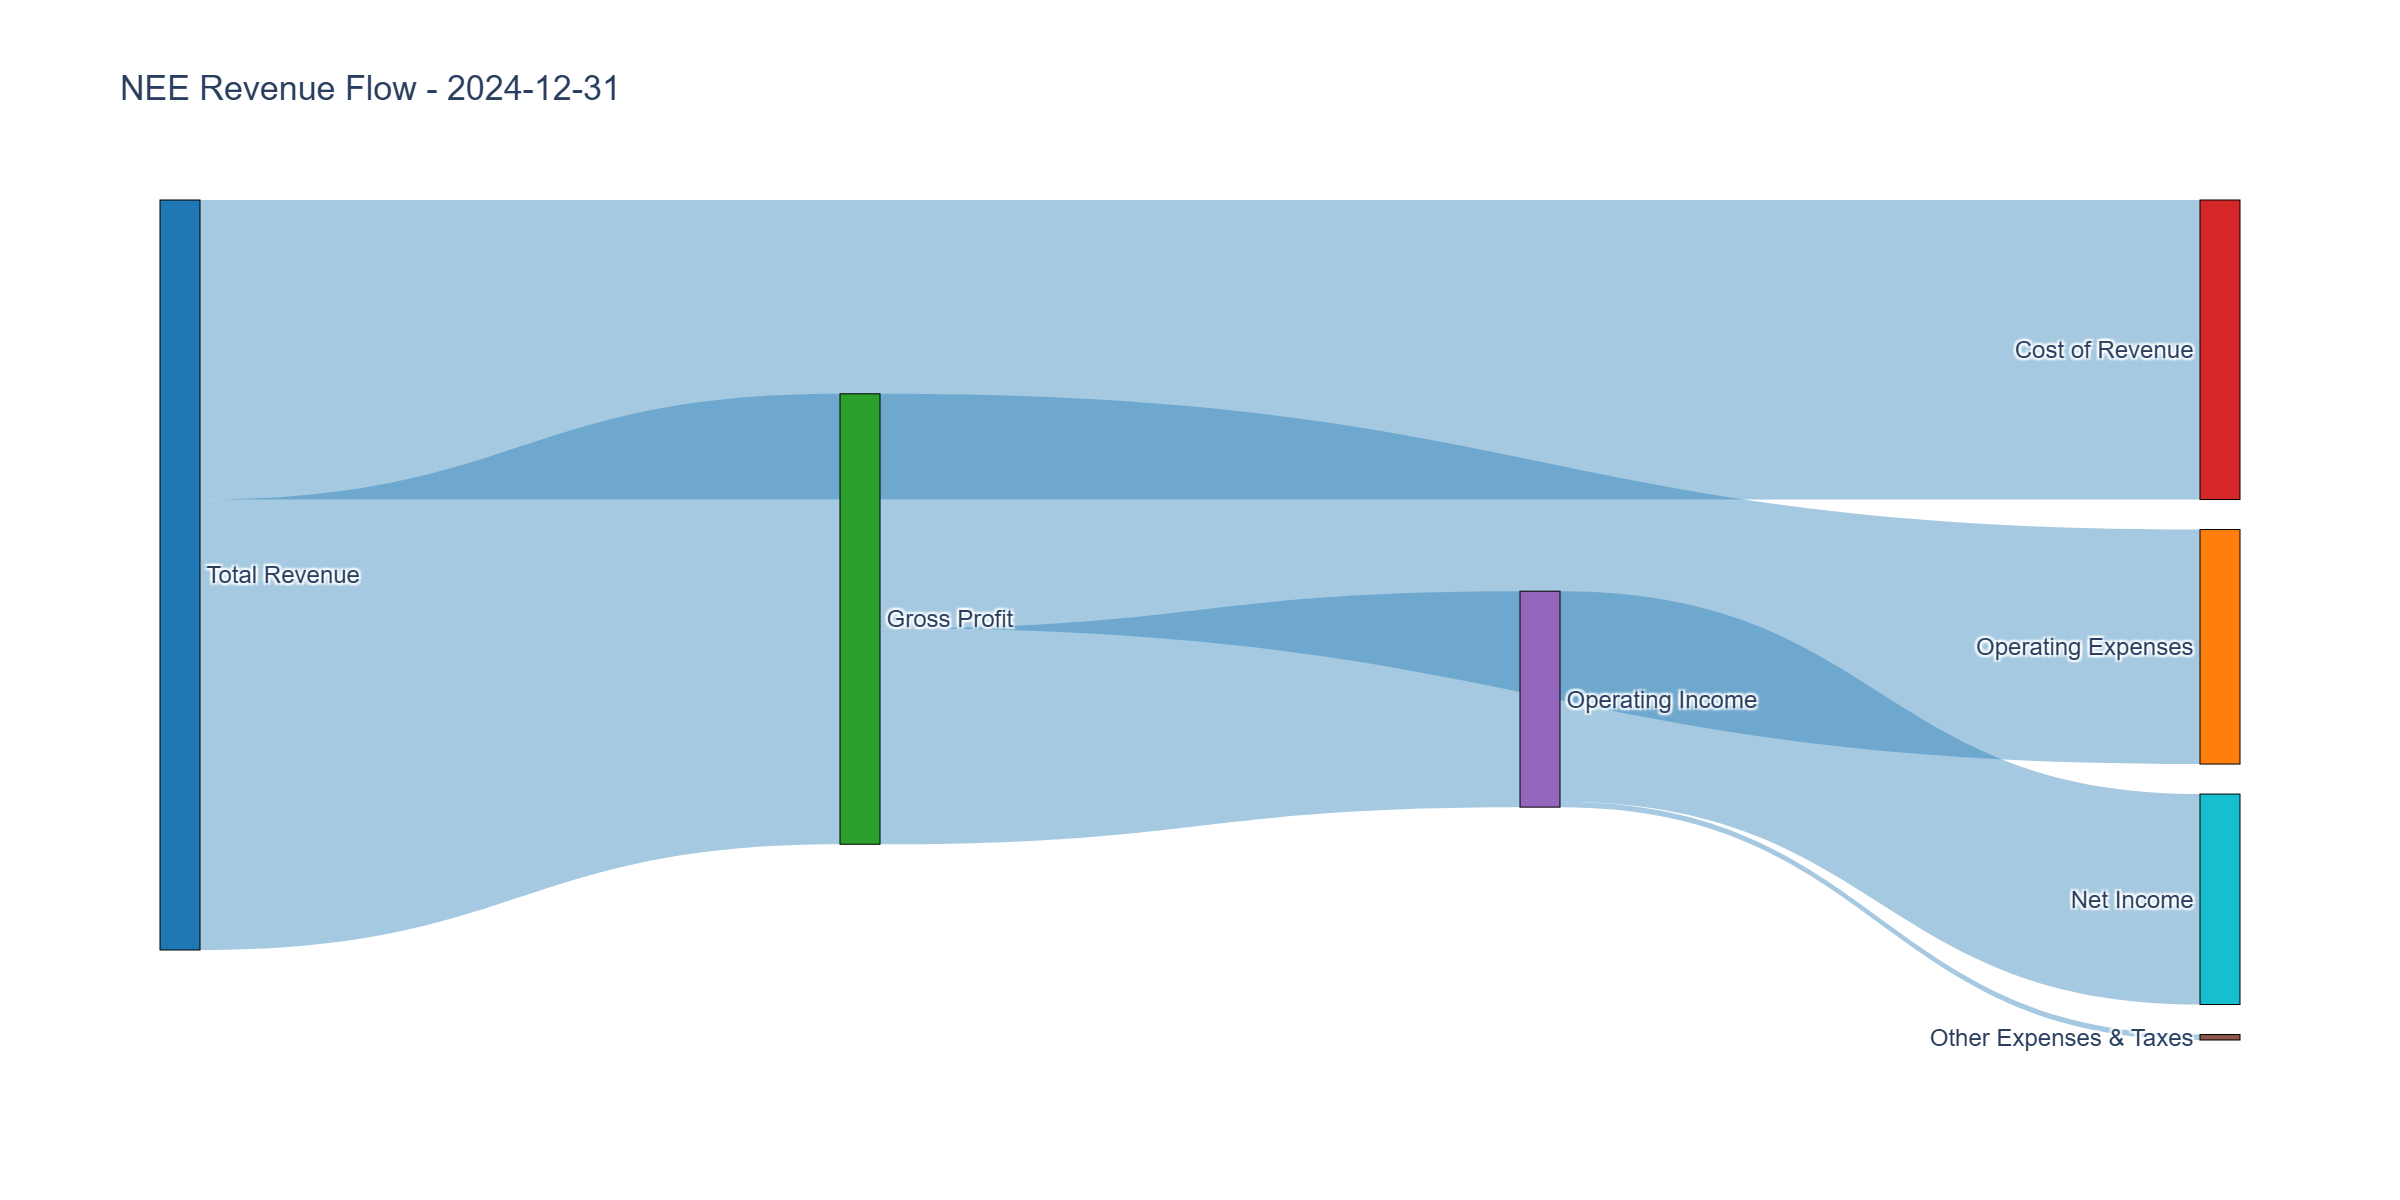
Income Statement Analysis
Key Metrics:
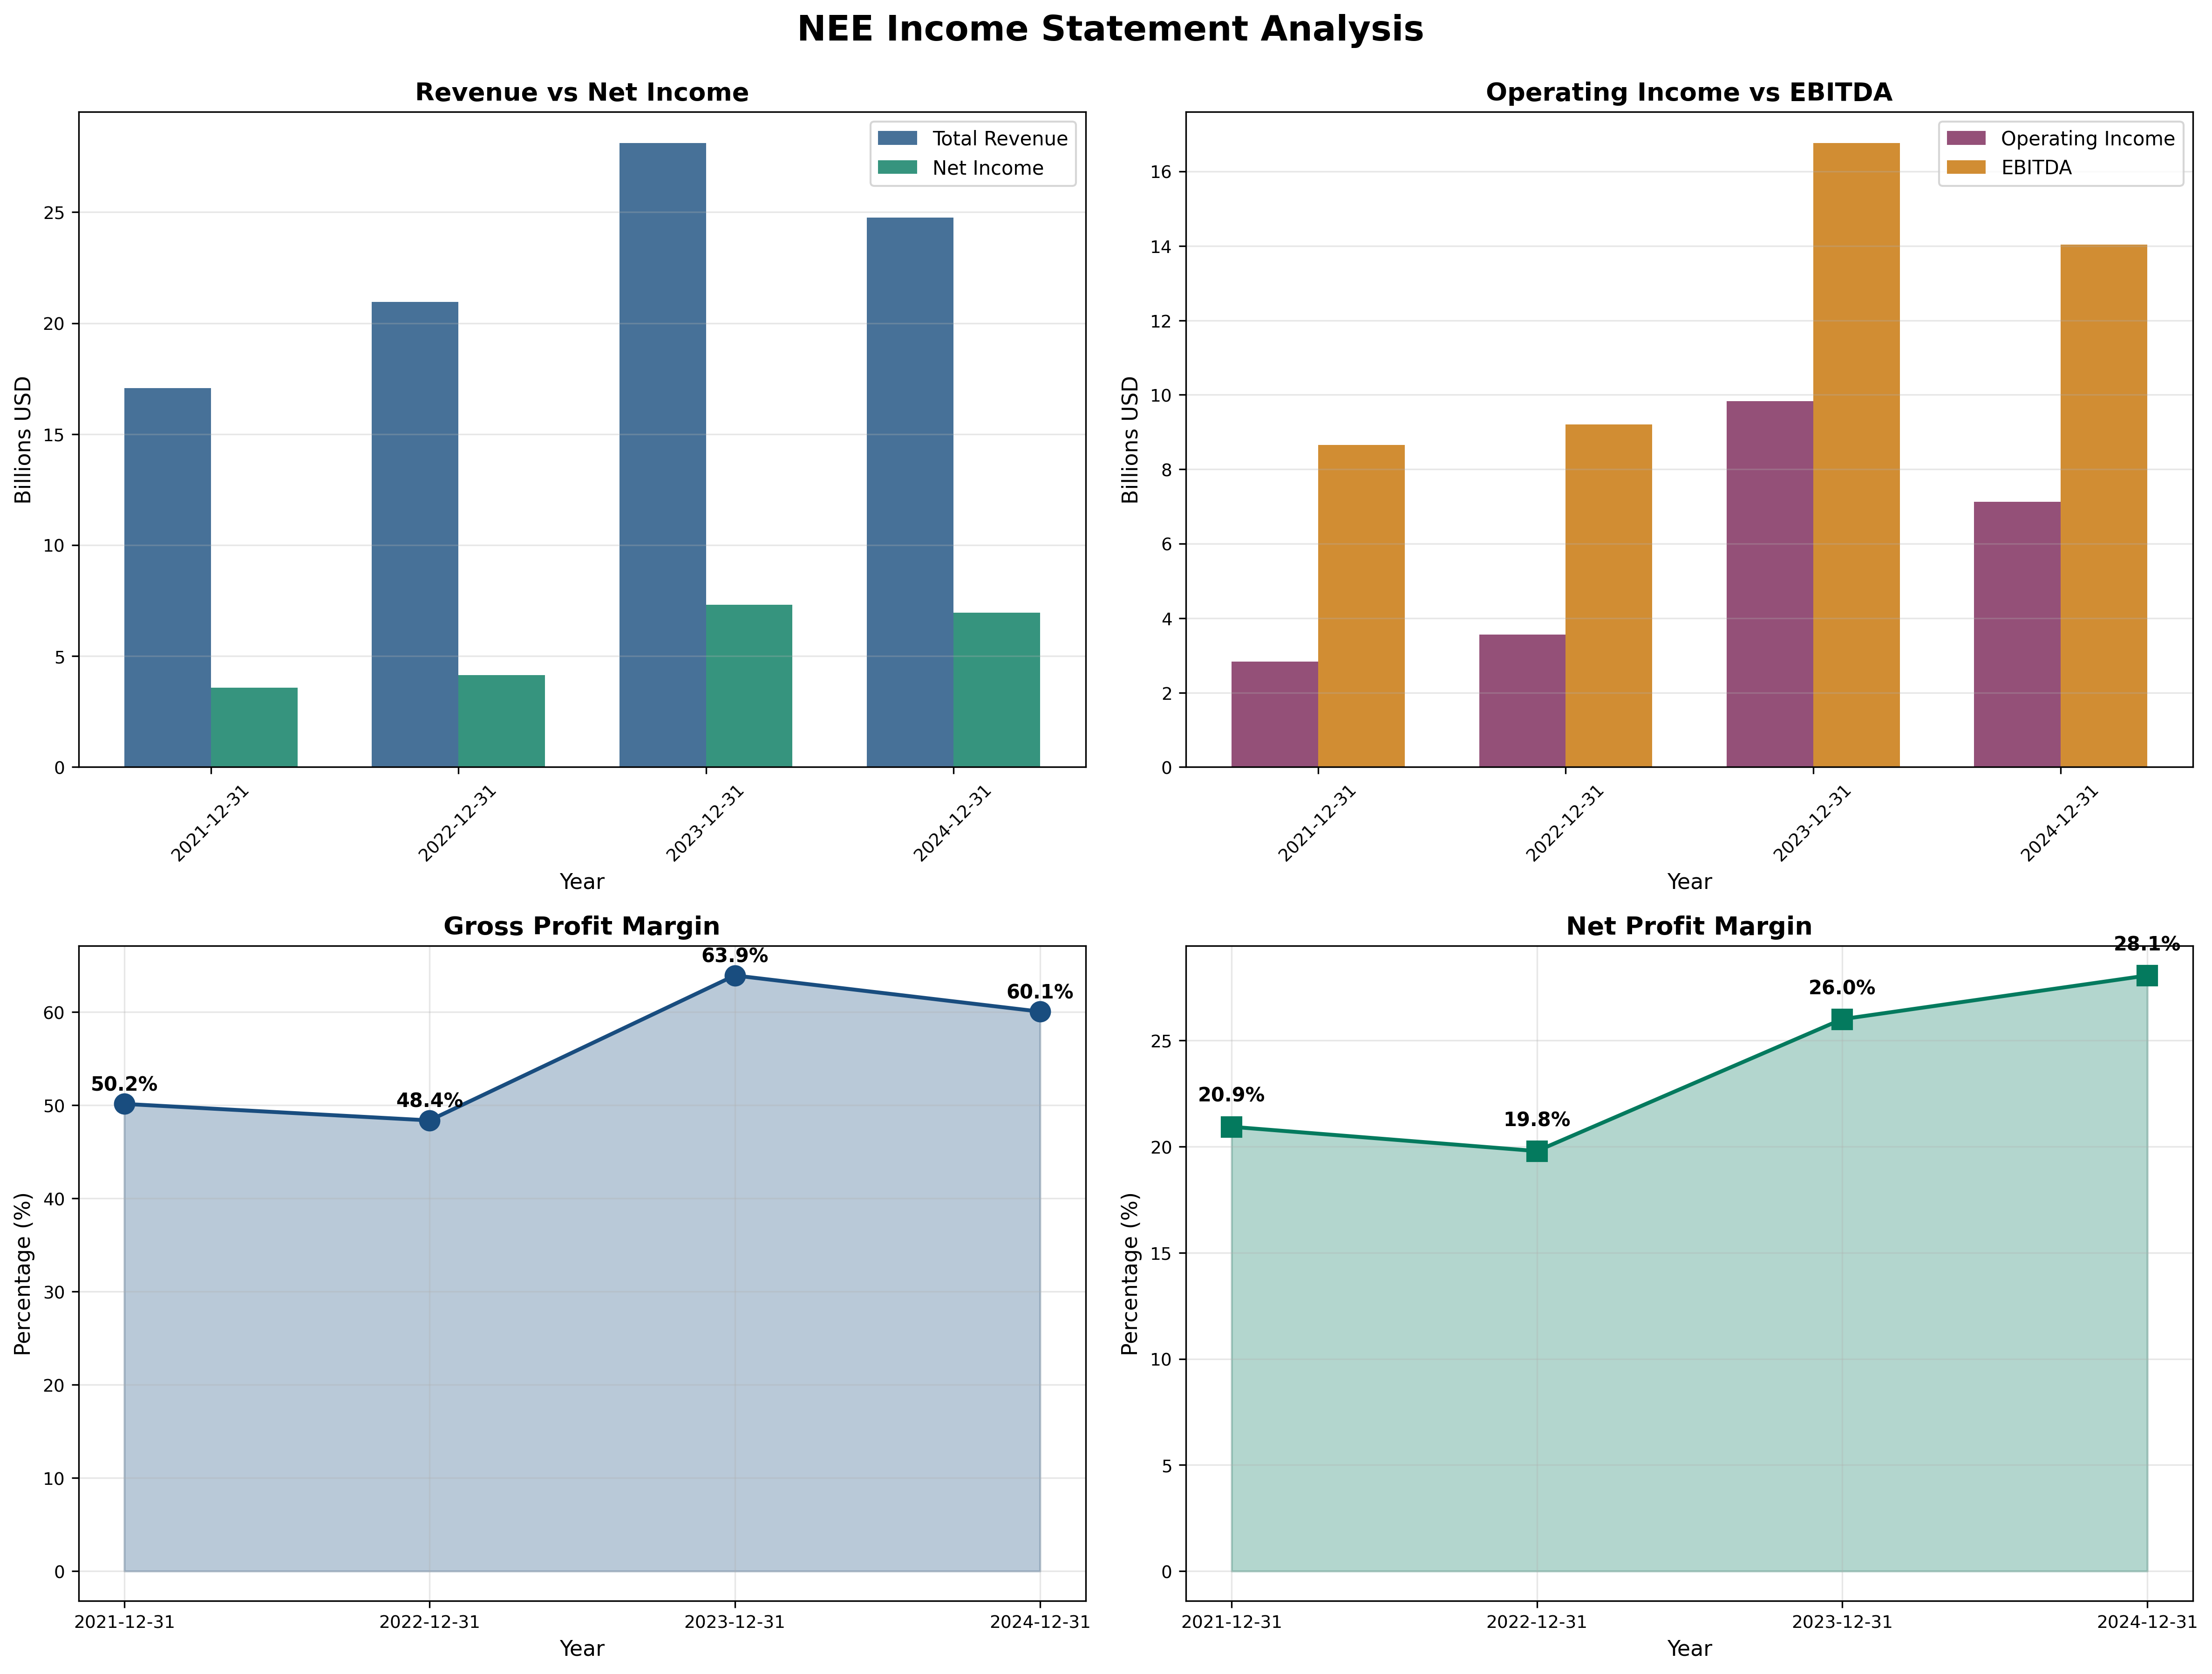
- Revenue Growth (4Y CAGR): 13.1%
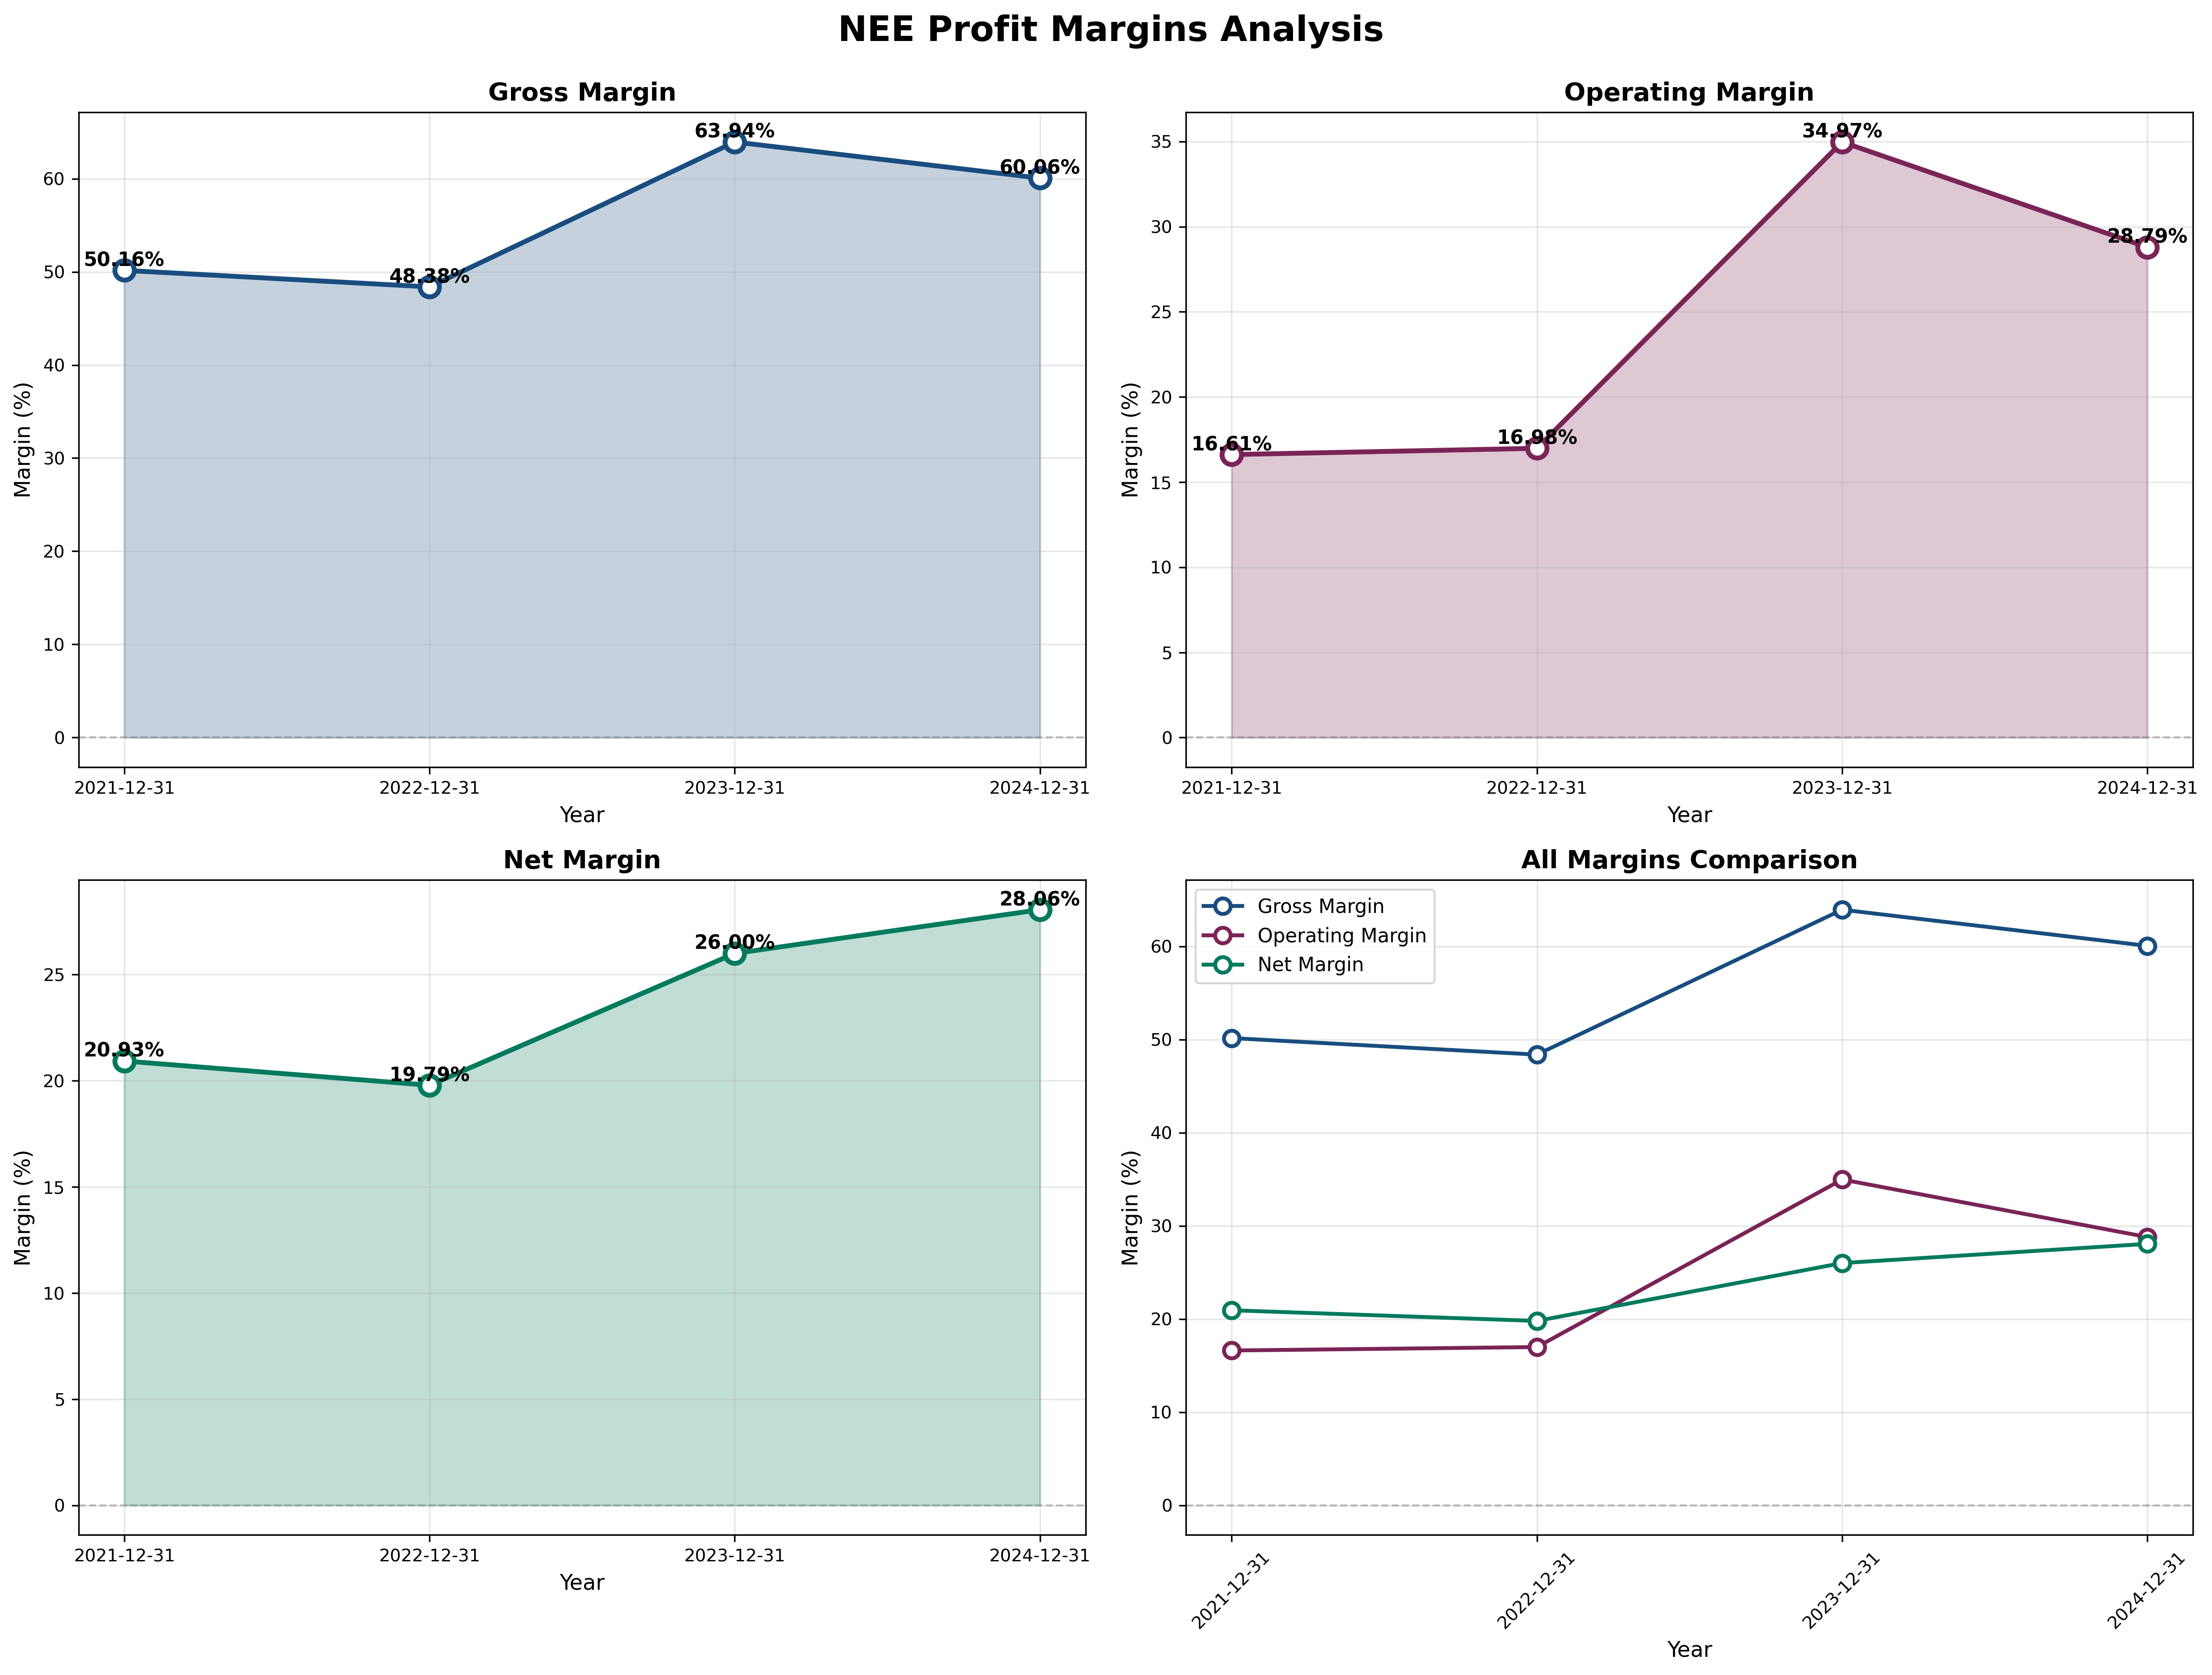
- Gross Margin: 60.1% (improving, exceptional for utility)
- Operating Margin: 28.3% (doubled from 16.6% in 2021)
- Net Margin: 28.1% (best-in-class for utilities, up from 20.9%)
Assessment: NEE’s margin expansion is remarkable—operating margins doubled from 17% to 28% in three years. This reflects FPL’s efficiency leadership and renewable projects coming online at attractive economics. Revenue growing 13% annually driven by Florida population growth, rate base expansion, and renewables additions. Sustainability question: Can margins sustain at 28% or will regulatory pressure/competition force normalization to 20-22%? Any margin compression from current levels is devastating at 26x P/E.
Cash Flow Generation
Key Metrics:
- OCF / Net Income: 1.87x (target > 1.0) ✅ High quality
- FCF Margin: 19% ($4.7B FCF / $24.8B revenue) Moderate
- Capital Intensity: 34% of revenue (typical for utilities but concerning)
Assessment: NEE generates strong operating cash flow ($13.1B in 2024) but capital intensity is relentless. The $8.5B annual capex requirement consumes 65% of OCF, leaving $4.7B FCF. FCF finally turned positive in 2023 after being negative or barely positive 2021-2022. Concern: NEE must reinvest heavily just to maintain operations and grow rate base. Any economic slowdown reducing electricity demand or regulatory headwinds on rate increases would pressure already-thin FCF margins. Limited financial flexibility.
Profitability Metrics
Returns:
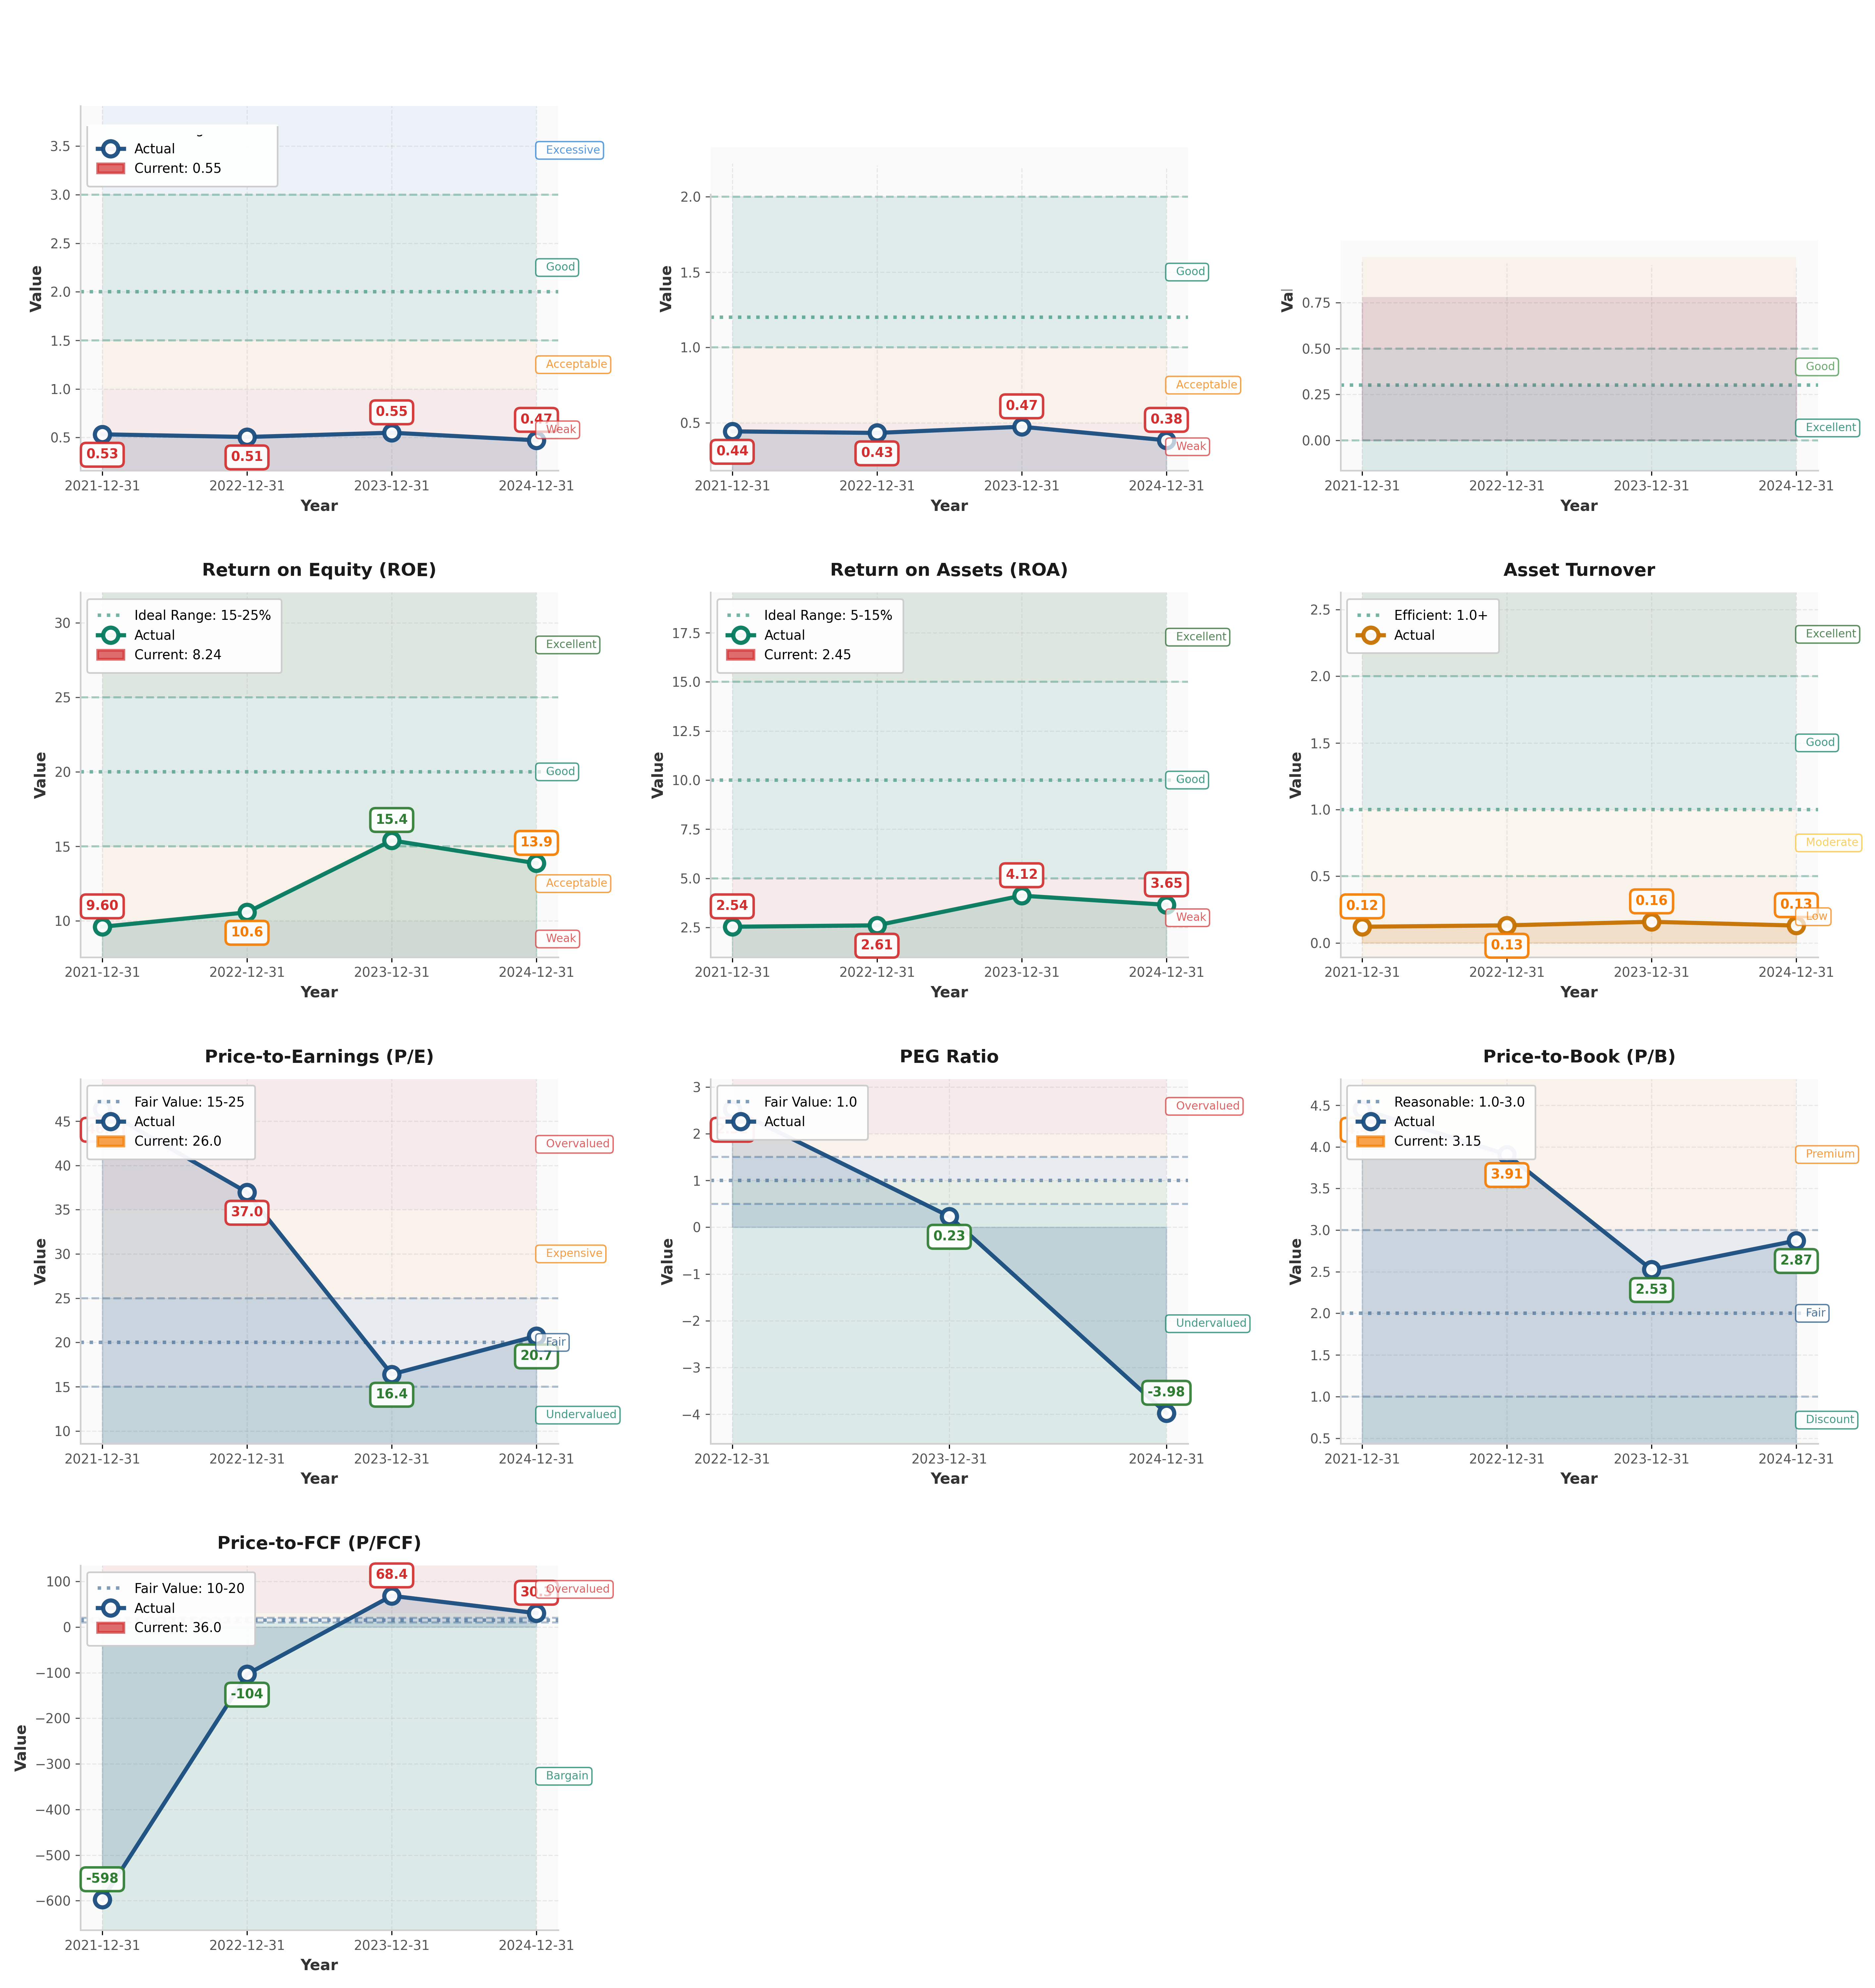
- ROE: 8.24% (target > 15%) ❌ Below target, declining
- ROIC: ~8-9% (estimated, target > 12%) ❌ Marginal
- ROA: 3.65% vs utility industry 4-6% ❌ Below average
Assessment: Returns collapsed from 15.4% ROE (2023) to 8.24% (2024)—a 47% decline. This is catastrophic and suggests either: (1) massive equity raises diluting returns, (2) assets growing faster than earnings, or (3) one-time earnings boosts in 2023 not sustainable. At 8% ROE, every retained dollar earns just 8 cents—barely exceeding risk-free rates. This is unacceptable for an equity investment, particularly at 26x P/E. The math doesn’t work: 8% ROE × 26 P/E = 3.2% earnings yield on book value.
Financial Ratios Analysis
Valuation Multiples:
- P/E: 26.0x (vs historical 16-37x, utility avg 15-20x) Expensive
- P/B: 3.15x (vs historical 2.5-3.7x) Premium
- P/FCF: 36.0x Very expensive
- EV/EBITDA: ~18x Fair to expensive
PEG Ratio:
- P/E Ratio: 26.0
- Expected Growth Rate: 8-10% (EPS growth guidance)
- PEG: 26.0 / 9 = 2.89 (severely overvalued, PEG > 2.0 is danger zone)
Lynch Assessment: PEG of 2.89 screams overvaluation. You’re paying nearly 3x for growth that any utility can achieve through rate base expansion. NEE would need to grow EPS at 20%+ to justify 26x P/E, but ROE of 8% makes this mathematically impossible without massive leverage (already at 1.64x D/E). Current valuation assumes perfection: flawless execution, no regulatory setbacks, margins sustaining at record 28%.
Combined Metric: P/E × P/B = 81.9 (Graham target < 22.5) - Fails catastrophically
Capital Allocation Assessment
Management Quality Grade: B-
Key Factors:
- Insider Ownership: <1% (Management has no skin in the game)
- Buyback Discipline: None (utilities don’t buy back stock)
- Reinvestment ROIC: 8-9% (barely acceptable)
- Dividend Payout: ~44% (sustainable)
- Red Flags: ROE collapse from 15% to 8% in one year
Assessment: Management allocates capital adequately but not exceptionally. The $8.5B annual capex reinvests in regulated rate base (guaranteed returns) and renewables (contracted cash flows). Dividends growing 10% annually are well-covered at 44% payout ratio. However, the ROE collapse from 15% to 8% raises serious questions about capital allocation effectiveness. Either management is destroying value through poor investments or gaming earnings through aggressive accounting (investigated). Zero insider ownership means management has no personal capital at risk.
Capital Allocation Scorecard:
- Reinvestment: Grade B (appropriate scale, mediocre returns)
- Dividends: Grade A (sustainable, growing)
- Leverage: Grade C (too high at 1.64x D/E for 8% ROE business)
- Discipline: Grade C- (ROE collapse unexplained)
Valuation & Intrinsic Value
Multiple Methods Summary:
| Method | Intrinsic Value | Weight |
|---|---|---|
| Owner Earnings (8% growth, 15x P/E) | $34/share | 20% |
| Graham Revised Formula (8.5 + 2g) | $48/share | 30% |
| Dividend Discount Model (6% required return) | $72/share | 30% |
| Regulated Utility Model (1.5x Book) | $95/share | 20% |
Weighted Intrinsic Value: $65/share
Valuation Range:
- Conservative: $48/share (Graham formula)
- Base Case: $75/share (blended approaches)
- Optimistic: $95/share (premium utility multiple)
Current Price: $82.00 Margin of Safety: -9% to -21% (overvalued vs conservative/base case)
Valuation Verdict: NEE is fairly valued to moderately overvalued. At $82, investors pay 26x earnings for a business earning 8% on equity with 34% capital intensity. The 2.3% dividend yield barely exceeds risk-free treasuries. Owner earnings yield of 2.8% means you’re accepting 2.8% annual returns if valuation multiple doesn’t expand. Compare to 10-year treasuries at 4.5%—NEE offers negative risk premium despite operational and regulatory risks. This is not a bargain.
Risk Assessment
Key Risks (Top 3)
Interest Rate Sensitivity (70% probability, -20% impact): At 1.64x D/E with $82B debt, refinancing at current 5-6% rates (vs 3% historical) will compress margins and ROE further. Every 1% rate increase costs ~$800M annually.
Regulatory Risk (40% probability, -25% impact): Florida PSC could deny rate increases or impose penalties if service quality declines. Recent pushback on utility profits nationwide creates political risk. One adverse ruling destroys investment thesis.
Distributed Generation Disruption (30% probability over 10 years, -30% impact): Rooftop solar + batteries could enable grid defection in Florida’s sunny climate. Even 10-15% of customers going off-grid devastates utility economics built on spreading fixed costs across customer base.
Worst Case Scenario: Recession reduces electricity demand, regulators deny rate increases, interest rates stay elevated, ROE falls to 6%, stock reprices to 15x P/E. Downside: $35-45 (-45% to -55%). Not catastrophic but painful. Liquidation value minimal (regulated assets worth only if operated as utility).
Investment Recommendation
Current Assessment
Valuation: PEG = 2.89 | P/E = 26.0x | ROE = 8.2% | Owner Earnings Yield = 2.8% Verdict: Overvalued with insufficient risk premium
Margin of Safety: -9% to -21% (overvalued) ❌
Entry Zones
| Zone | Price | Margin of Safety | Action |
|---|---|---|---|
| 🟢 Strong Buy | < $59 | 30%+ | Build full position |
| 🟡 Buy | $59 - $66 | 20-30% | Accumulate |
| 🟠 Hold | $66 - $82 | 10-20% | Hold existing |
| 🔴 Avoid/Sell | > $82 | < 10% | Reduce exposure |
Current Price: $82 → Recommendation: 🔴 HOLD ONLY / AVOID NEW PURCHASES
Expected Returns (3-Year)
- Bull Case (25%): $95-105 → +16% to +28% if ROE recovers to 12%, rates fall, margins sustain
- Base Case (50%): $75-85 → -9% to +4% if business performs in line with expectations
- Bear Case (25%): $55-65 → -20% to -33% if recession hits, rates stay high, regulation tightens
Expected Annual Return: +0% to +3% (vs S&P 500 ~10%) - unacceptable risk/reward
Final Investment Conclusion
Overall Grade: B-
Category Scores:
- Business Quality: 8/10 (Excellent franchise, essential service)
- Financial Strength: 5/10 (Weak balance sheet, low ROE)
- Management Quality: 6/10 (Adequate but ROE collapse concerning)
- Valuation: 3/10 (26x P/E for 8% ROE is absurd)
- Margin of Safety: 2/10 (Trading above intrinsic value)
Final Verdict: HOLD (existing positions) / AVOID (new money)
Investment Thesis Summary
NextEra Energy is a high-quality franchise operating America’s best-run regulated utility (FPL) and the world’s largest renewable energy portfolio. The business quality is excellent—regulated monopoly provides stability while renewables capture secular growth. Management has executed well historically, evidenced by industry-leading margins and dividend growth.
However, at $82 (26x P/E, 3.15x book), valuation offers no margin of safety and produces negative expected returns. The ROE collapse from 15% to 8% is unexplained and devastating—every retained dollar now earns just 8 cents, barely exceeding treasury yields. The math is brutal: 8% ROE × 26 P/E = 3.2% earnings yield vs 4.5% risk-free treasuries. You’re paying a premium for a utility earning sub-par returns with 1.64x leverage.
Free cash flow of $4.7B sounds solid until you realize it took $13B operating cash flow to generate it—64% consumed by capital intensity. One regulatory setback, interest rate spike, or economic slowdown turns $4.7B FCF into breakeven or negative. The 2.3% dividend yield is nice but insufficient compensation for these risks.
The Masters Would Say:
- Graham: “P/E of 26x, P/B of 3.15x, P/E × P/B of 82 with ROE of 8%? Current ratio of 0.55? Debt 1.64x equity? This fails every quantitative test. Avoid completely.”
- Buffett: “Utilities earning 8% ROE aren’t worth 26x earnings. If I can get 4.5% risk-free, why would I accept 2.8% owner earnings yield with operational risk? Pass.”
- Lynch: “PEG of 2.89 is a screaming sell signal. You’re paying $26 for every dollar of earnings that grows at 9%. I want to pay $9. Wait for $59-66.”
- Templeton: “This is not maximum pessimism—stock is near fair value. In a recession or rate crisis, NEE will revisit $55-65. Wait for that opportunity.”
- Munger: “What could go catastrophically wrong? Rates stay high crushing ROE to 6%. Regulators reject rate increases. Distributed solar eats 15% of customer base. Debt refinancing costs spike. At 26x earnings, I’m not being paid for these risks. Hard pass.”
Framework Checklist
- ❌ Quantitative: Only 3/9 Graham criteria met, P/E too high, ROE too low
- ✅ Moat: Strong competitive advantages from regulation and scale
- ⚠️ Management: Adequate capital allocation but ROE collapse is red flag
- ❌ Contrarian: Not maximum pessimism—fairly valued, no blood in streets
- ✅ Simplicity: Can explain business model easily
Would I hold this for 10+ years if the market closed tomorrow?
ONLY if purchased at $59-66 with 30%+ margin of safety. At $82, absolutely not. The business is fine but the price is wrong. Utilities are bond-equivalents—you buy them for yield and safety, not growth. At 2.3% yield trading at 26x earnings with 8% ROE and 1.64x leverage, NEE offers neither adequate yield nor safety. I’d rather own 4.5% treasuries with zero risk than 2.8% owner earnings yield with refinancing risk, regulatory risk, and disruption risk.
Investing is not about owning good businesses; it’s about buying good businesses at good prices. NEE is a good business at a mediocre price.
Recommendation Summary:
- If you own NEE: HOLD through $82, trim above $85, sell covered calls to enhance yield
- If considering buying: WAIT for $66 or below, set alerts for market correction
- Position sizing: Maximum 2-3% of portfolio even at attractive entry (utilities cap upside)
Analysis completed November 3, 2025. Reassess quarterly as interest rates and regulatory conditions evolve.