Executive Summary
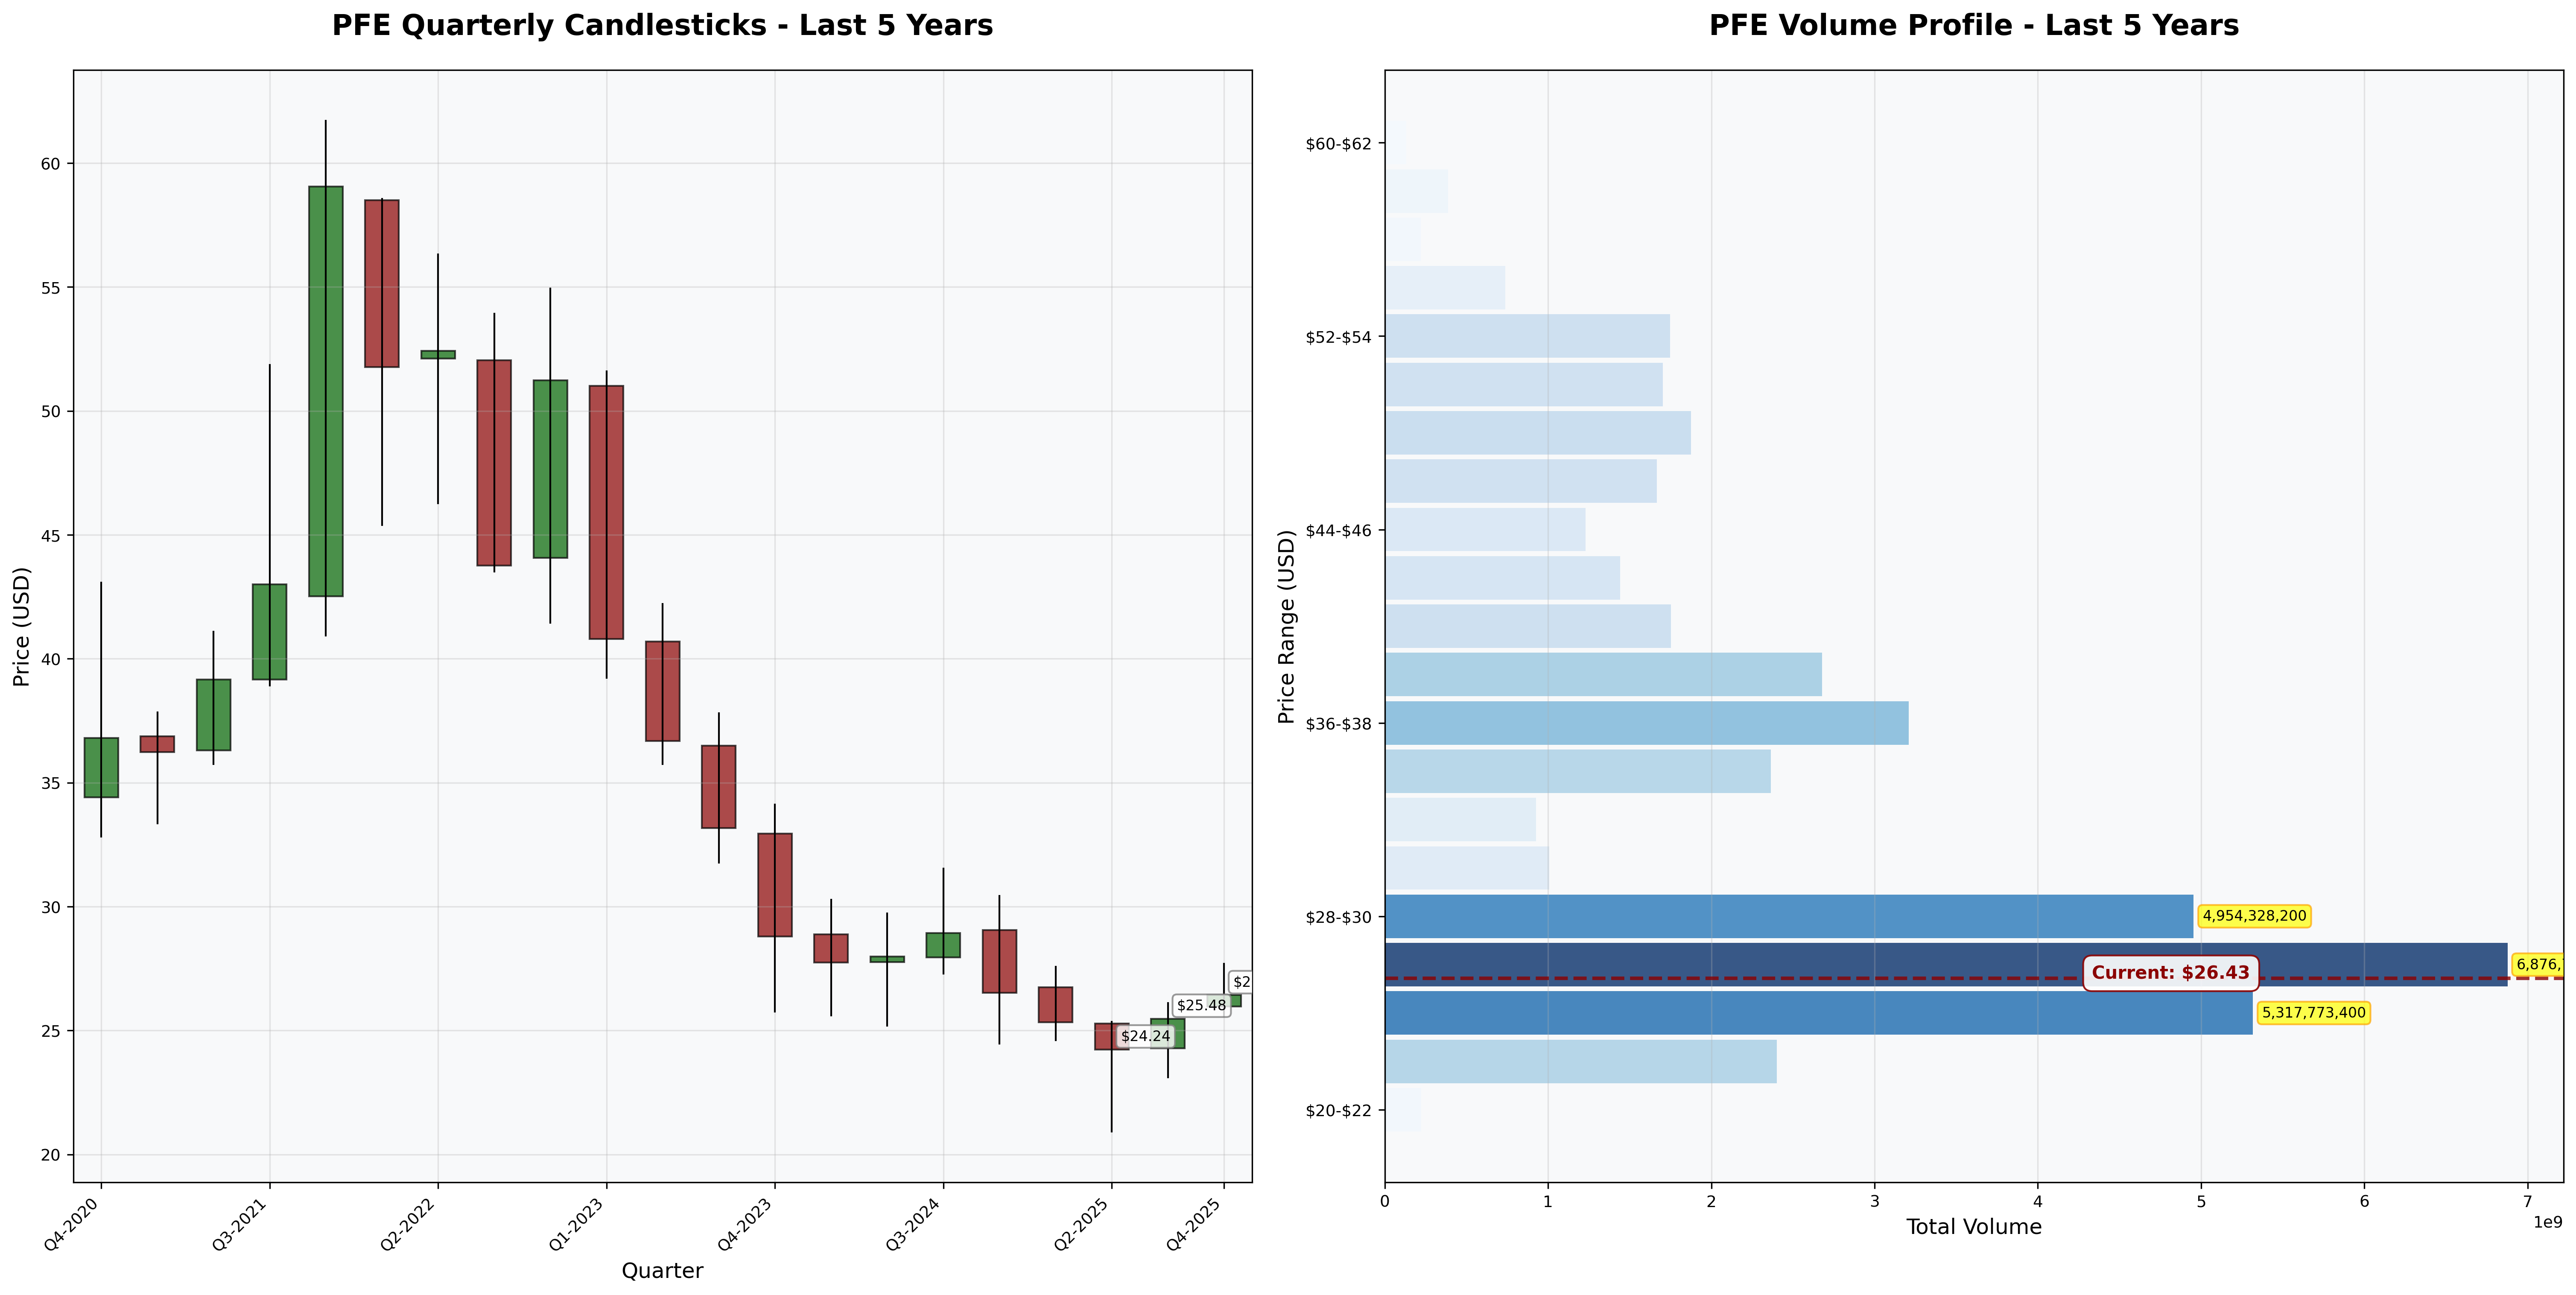
Investment Thesis: Pfizer is experiencing a significant post-COVID earnings normalization after unprecedented vaccine-driven profits. Trading at $26.43 with a P/E of 17.7x and P/B of 1.69x, the stock offers potential turnaround value but faces execution risks as management navigates patent cliffs, integrates acquisitions, and rebuilds the pipeline. The business fails most defensive investor criteria but may reward patient capital if operational improvements materialize.
Business Classification: Cyclical/Turnaround
Current Valuation Assessment:
- Current Price: $26.43
- Estimated Intrinsic Value: $28-$35
- Margin of Safety: ~6-25%
- Recommendation: HOLD (accumulate on weakness)
Recommended Entry Zones:
- Aggressive Entry: < $22 (35%+ margin)
- Standard Entry: $22-$25 (25-30% margin)
- Hold/Accumulate: $25-$28
- Avoid: > $30
Business Overview
What They Do (2-Minute Test)
Pfizer discovers, develops, manufactures, and sells medicines and vaccines across multiple therapeutic areas including oncology, rare diseases, inflammation, cardiovascular, and infectious diseases. Customers (hospitals, pharmacies, patients) buy from them because of strong brand reputation, established distribution networks, and a portfolio of blockbuster drugs—though many face near-term patent expirations requiring pipeline replenishment.
Competitive Position & Moat Analysis
Primary Moat Type: Intangible Assets (Patents, Regulatory Approvals, Brand)
Moat Strength: ⭐⭐⭐ (out of 5)
Key Moat Factors:
- Patent protection on key drugs provides temporary monopolies (Eliquis, Ibrance, Prevnar franchises)
- Regulatory barriers require 10+ years and billions in R&D to bring competing drugs to market
- Established relationships with healthcare systems and payers create switching costs
- Global manufacturing and distribution scale advantages
Moat Durability:
- Narrowing in near-term due to major patent cliffs (Eliquis loses exclusivity 2026-2028)
- Key Threat: Generic/biosimilar competition erodes 80-90% of branded drug revenues post-patent expiration, forcing constant pipeline renewal
Industry Dynamics
50-Year Outlook: Pharmaceuticals will remain critical as aging populations and chronic disease prevalence increase globally, though pricing pressures from governments and payers will intensify.
Key Trends:
- Shift toward precision medicine and oncology (higher margins, less competition)
- Biosimilar competition accelerating for biologics
- Government price negotiations (Medicare reforms) pressuring margins
Quantitative Checklist
Defensive Investor Criteria:
| Criterion | Requirement | Actual | Pass/Fail |
|---|---|---|---|
| Earnings Stability | Positive 10 years | 9/10 years* | ⚠️ |
| Dividend Record | Some payment | $1.68/share (6.4% yield) | ✅ |
| Earnings Growth | +33% in 10 years | Volatile (COVID distortion) | ❌ |
| P/E Ratio | < 15x | 17.7x | ❌ |
| P/B Ratio | < 1.5x | 1.69x | ❌ |
| P/E × P/B | < 22.5 | 29.9 | ❌ |
| Current Ratio | > 2.0 | 1.16x | ❌ |
| Debt vs NCA | Debt < NCA | $63.6B vs $7B | ❌ |
Quantitative Score: 1.5/9 criteria met
Analysis: Pfizer fails classic defensive investor tests. The 2023 loss ($2.1B net income) breaks earnings consistency. Current ratio of 1.16x and debt-to-equity of 0.72x signal weakened balance sheet strength post-acquisition spree. This is definitively NOT a defensive investor stock—it’s a turnaround/cyclical play requiring higher risk tolerance.
Financial Analysis with Critical Assessment
Balance Sheet Strength
Key Metrics:
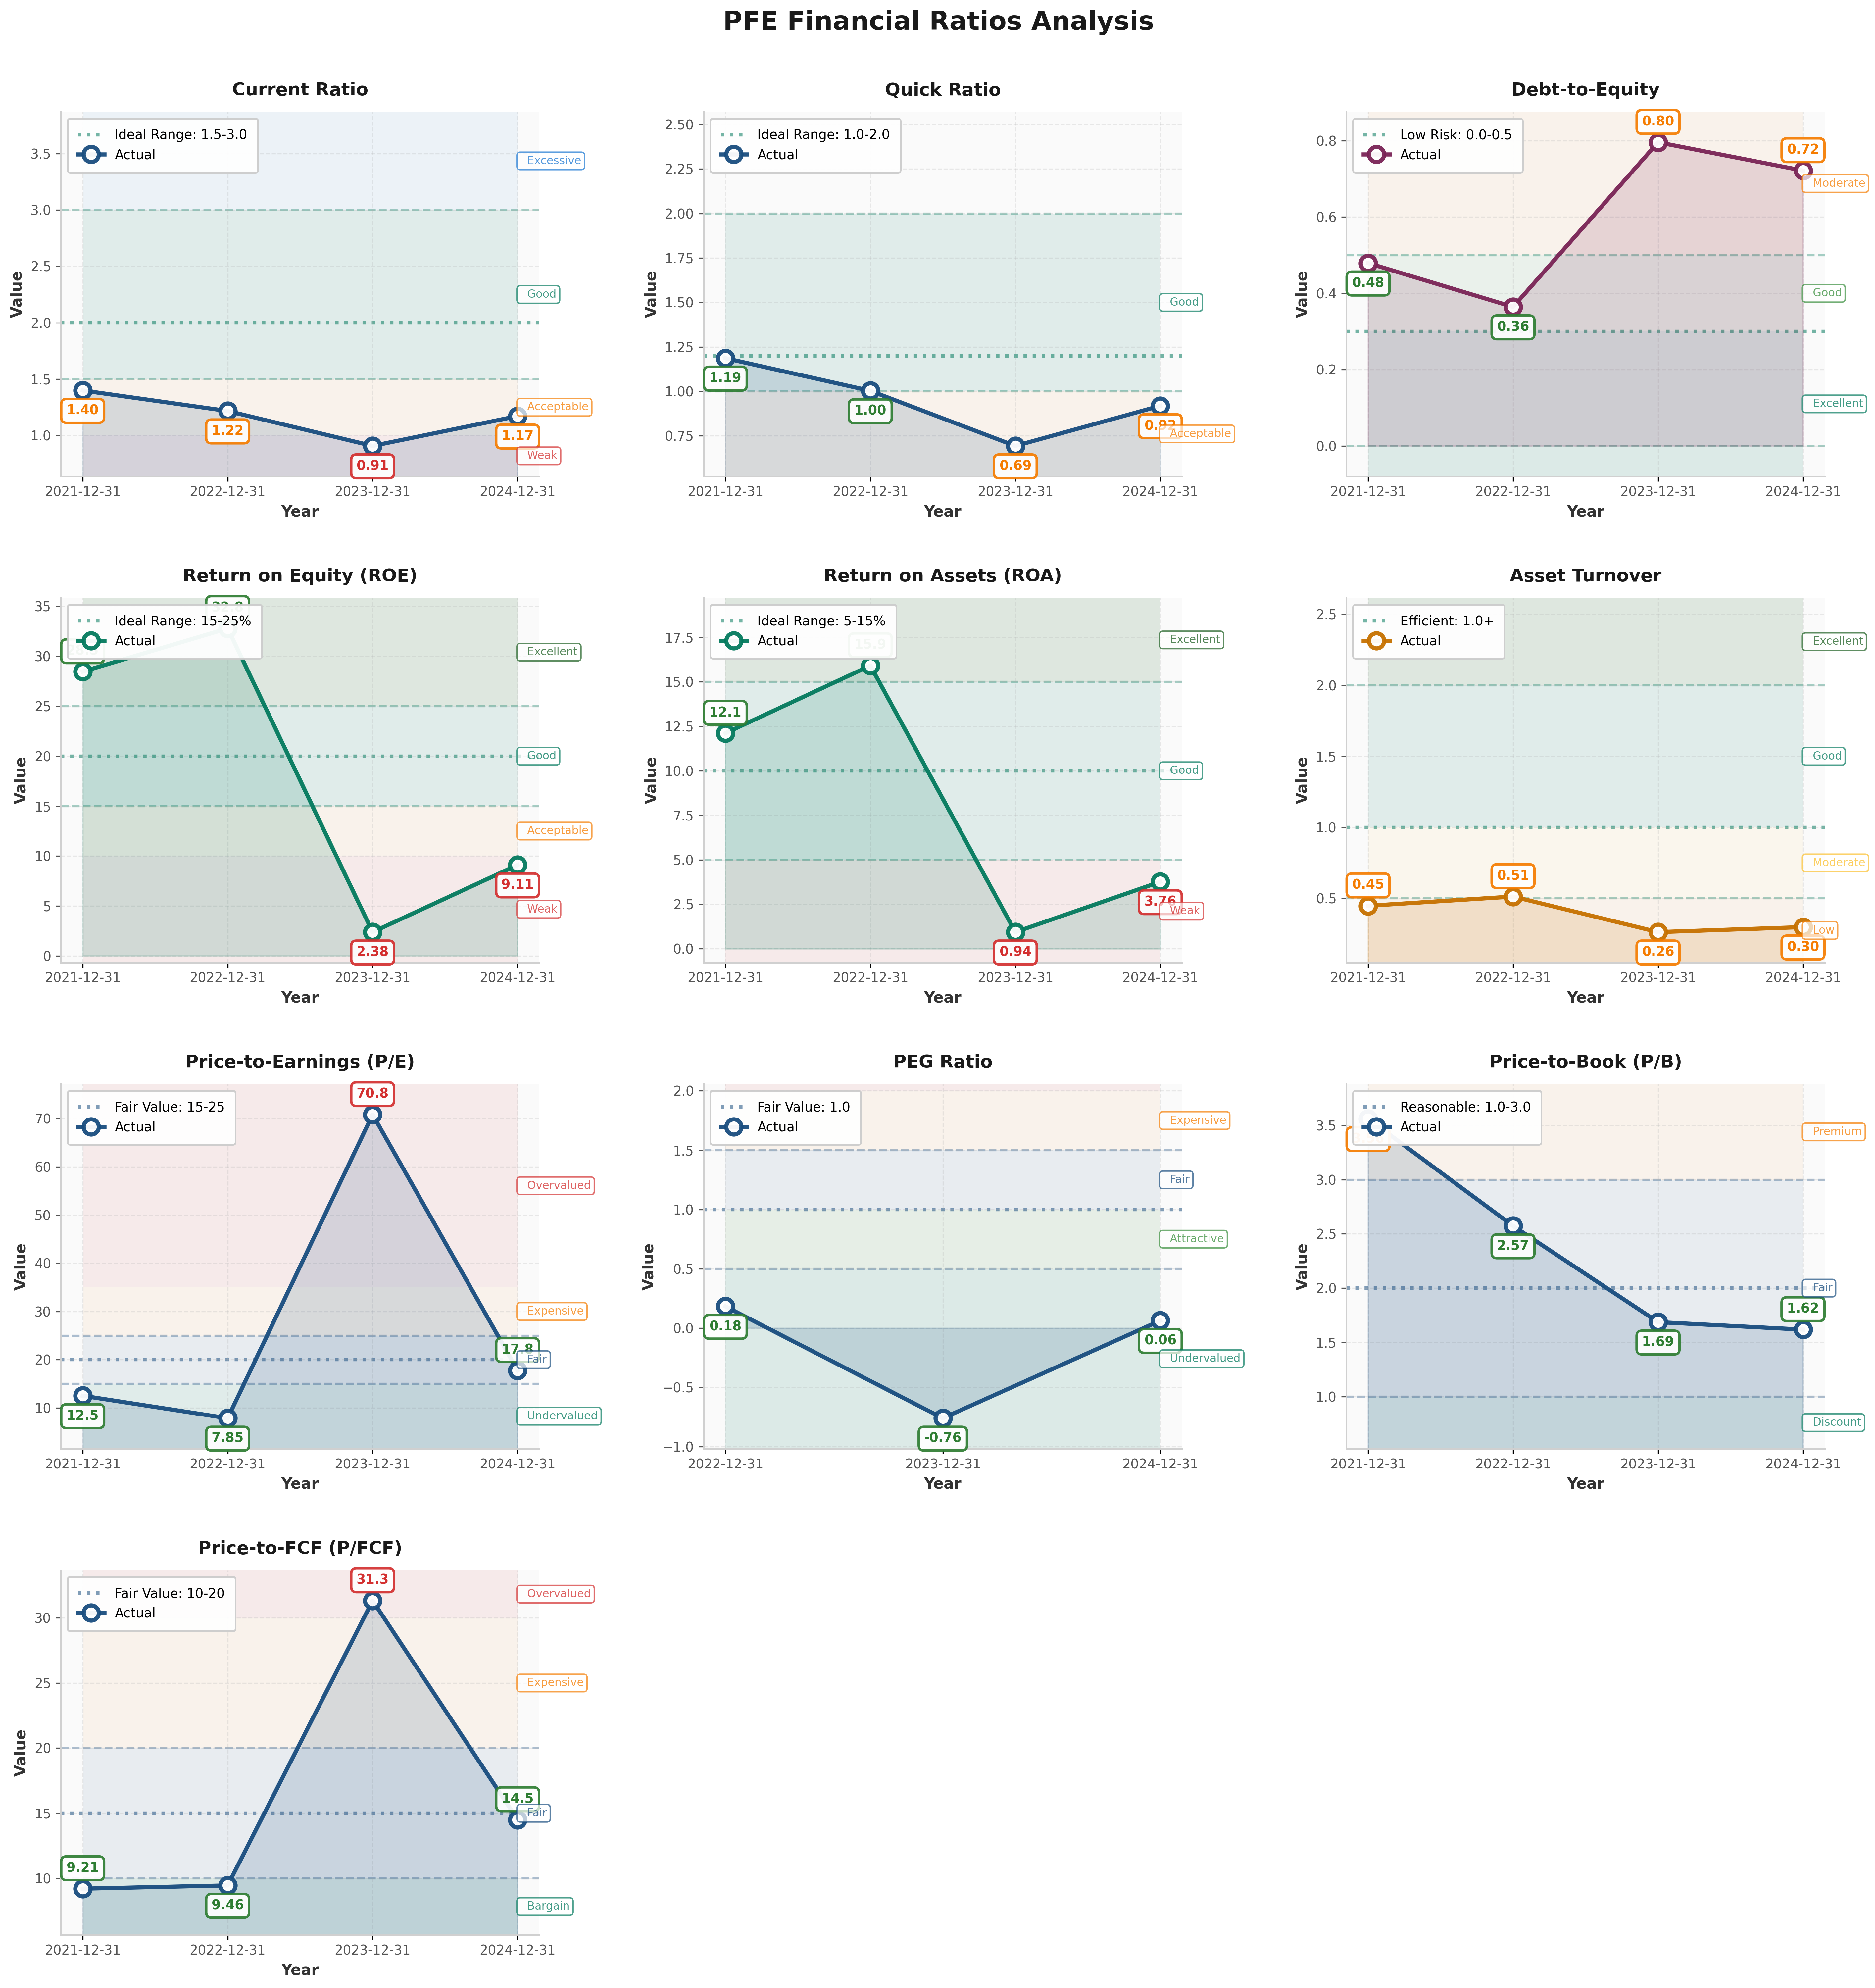
- Current Ratio: 1.16x (target > 2.0) - ❌
- Debt-to-Equity: 0.72x (target < 0.5) - ❌
- Interest Coverage: ~5x (estimated, target > 5x) - ✅
- Total Debt: $63.6B (up 72% from $37B in 2021)
Assessment: Balance sheet deteriorated significantly as Pfizer levered up for acquisitions (Seagen $43B, others) while simultaneously seeing revenue/earnings collapse post-COVID. Not a fortress balance sheet, but manageable with $10B cash and strong FCF generation capability. Main concern is debt servicing if earnings don’t recover as expected.

Earnings Quality & Consistency
Stability Test: Positive earnings in 9/10 of past years (2023 was minimal at $2.1B, near breakeven)
Owner Earnings Calculation:
Net Income (2024): $8.3B
+ D&A: ~$8B (estimated)
- Maintenance Capex: ($3B)
- Working Capital Needs: ($1B)
= Owner Earnings: ~$12B
Owner Earnings Yield: ~8% (market cap ~$150B)
Quality Assessment: Earnings highly cyclical and distorted by COVID vaccine windfall (2022 peak $31B). Current normalized earnings around $8-10B annually appear sustainable but require successful pipeline execution. Red flag: negative PEG ratio suggests market expects negative growth.

Income Statement Analysis
Key Metrics:
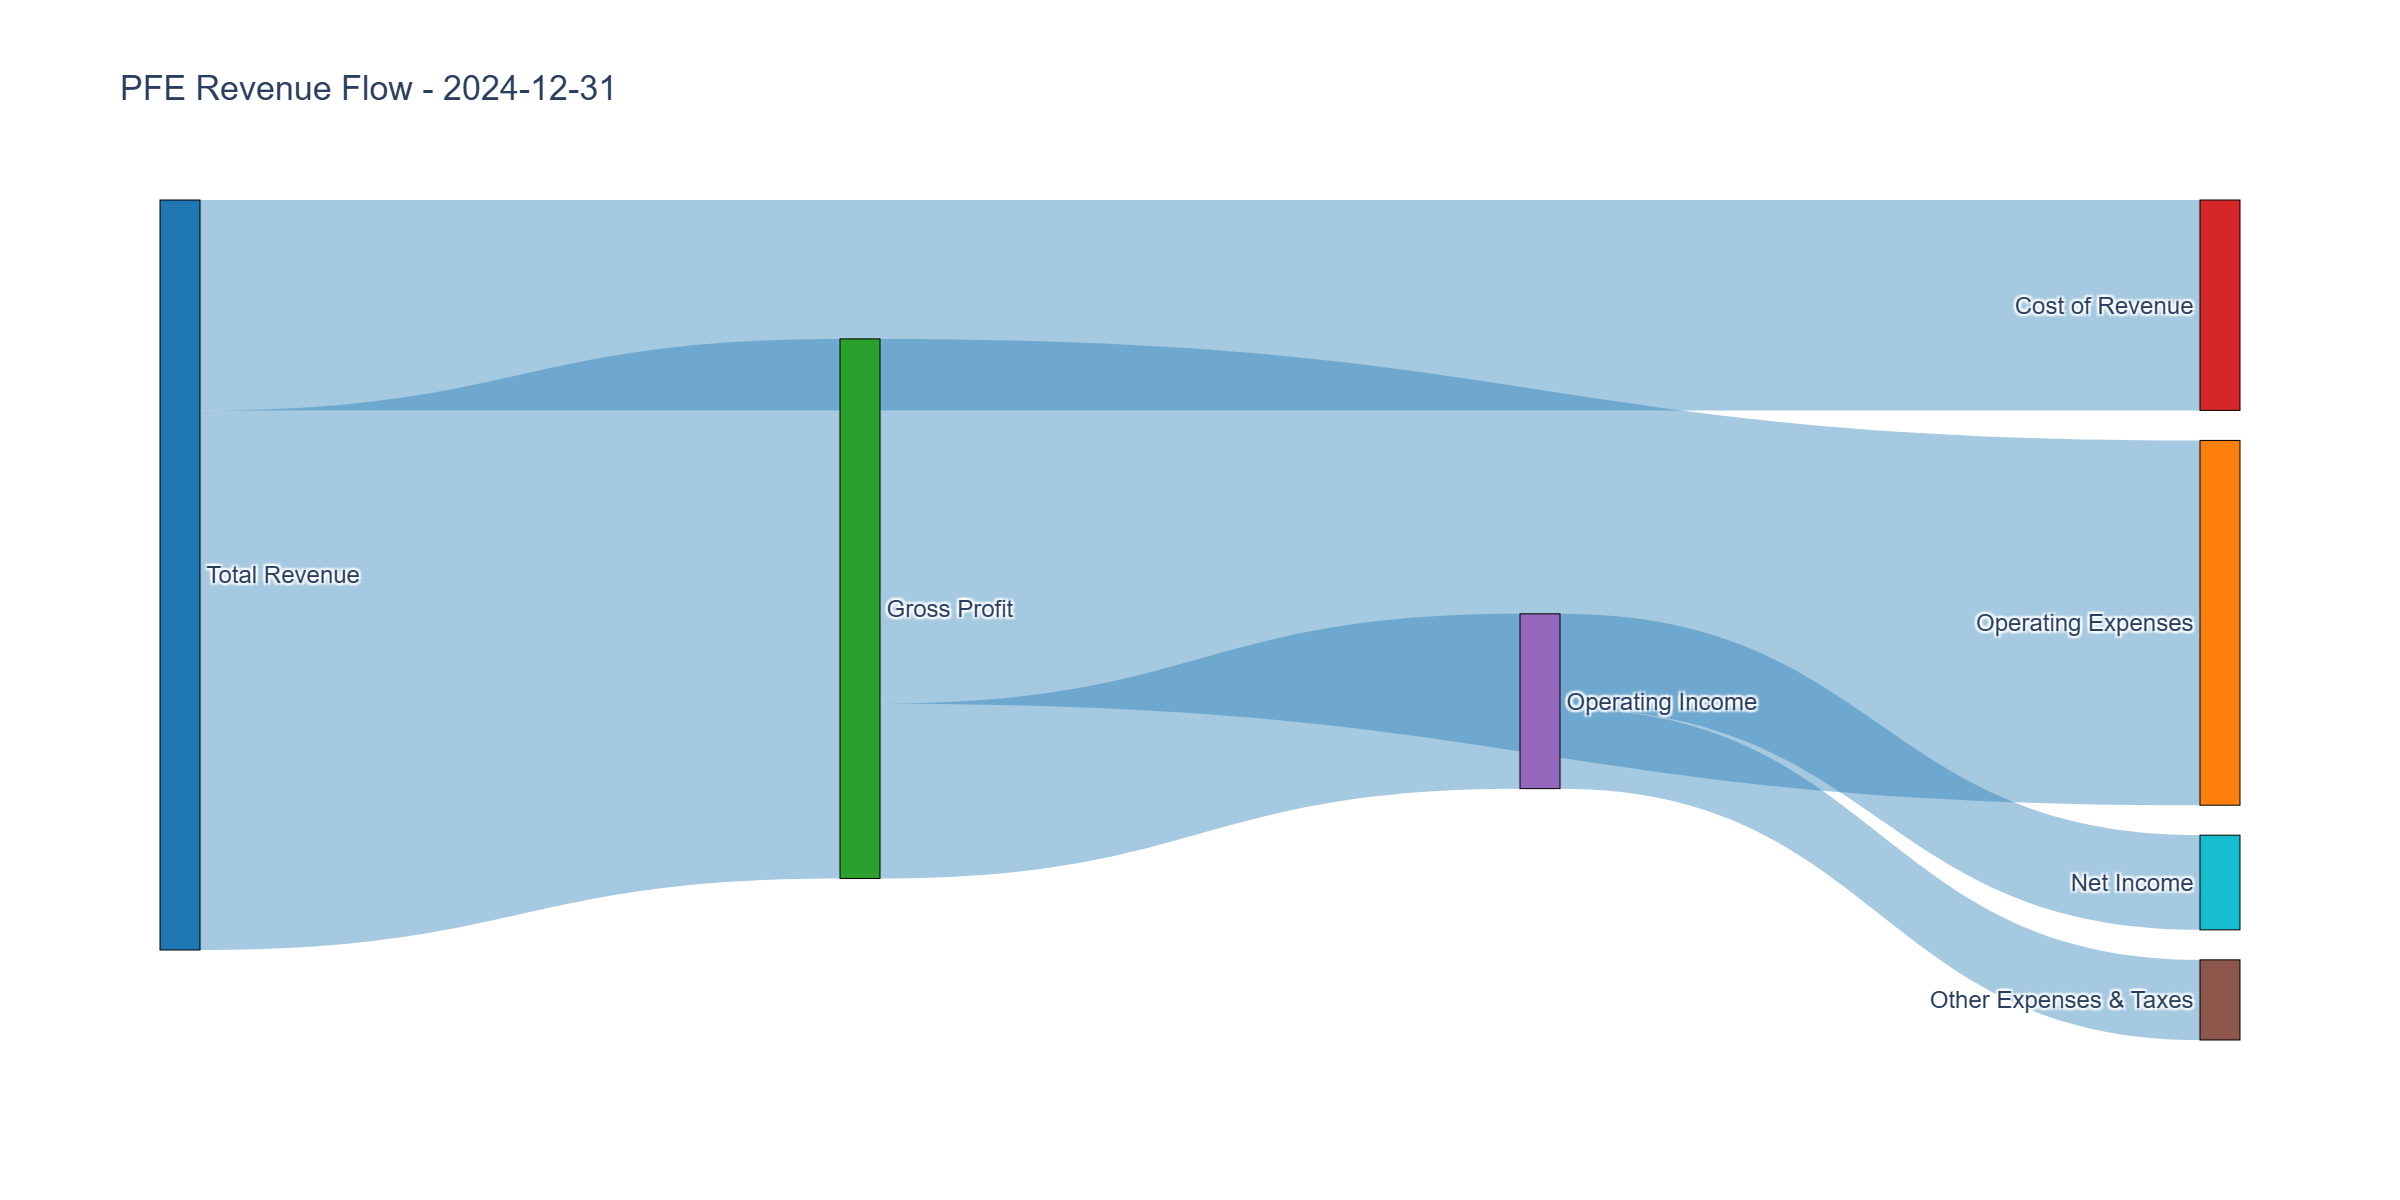
- Revenue: $65B (2024), down from $100B peak (2022)
- Revenue Growth (5Y CAGR): -4% (COVID distortion)
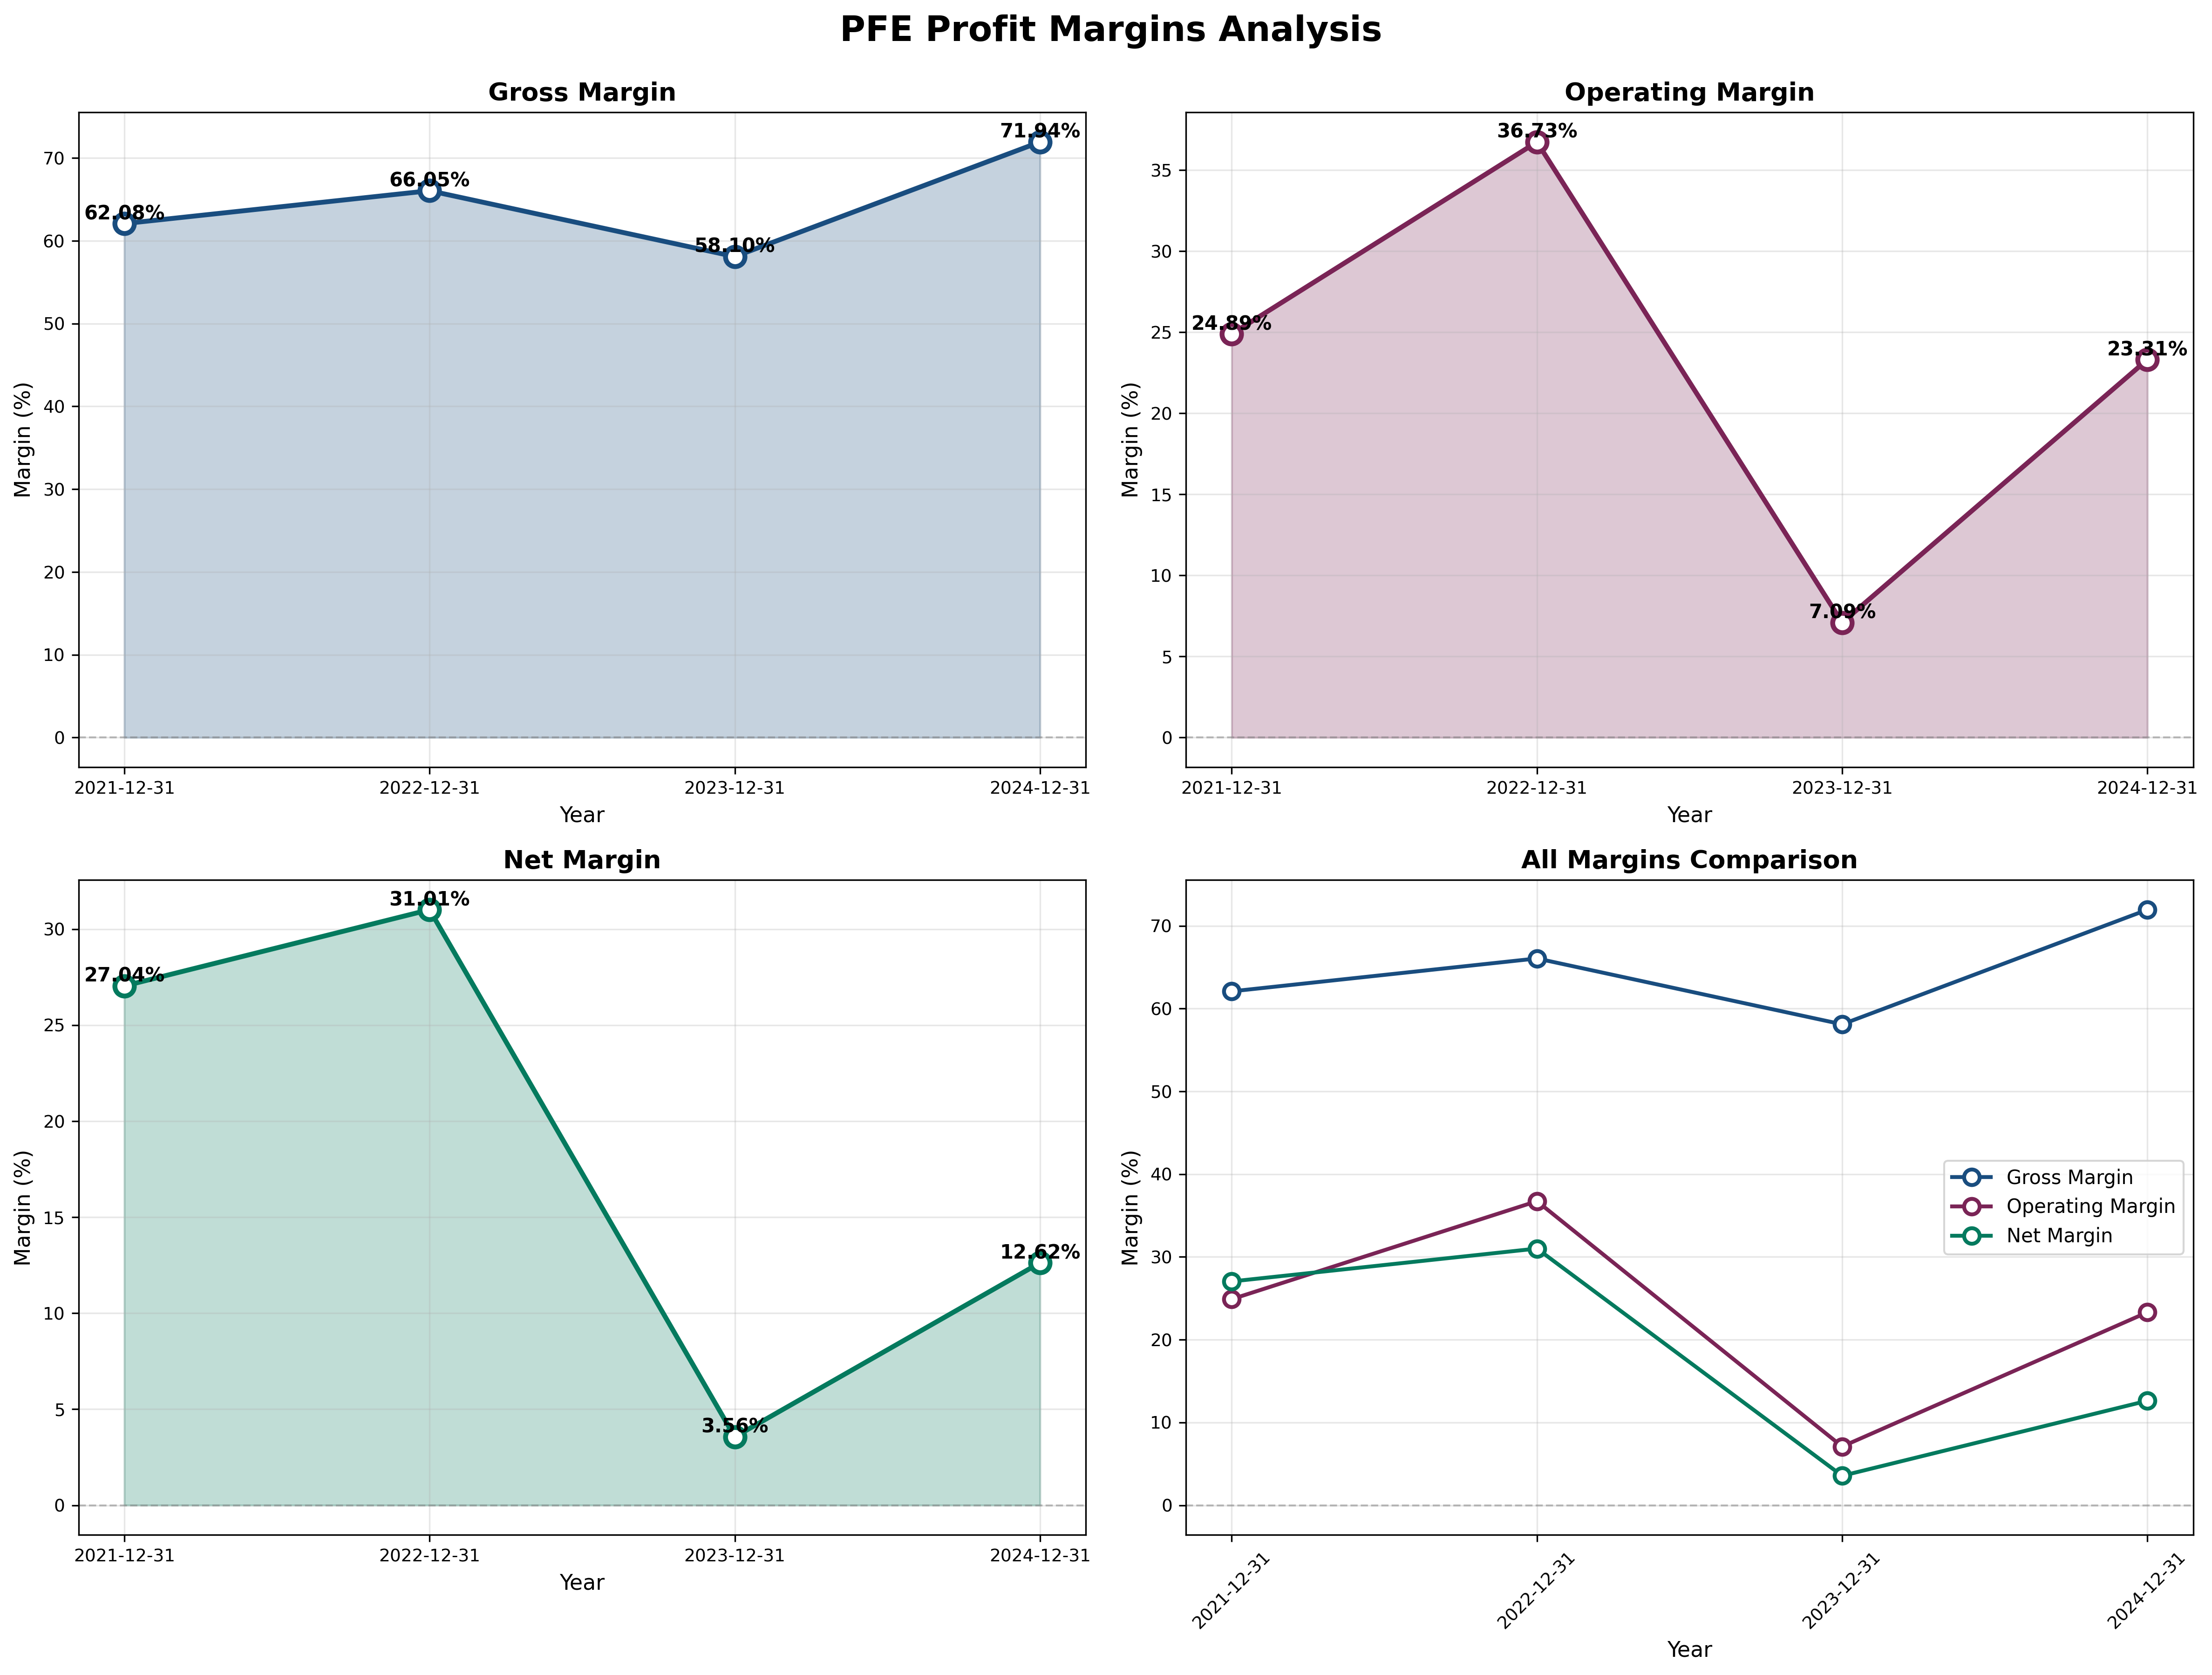
- Gross Margin: 71.9% (2024) vs 66.1% (2022) → improving
- Operating Margin: 23.3% (2024) vs 36.4% (2022) → normalizing
- Net Margin: 12.6% (2024) vs 31.0% (2022) → compressing
Assessment: Revenue declined 35% from COVID peak as Paxlovid/Comirnaty sales normalized. Gross margins actually improving (higher-margin non-COVID product mix), but operating leverage disappeared with lower volumes. Management guiding to $61-64B revenue range 2025—essentially flat. Key risk: Can new products offset patent cliff losses?

Cash Flow Generation
Key Metrics:
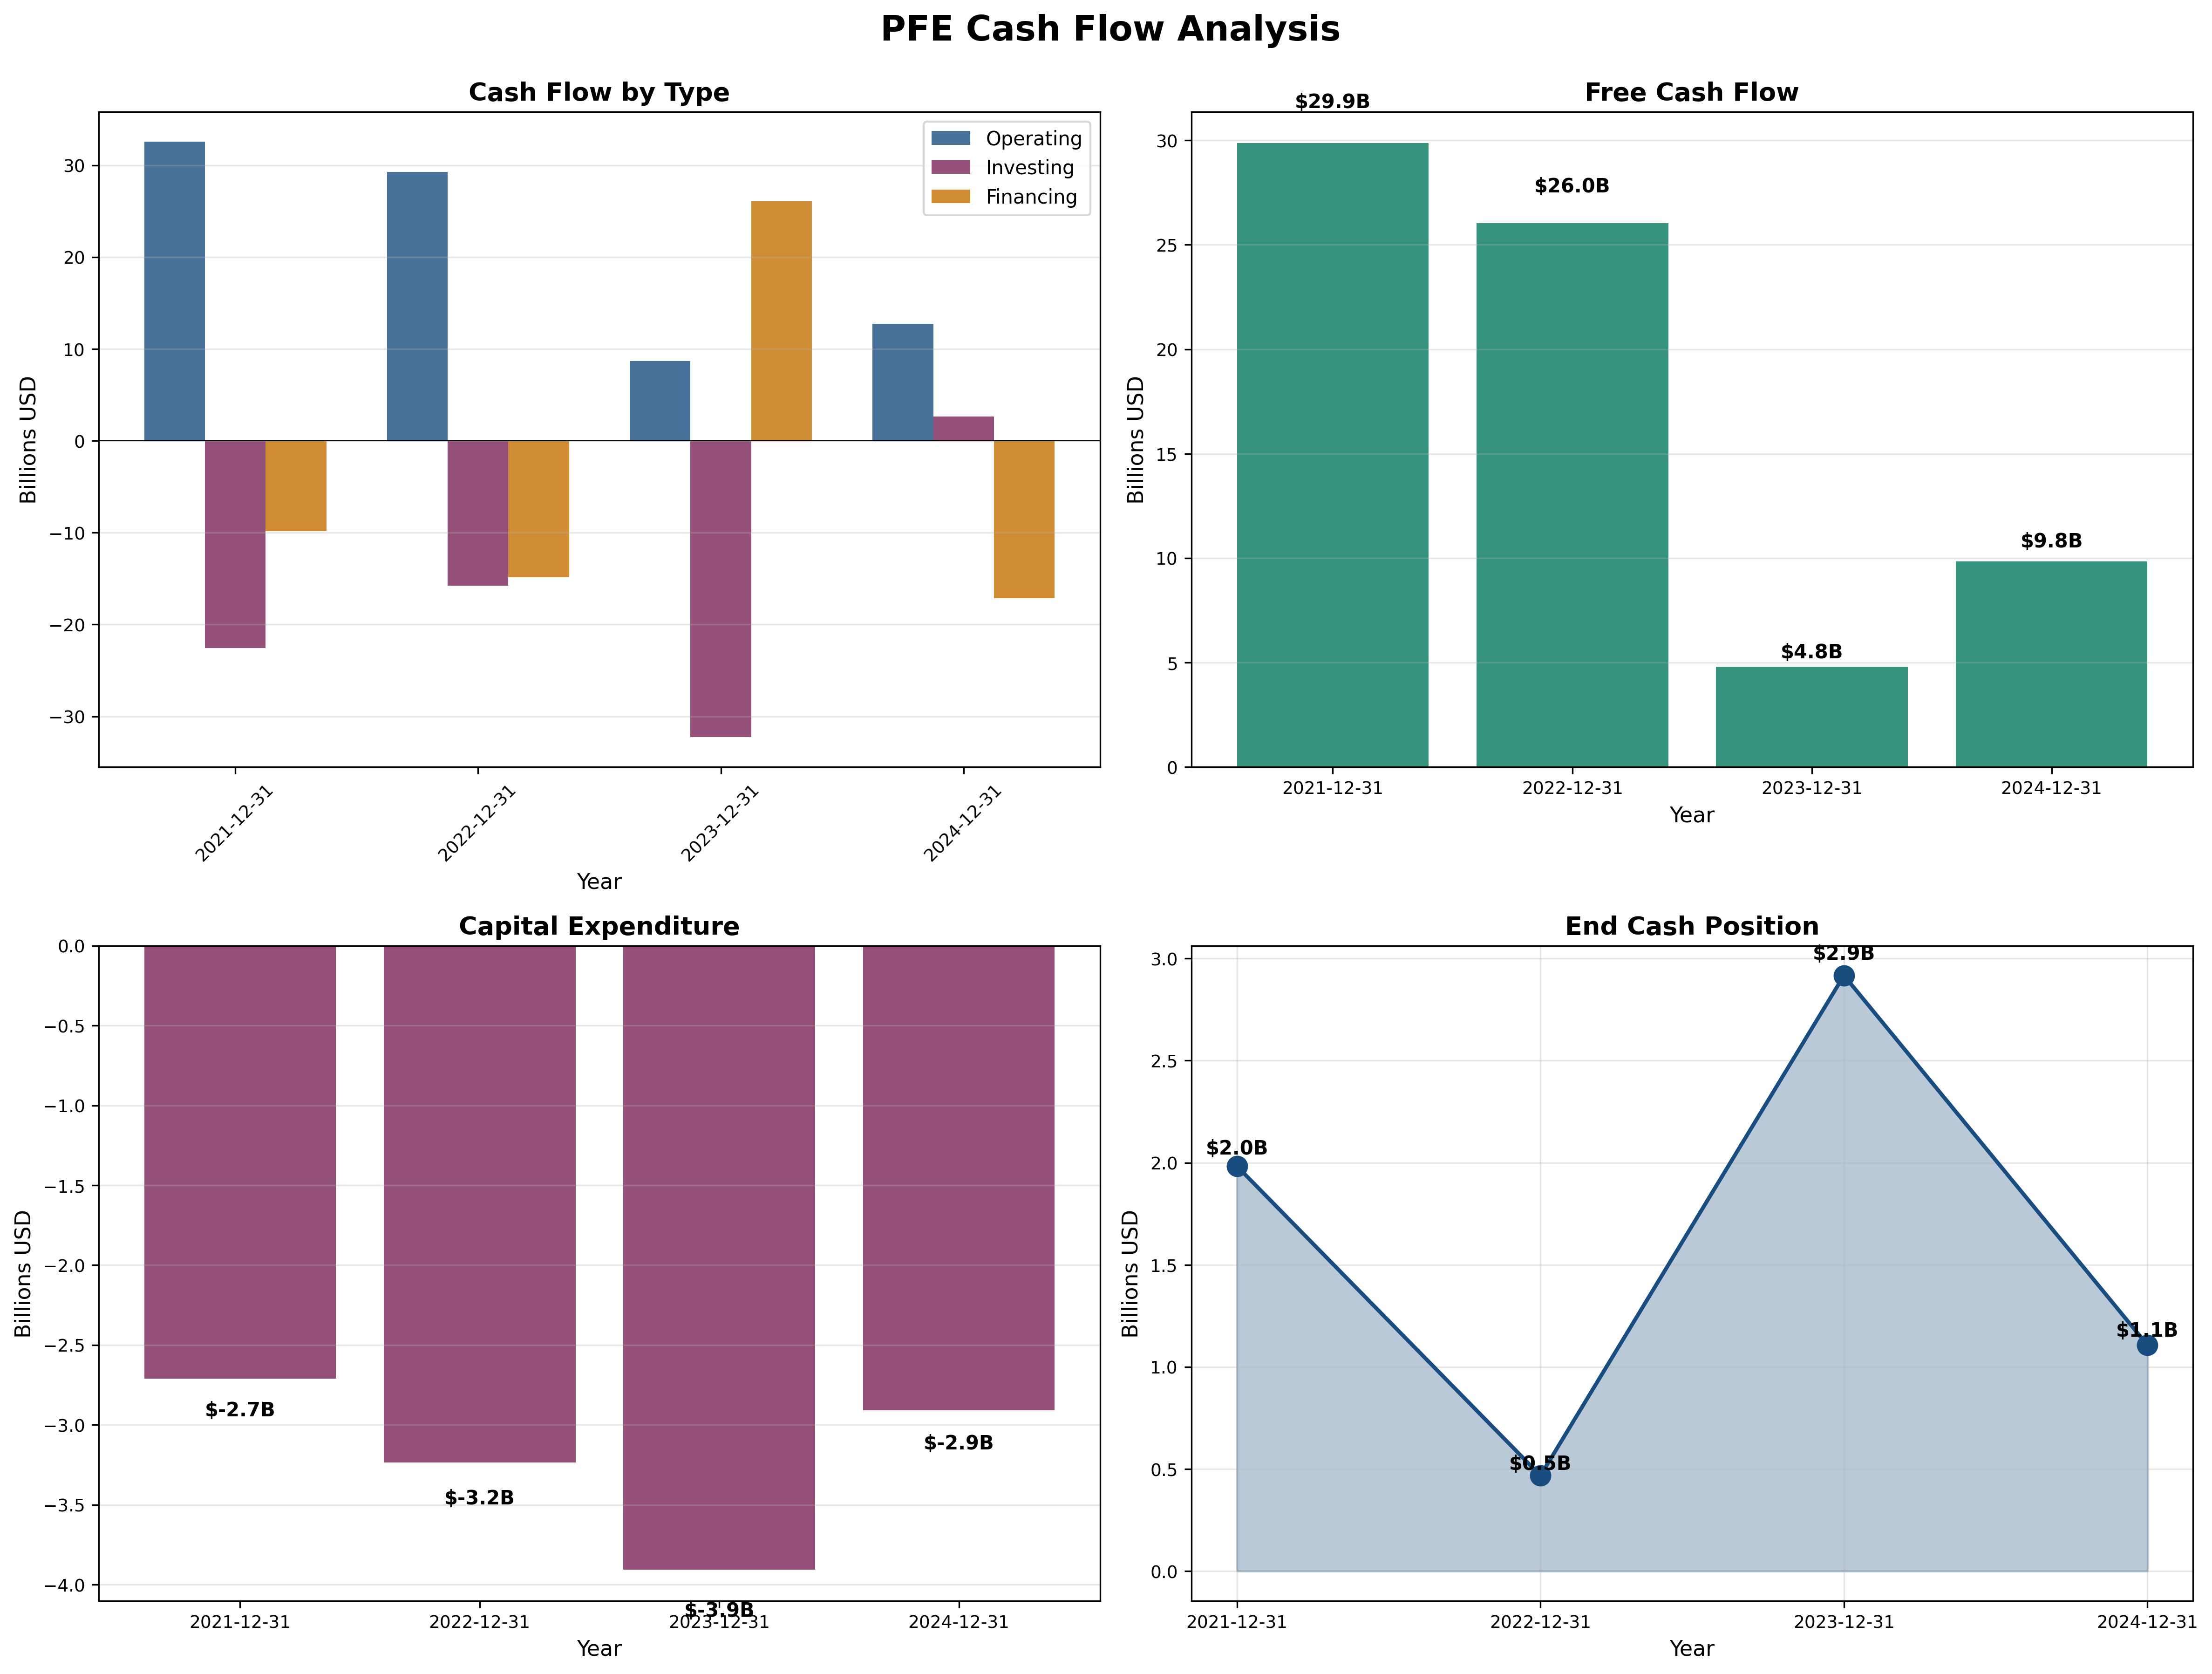
- Operating Cash Flow: $13B (2024), down from $33B (2021)
- FCF: $9.8B (2024) - recovering from $4.8B (2023) trough
- FCF Margin: 15% (2024)
- Capital Intensity: ~5% of revenue (low, asset-light model)
Assessment: Cash generation remains strong despite earnings normalization—excellent sign. FCF of ~$10B annually supports $9.4B dividend ($1.68/share, 6.4% yield) with minimal excess for debt reduction. Concern: Limited FCF growth runway without revenue acceleration.
Profitability Metrics
Returns:
- ROE: 9.1% (2024) vs 29.1% (2022) - target > 15% [❌]
- ROIC: Est. 7-8% (2024) - target > 12% [❌]
Assessment: Returns compressed dramatically as equity base remained stable (~$88B) while earnings normalized. Concerning that ROE is below cost of capital—value destruction if sustained. Need 50%+ earnings growth to restore acceptable returns.
Financial Ratios Analysis
Valuation Multiples:
- P/E: 17.7x (vs. historical avg: ~12x pre-COVID, industry: 15-20x)
- P/B: 1.69x (vs. historical avg: 2.5x)
- P/FCF: 13.9x (vs. historical avg: 15x)
- EV/EBITDA: ~9x (estimated)
PEG Ratio:
- P/E Ratio: 17.7x
- Growth Rate: Negative near-term, est. +5% long-term
- PEG: >3.0 (unattractive) based on realistic growth
Combined Metric:
- P/E × P/B = 29.9 (should be < 22.5) - FAIL
Assessment: Valuation appears reasonable on P/FCF (13.9x) and P/B (1.69x, below historical 2.5x average), suggesting market pessimism. However, P/E of 17.7x is expensive for low/no growth, making PEG unattractive. Not a screaming bargain but approaching reasonable value if turnaround materializes.
Capital Allocation Assessment
Management Quality Grade: C+
Key Factors:
- Insider Ownership: <1% (concerning - no skin in game)
- Buyback Discipline: Minimal recent buybacks (prioritizing debt reduction)
- Dividend: $1.68/share (6.4% yield), maintained through downturn—positive
- Acquisition Track Record: Mixed—Seagen acquisition ($43B) represents major bet on oncology pipeline; integration risk high
- Debt Management: Levered aggressively for M&A; now pausing to stabilize
Assessment: Management made bold acquisition moves (Seagen, Array, others) to rebuild pipeline but timing was poor—bought at peak prices while own stock collapsed. Dividend commitment is shareholder-friendly, but minimal insider ownership raises alignment concerns. Capital allocation grade improves if Seagen delivers; downgrades if integration disappoints.
Valuation & Intrinsic Value
Multiple Methods Summary:
| Method | Intrinsic Value | Weight |
|---|---|---|
| Owner Earnings (8.5+2g formula) | $30 | 30% |
| DCF (Conservative, 3% growth) | $32 | 30% |
| P/FCF Fair Value (15x FCF) | $28 | 20% |
| Valuation Number √(22.5×EPS×BVPS) | $35 | 20% |
Weighted Intrinsic Value: $31
Valuation Range:
- Conservative (Bear Case): $24 (if pipeline fails, dividend cut)
- Base Case: $31 (modest growth, dividend maintained)
- Optimistic (Bull Case): $38 (successful turnaround, multiple expansion)
Current Price: $26.43 Margin of Safety: ~15% vs Base Case (insufficient by traditional standards)
Assessment: Limited margin of safety at current price using conservative assumptions. Valuation is reasonable but not compelling—needs to decline to $22-23 range for traditional value investors or demonstrate earnings inflection for growth investors.
Risk Assessment
Key Risks (Top 3)
- Patent Cliff Risk: Eliquis (20% of revenue) loses exclusivity 2026-2028; could lose $5-8B annual revenue to generics
- Pipeline Execution Risk: New launches must offset $15B+ revenue losses from LOEs; Seagen integration critical but uncertain
- Dividend Sustainability Risk: 95%+ FCF payout ratio leaves no margin for error; any operational miss could force cut
Worst Case Scenario: Pipeline disappoints, forcing dividend cut to fund operations/debt service. Stock could fall to $18-20 (30% downside), trapping income investors who bought for yield.
Market Sentiment
Current Sentiment: Pessimism (not maximum pessimism)
Contrarian Signal: Market is pricing in modest expectations (flat-to-low growth), creating potential upside if execution improves. However, this isn’t “blood in the streets” maximum pessimism—stock hasn’t panicked, just deflated. True contrarian opportunity would be sub-$20 with forced selling.
Investment Recommendation
Current Assessment
Valuation: P/E = 17.7x vs Industry ~16x | P/FCF = 13.9x | EV/EBITDA ~9x Verdict: Fairly Valued (slight undervaluation)
Margin of Safety: ~15% ❌ Insufficient (<25% minimum standard)
Entry Zones
| Zone | Price | Action |
|---|---|---|
| 🟢 Strong Buy | < $22 | 35%+ margin |
| 🟡 Buy | $22-$25 | 25-30% margin |
| 🟠 Hold | $25-$28 | 15-20% margin |
| 🔴 Avoid | > $28 | < 10% margin |
Current Price: $26.43 → Recommendation: HOLD (accumulate on dips below $25)
Expected Returns
- Bull Case (+40%): Pipeline delivers, Seagen drives oncology growth, multiple re-rates to 20x as confidence returns → $37 target
- Base Case (+15%): Stabilization at current levels, dividend maintained, modest growth resumes → $30 target
- Bear Case (-30%): Pipeline disappoints, dividend cut forces selling, value trap confirmed → $18 target
Final Investment Conclusion
Overall Grade: B- (Below Average, Speculative Value)
Category Scores:
- Business Quality: 6/10 (good moat but narrowing, high patent cliff risk)
- Financial Strength: 5/10 (adequate but deteriorated, high debt)
- Management Quality: 5/10 (bold but risky M&A, low insider ownership)
- Valuation: 7/10 (reasonable but not compelling)
- Margin of Safety: 4/10 (insufficient at current price)
Final Verdict: HOLD / ACCUMULATE ON WEAKNESS
Investment Thesis Summary
Business Quality: Pfizer possesses a strong brand and regulatory moat but faces the perpetual challenge of pharmaceuticals—constant pipeline replenishment to offset patent expirations. The COVID windfall masked structural challenges; now management must deliver on $43B Seagen bet and other pipeline investments. This is not a simple, durable business—it requires ongoing R&D success, making it unsuitable for investors seeking “sleep well at night” quality.
Valuation: At $26.43, Pfizer offers modest undervaluation (~15% margin of safety) but falls short of the 30-40% margin traditional value investors demand. The 6.4% dividend yield is attractive but comes with sustainability risk given the 95%+ payout ratio. Valuation becomes compelling only below $22-23, where downside protection improves materially.
Risks: The primary risk is execution—pipeline failures, integration problems, or dividend cuts would trigger significant downside. Patent cliffs are inevitable (Eliquis represents $13B annual revenue declining post-2026), so new products must work. The high debt load ($63.6B) limits financial flexibility. This is decidedly NOT a low-risk investment.
Catalysts: Positive catalysts include successful Seagen integration, pipeline wins in oncology (multiple Phase 3 trials), margin expansion from cost cuts, and potential dividend growth resumption once deleveraging completes. Negative catalysts: pipeline failures, worse-than-expected generic erosion, dividend cut, or acquisition writedowns.
Framework Checklist
- ❌ Quantitative: Margin of safety inadequate (~15% vs 30%+ target)
- ⚠️ Moat: Moderate moat but narrowing; patent cliffs loom
- ❌ Management: Adequate but low insider ownership; risky M&A track record
- ⚠️ Contrarian: Some pessimism priced in but not maximum opportunity
- ✅ Simplicity: Business model is understandable (develop/sell drugs)
Would I hold this for 10+ years if the market closed tomorrow? No. Pharmaceuticals require constant monitoring of pipeline development, patent expirations, and regulatory changes. This is an active investment requiring vigilance, not a “set and forget” compounder. Suitable for turnaround/income investors willing to monitor quarterly, not for passive value investors seeking durable competitive advantages.
Investment Approach: For risk-tolerant investors, initiate small position at current levels ($26-27) with plans to average down if price declines to $22-24 range. Target 20-30% upside over 2-3 years as turnaround unfolds. Set stop-loss if dividend gets cut or Seagen integration falters. This is a “show me” story—management must prove they can navigate the patent cliff and rebuild growth. Patience required; catalyst timeline is 12-24 months minimum.