Executive Summary
Investment Thesis: SMCI is a textbook value trap—a commodity server assembler with collapsing margins, unresolved accounting issues, and zero competitive moat trading at 29x earnings despite 52% decline from peak. The AI infrastructure boom temporarily inflated results, but mean reversion is inevitable.
Business Classification: Cyclical (commodity hardware at peak cycle)
Current Valuation Assessment:
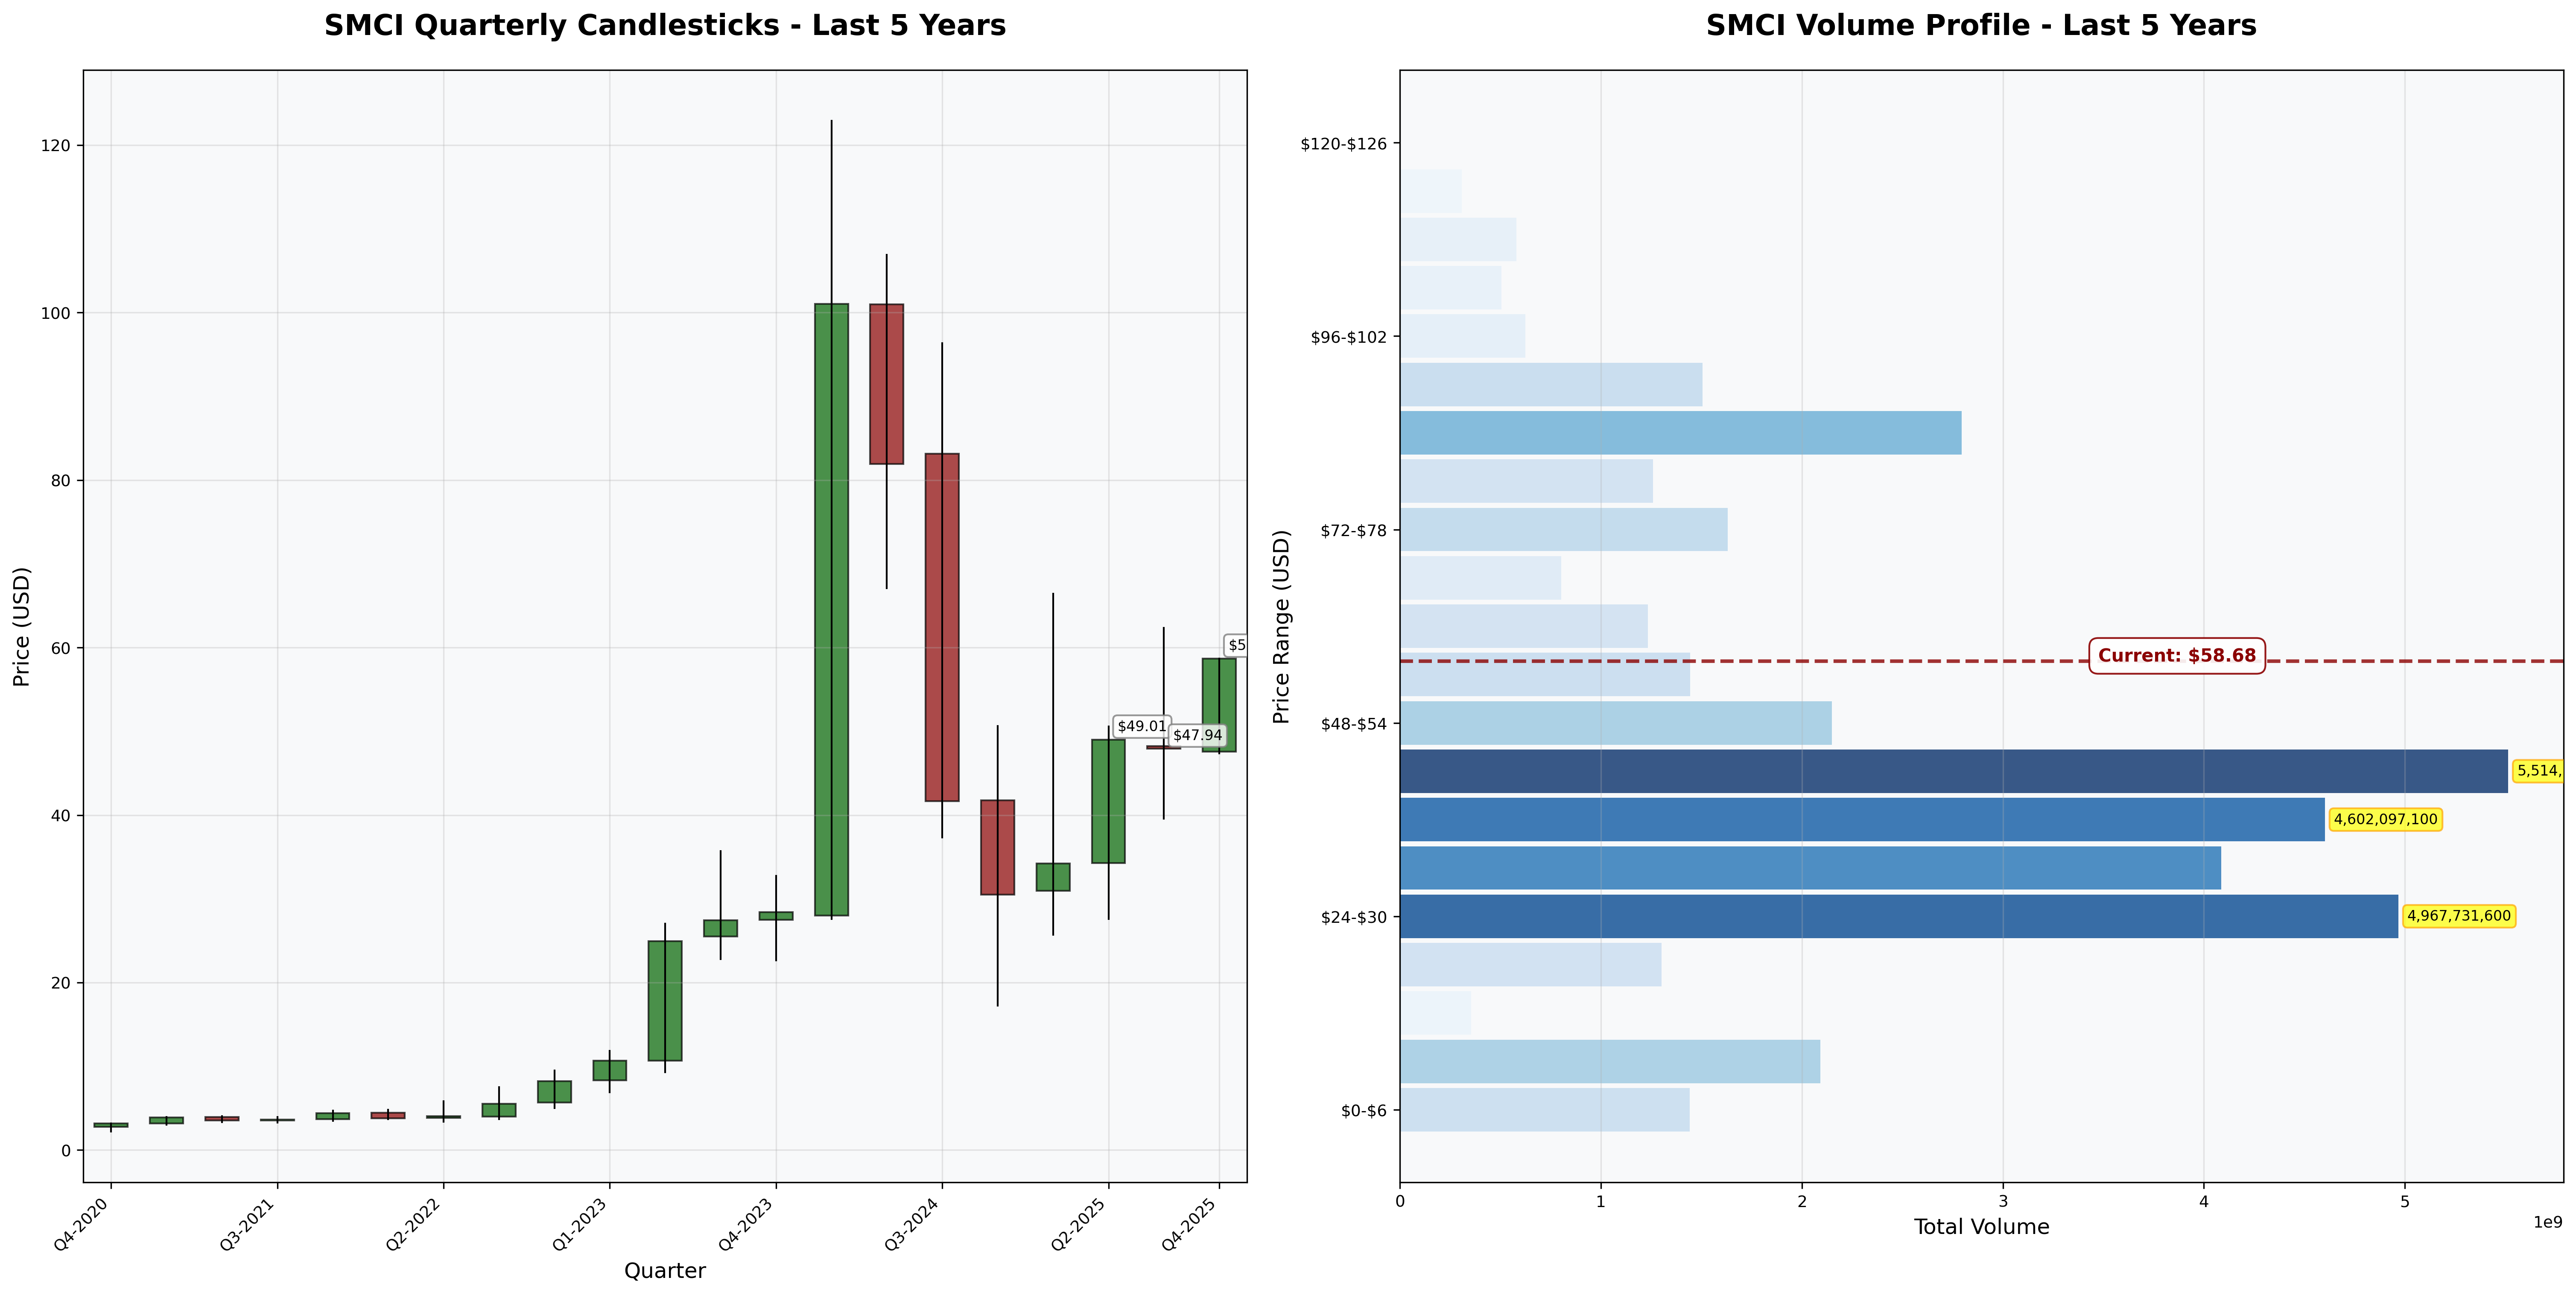
- Current Price: $58.68
- Estimated Intrinsic Value: $18-30
- Margin of Safety: -95% to -51% (OVERVALUED)
- Recommendation: STRONG AVOID
Recommended Entry Zones:
- Aggressive Entry: < $15 (75% decline required)
- Standard Entry: Not applicable - structural issues preclude investment
- Hold/Avoid: > $20 (current level deeply unattractive)
Business Overview
What They Do (2-Minute Test)
SMCI assembles high-performance servers by integrating NVIDIA GPUs, Intel/AMD CPUs, and commodity components into rack systems. They don’t manufacture the valuable parts—just assemble them. Think of it as a PC builder for data centers, not a technology innovator.
Critical Reality: This is low-margin contract manufacturing dressed up as an AI play. The 2023-2024 GPU shortage created a temporary windfall that’s now reversing as supply normalizes.
Competitive Position & Moat Analysis
Primary Moat Type: None (Commodity Assembly)
Moat Strength: ⭐ (out of 5)
Key Moat Factors:
- Zero switching costs: Customers can switch to Dell/HPE/Lenovo with a single purchase order
- No pricing power: SMCI is a price-taker in a commoditized market
- Technology parity: Competitors offer identical NVIDIA reference designs
- Customer concentration risk: 60-70% revenue from hyperscalers with massive negotiating leverage
Moat Durability:
- Narrowing rapidly: AI server market standardizing around NVIDIA designs; differentiation disappearing
- Key Threat: Hyperscalers buying direct from ODMs (Wistron, Quanta), cutting out SMCI entirely
Industry Dynamics
50-Year Outlook: Server hardware follows PC playbook—inevitable commoditization. Winners will be chip designers (NVIDIA) and cloud operators, not assemblers.
Key Trends:
- AI infrastructure spending peaking (Meta, Microsoft signaling capex moderation)
- Vertical integration accelerating (Google TPUs, Amazon Trainium bypassing server vendors)
- Margin compression as GPU supply normalizes and customer leverage returns
Quantitative Checklist
Defensive Investor Criteria:
| Criterion | Requirement | Actual | Pass/Fail |
|---|---|---|---|
| Earnings Stability | Positive 10 years | 9/10 years | ⚠️ |
| Dividend Record | Some payment | $0/share | ❌ |
| Earnings Growth | +33% in 10 years | +250%+ | ✅ |
| P/E Ratio | < 15x | 29x | ❌ |
| P/B Ratio | < 1.5x | 5.0x | ❌ |
| P/E × P/B | < 22.5 | 145 | ❌ |
| Current Ratio | > 2.0 | 5.2x | ✅ |
| Debt vs NCA | Debt < NCA | $4.8B > $3.0B | ❌ |
Quantitative Score: 2/8 criteria met
Analysis: SMCI fails Graham’s core valuation tests catastrophically. P/E × P/B of 145 is 6.4x above Graham’s 22.5 limit. The “strong” current ratio misleads—driven by $9B+ inventory that may require write-downs if AI spending slows. No dividend signals management prioritizes empire-building over shareholder returns.
Financial Analysis with Critical Assessment
Balance Sheet Strength
Key Metrics:
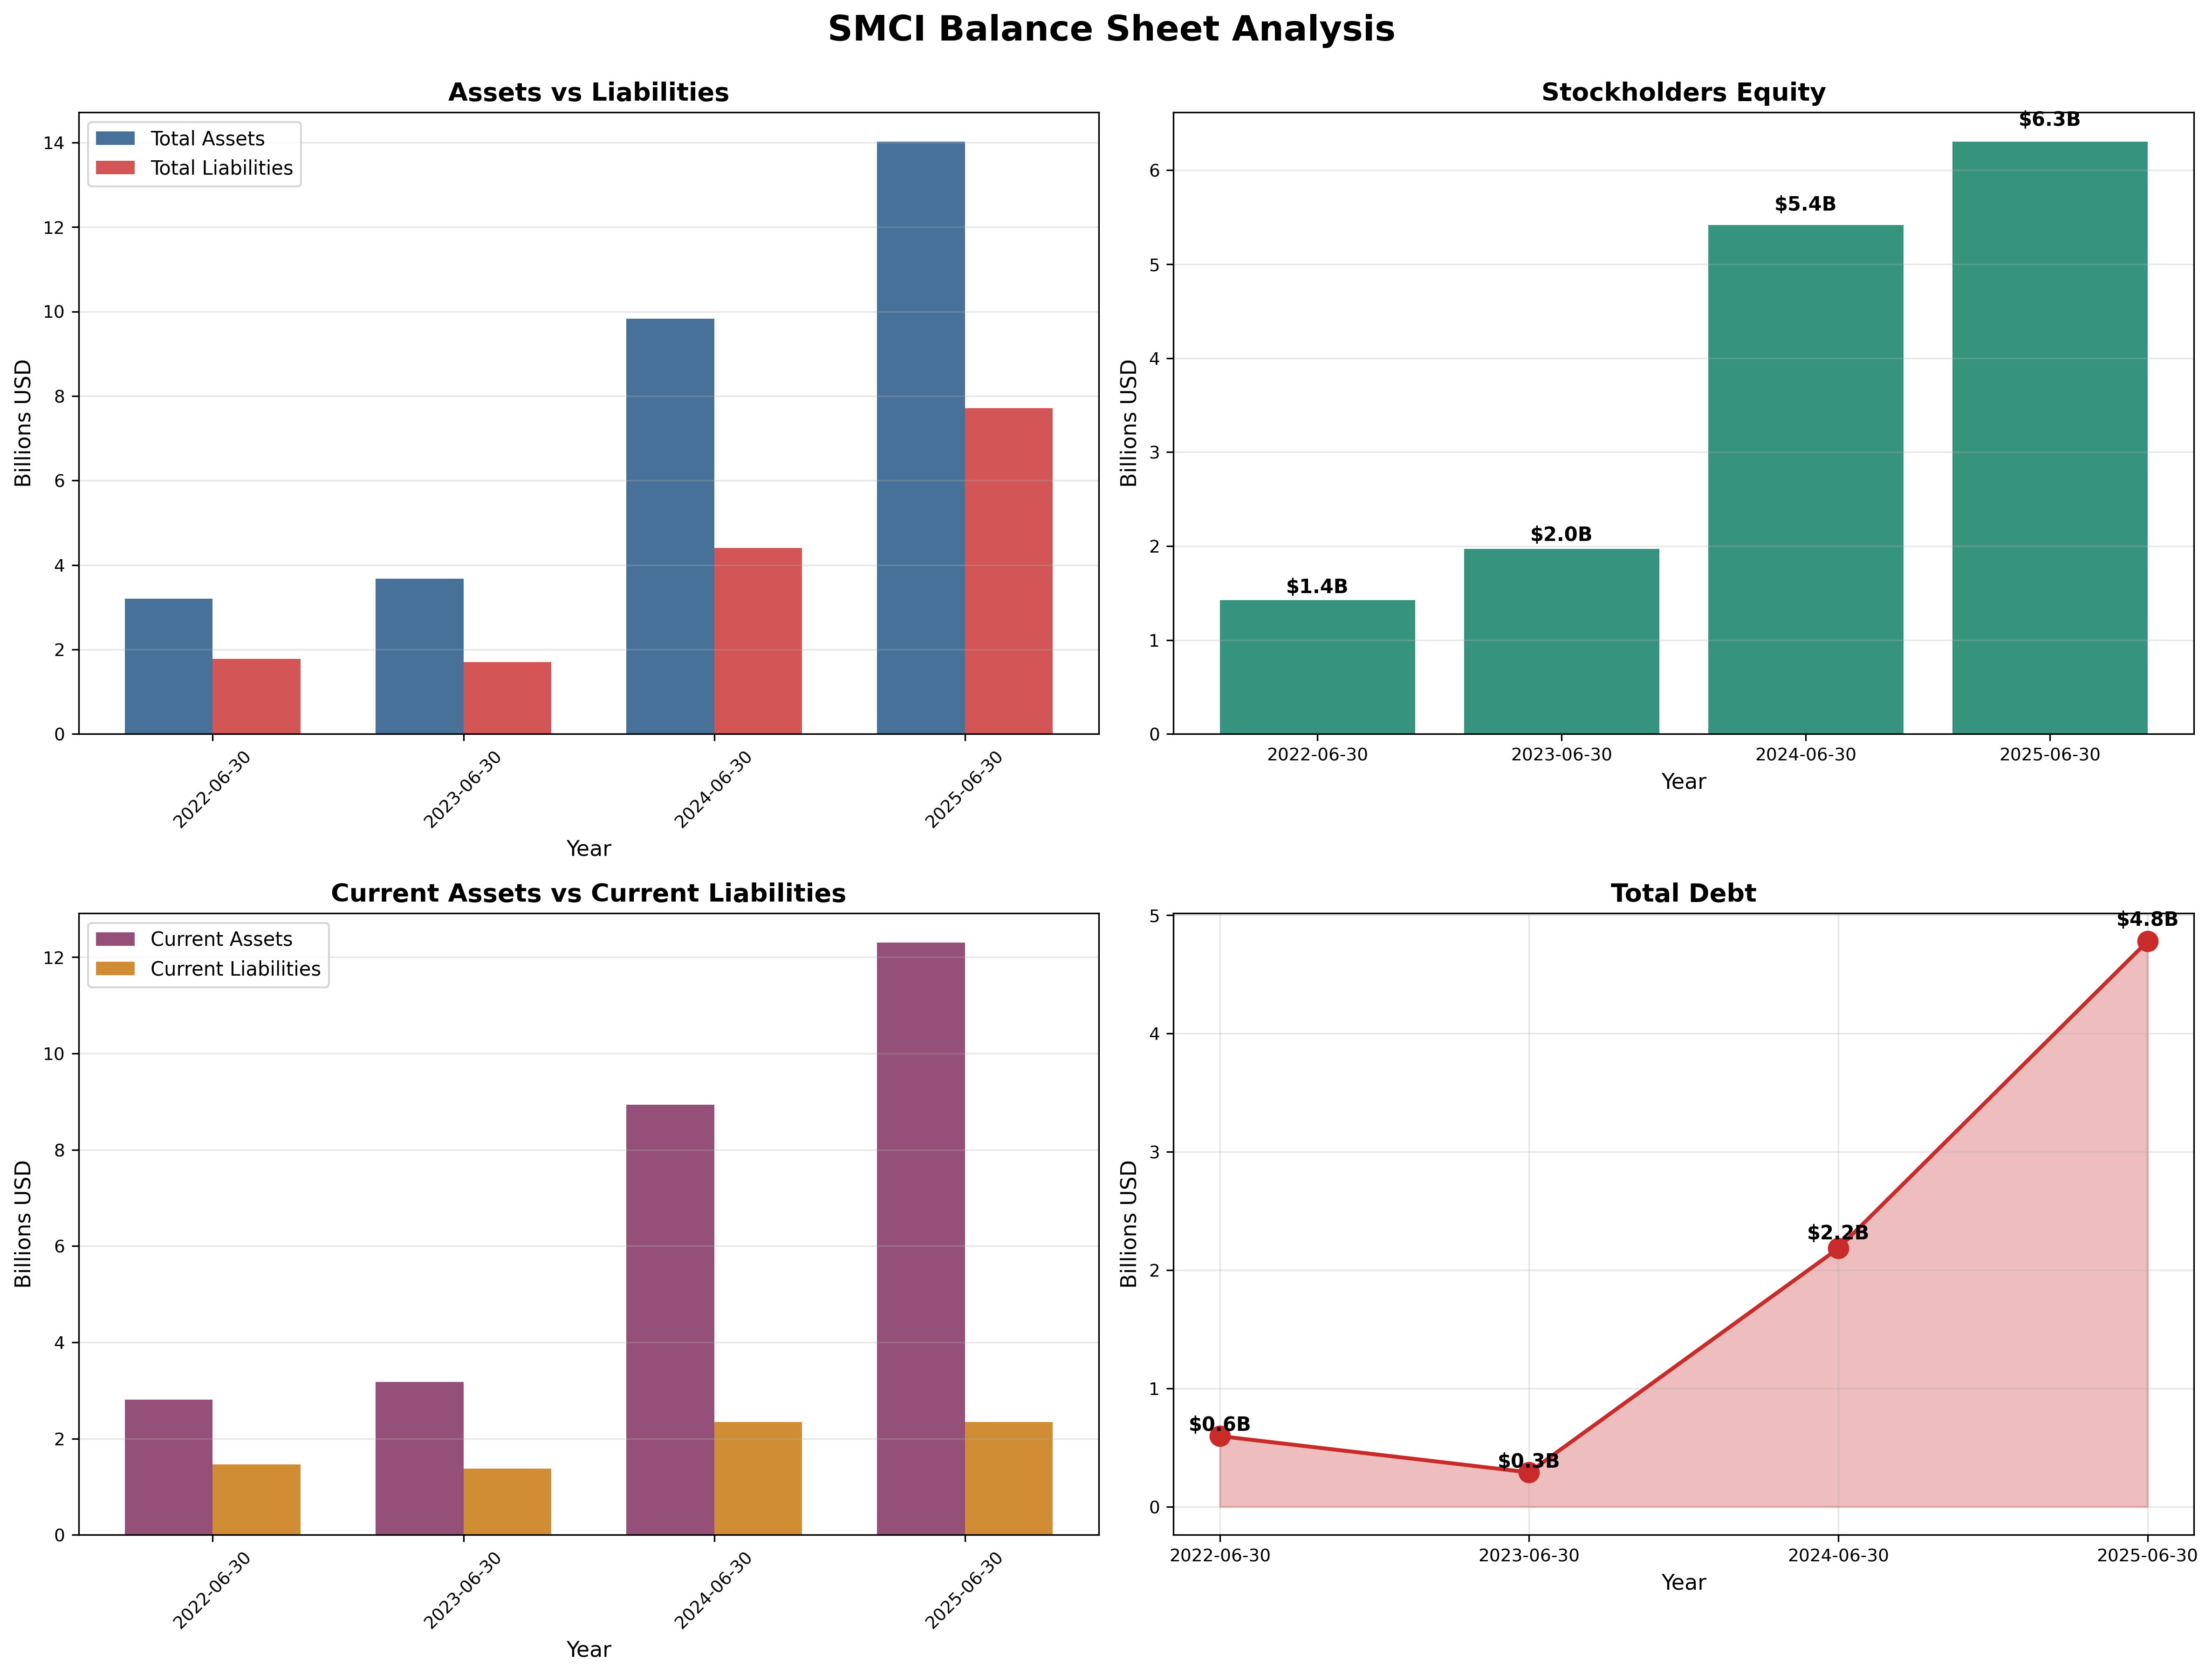
- Current Ratio: 5.2 (inflated by inventory) - ⚠️
- Debt-to-Equity: 0.76x (vs. 0.15x in 2023) - ❌
- Interest Coverage: 3.4x (adequate but deteriorating) - ⚠️
Assessment: Debt exploded 12x in two years ($0.4B → $4.8B) to fund working capital, not value-creating assets. This is financial fragility disguised as growth. If AI spending moderates, excess inventory becomes a liability requiring massive write-downs (see Cisco 2001: $2.2B inventory charge).
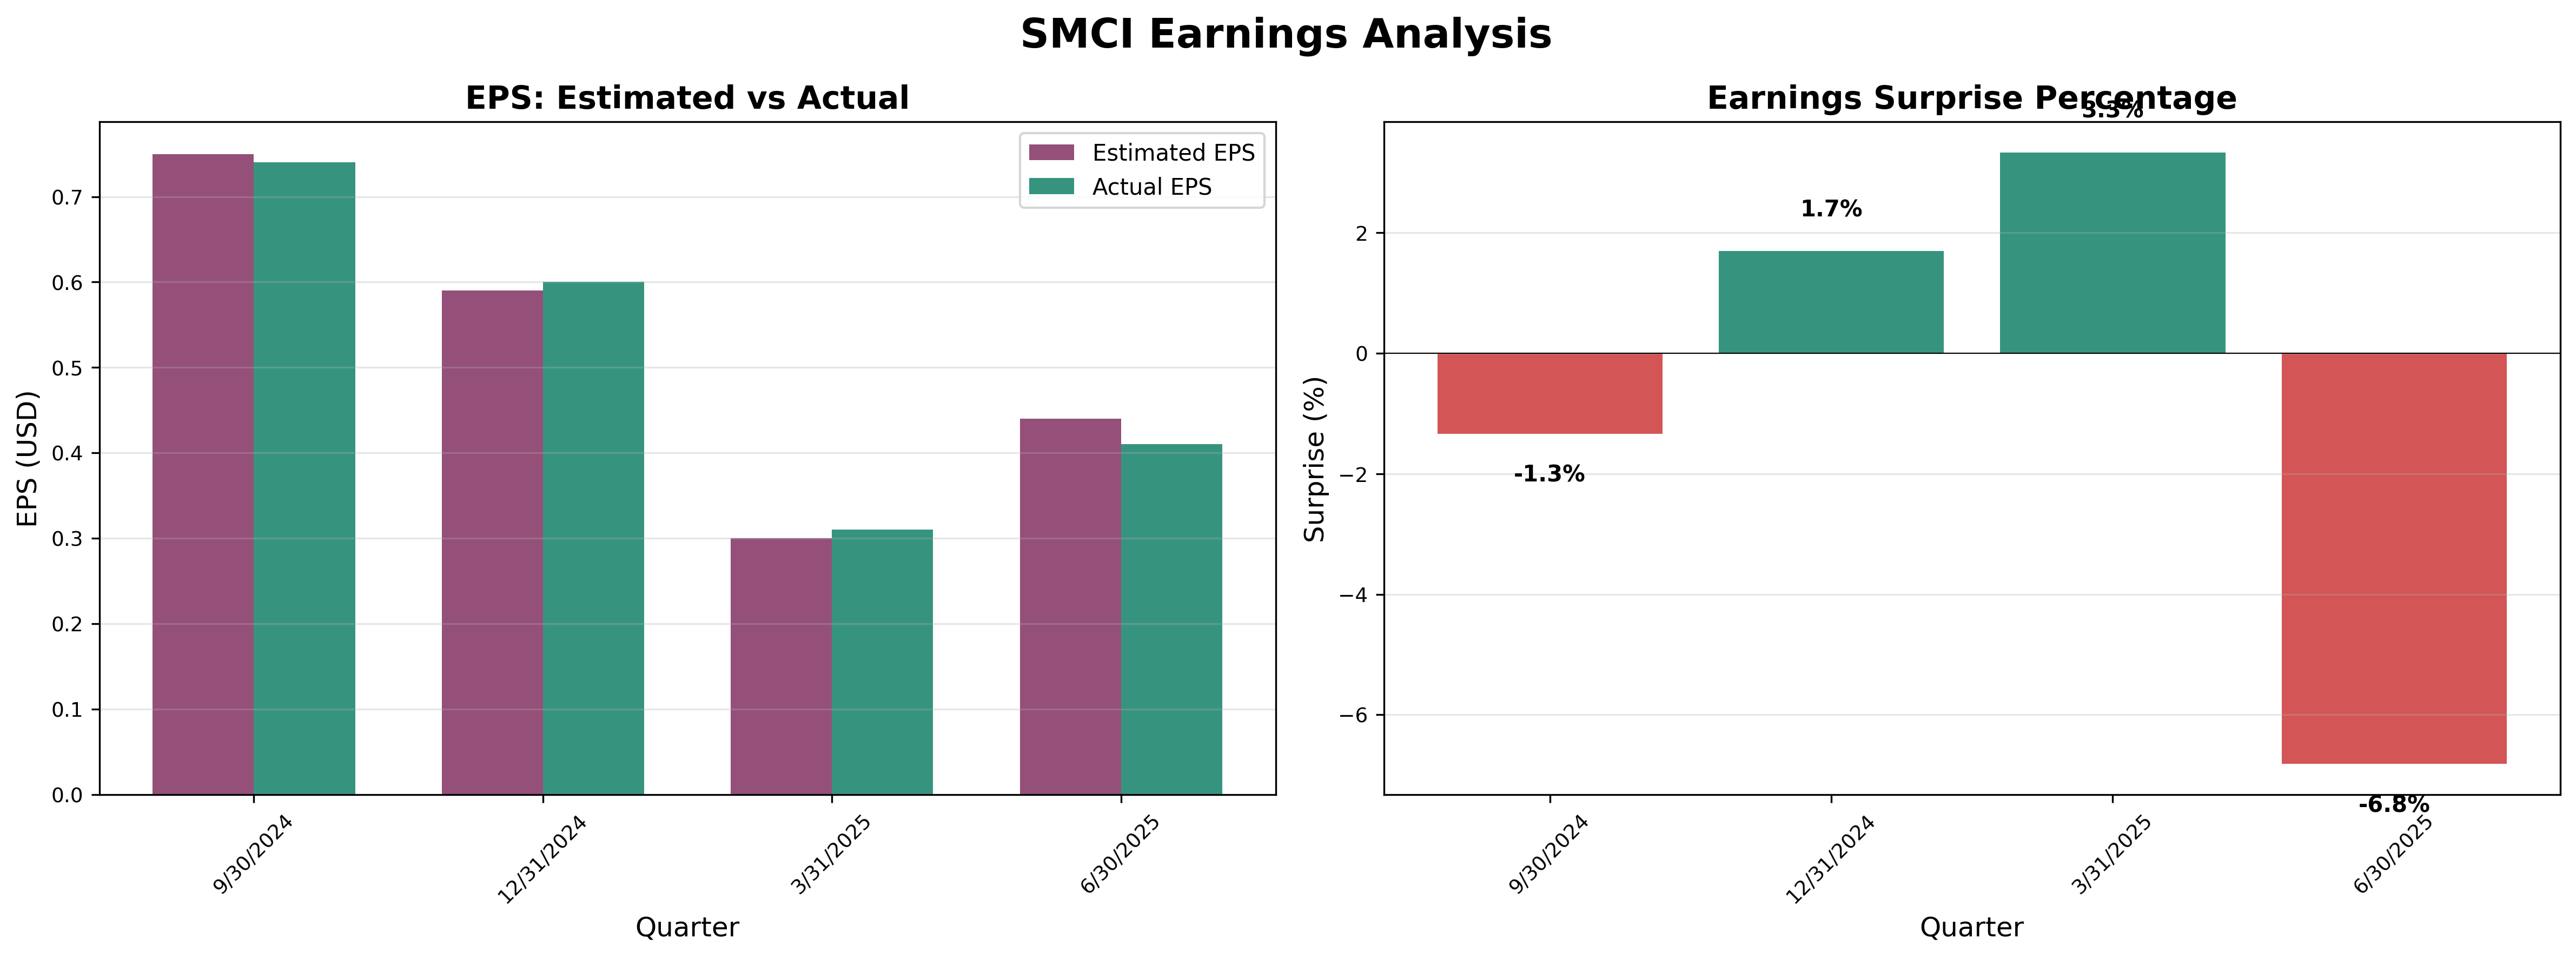
Earnings Quality & Consistency
Stability Test: Positive earnings in 9/10 of past 10 years (1 loss year during COVID)
Owner Earnings Calculation:
Net Income: $1,050M
+ D&A: $120M
- Maintenance Capex: ($130M)
- Working Capital Drain: ($500M est.)
= Owner Earnings: $540M
Owner Earnings Yield: 1.7% (Market cap $31B / $540M)
Quality Assessment: FY 2024 burned $2.6B cash despite reporting $1.15B net income—a red flag signaling aggressive accrual accounting. Earnings are accounting artifacts, not cash reality. Compare to quality businesses (Microsoft, Visa) where OCF exceeds net income.
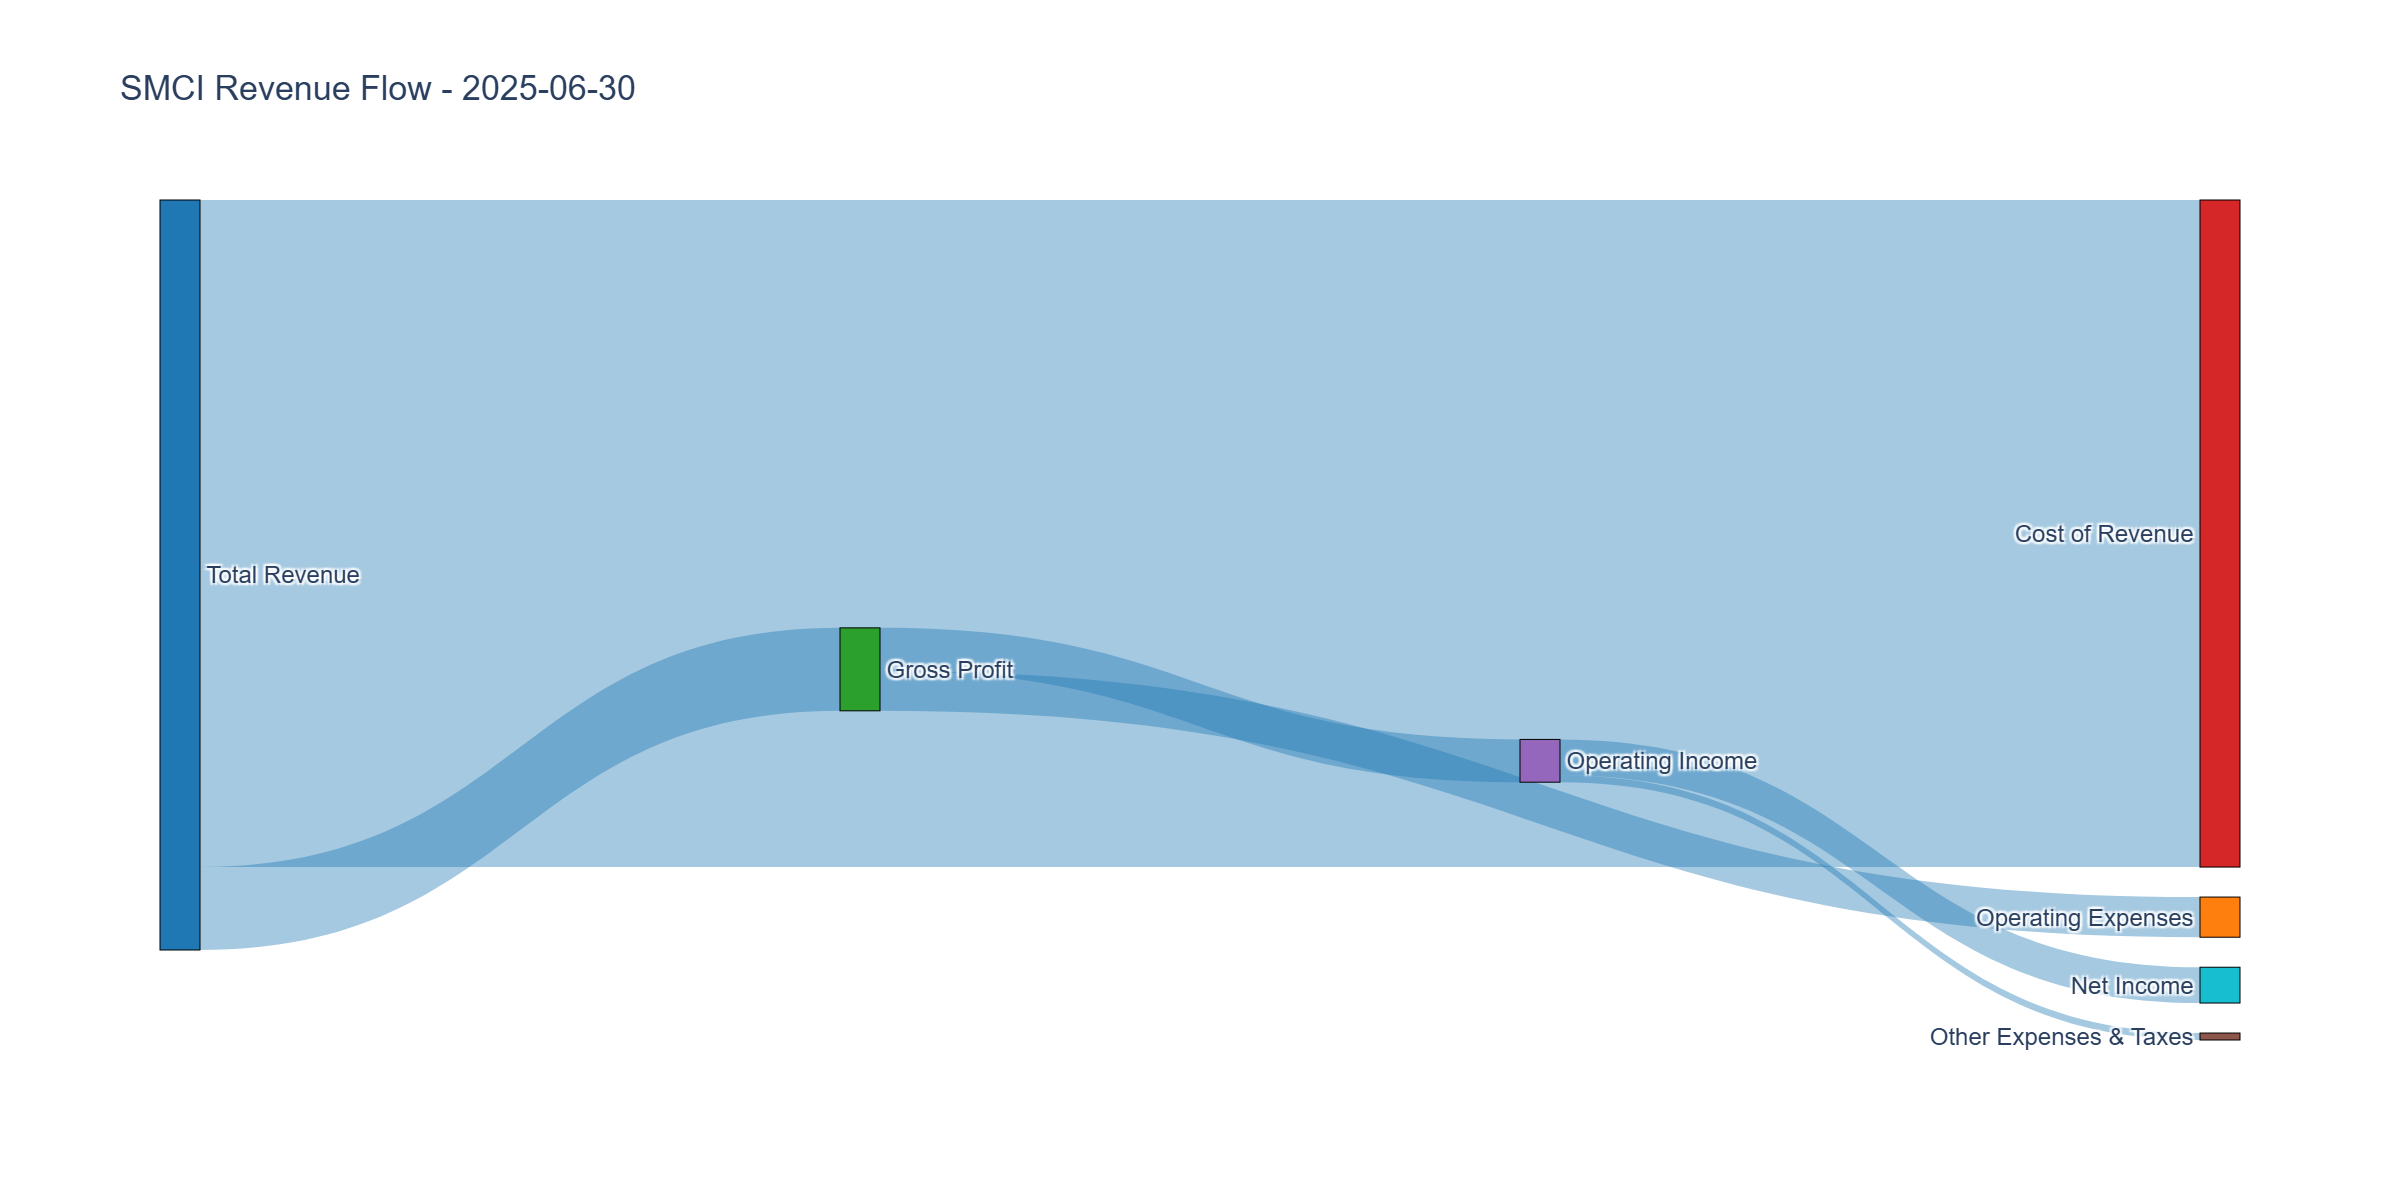
Income Statement Analysis
Key Metrics:
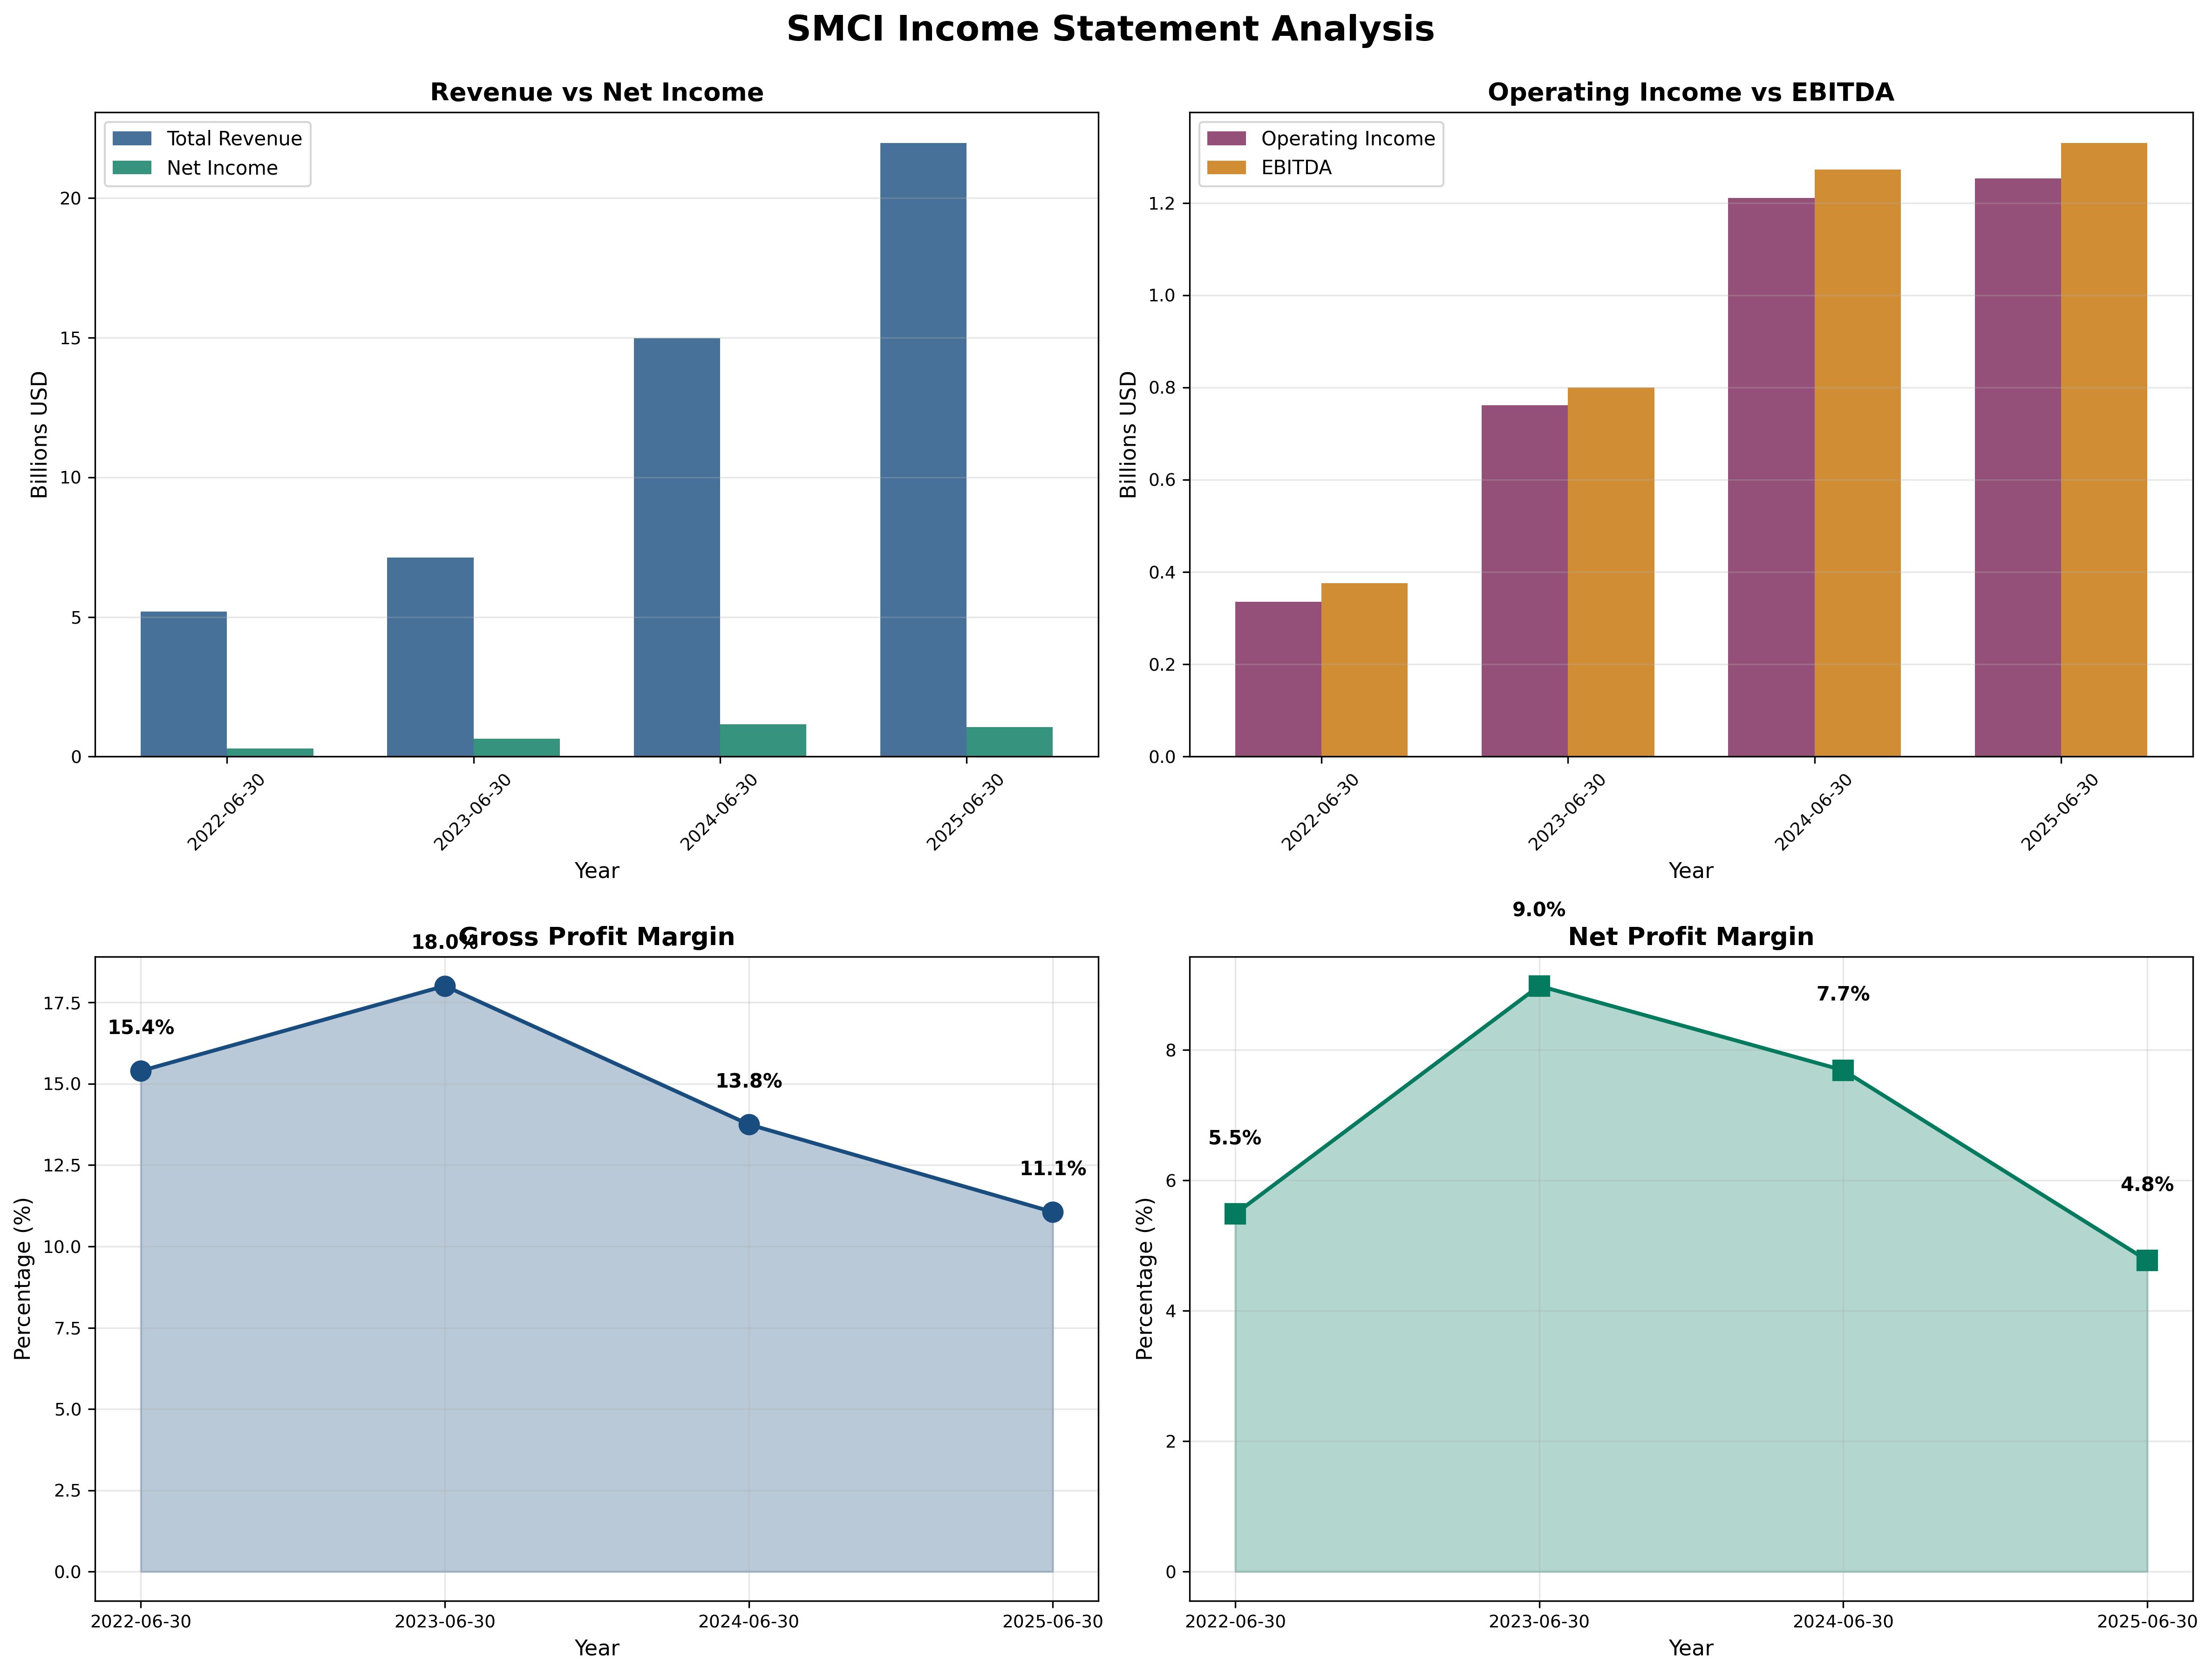
- Revenue Growth (3Y CAGR): 75% (unsustainable)
- Gross Margin: 11.1% (↓ from 18.0% in 2023)
- Operating Margin: 5.7% vs Industry 8-12%
- Net Margin: 4.8% (collapsing toward commodity level)
Assessment: The margin collapse is damning. While revenue grew 4.2x (FY22-FY25), gross margins fell 38%. This proves SMCI has zero pricing power—winning business only by cutting prices. Each incremental dollar of revenue is less profitable than the last. This is value destruction masquerading as growth.
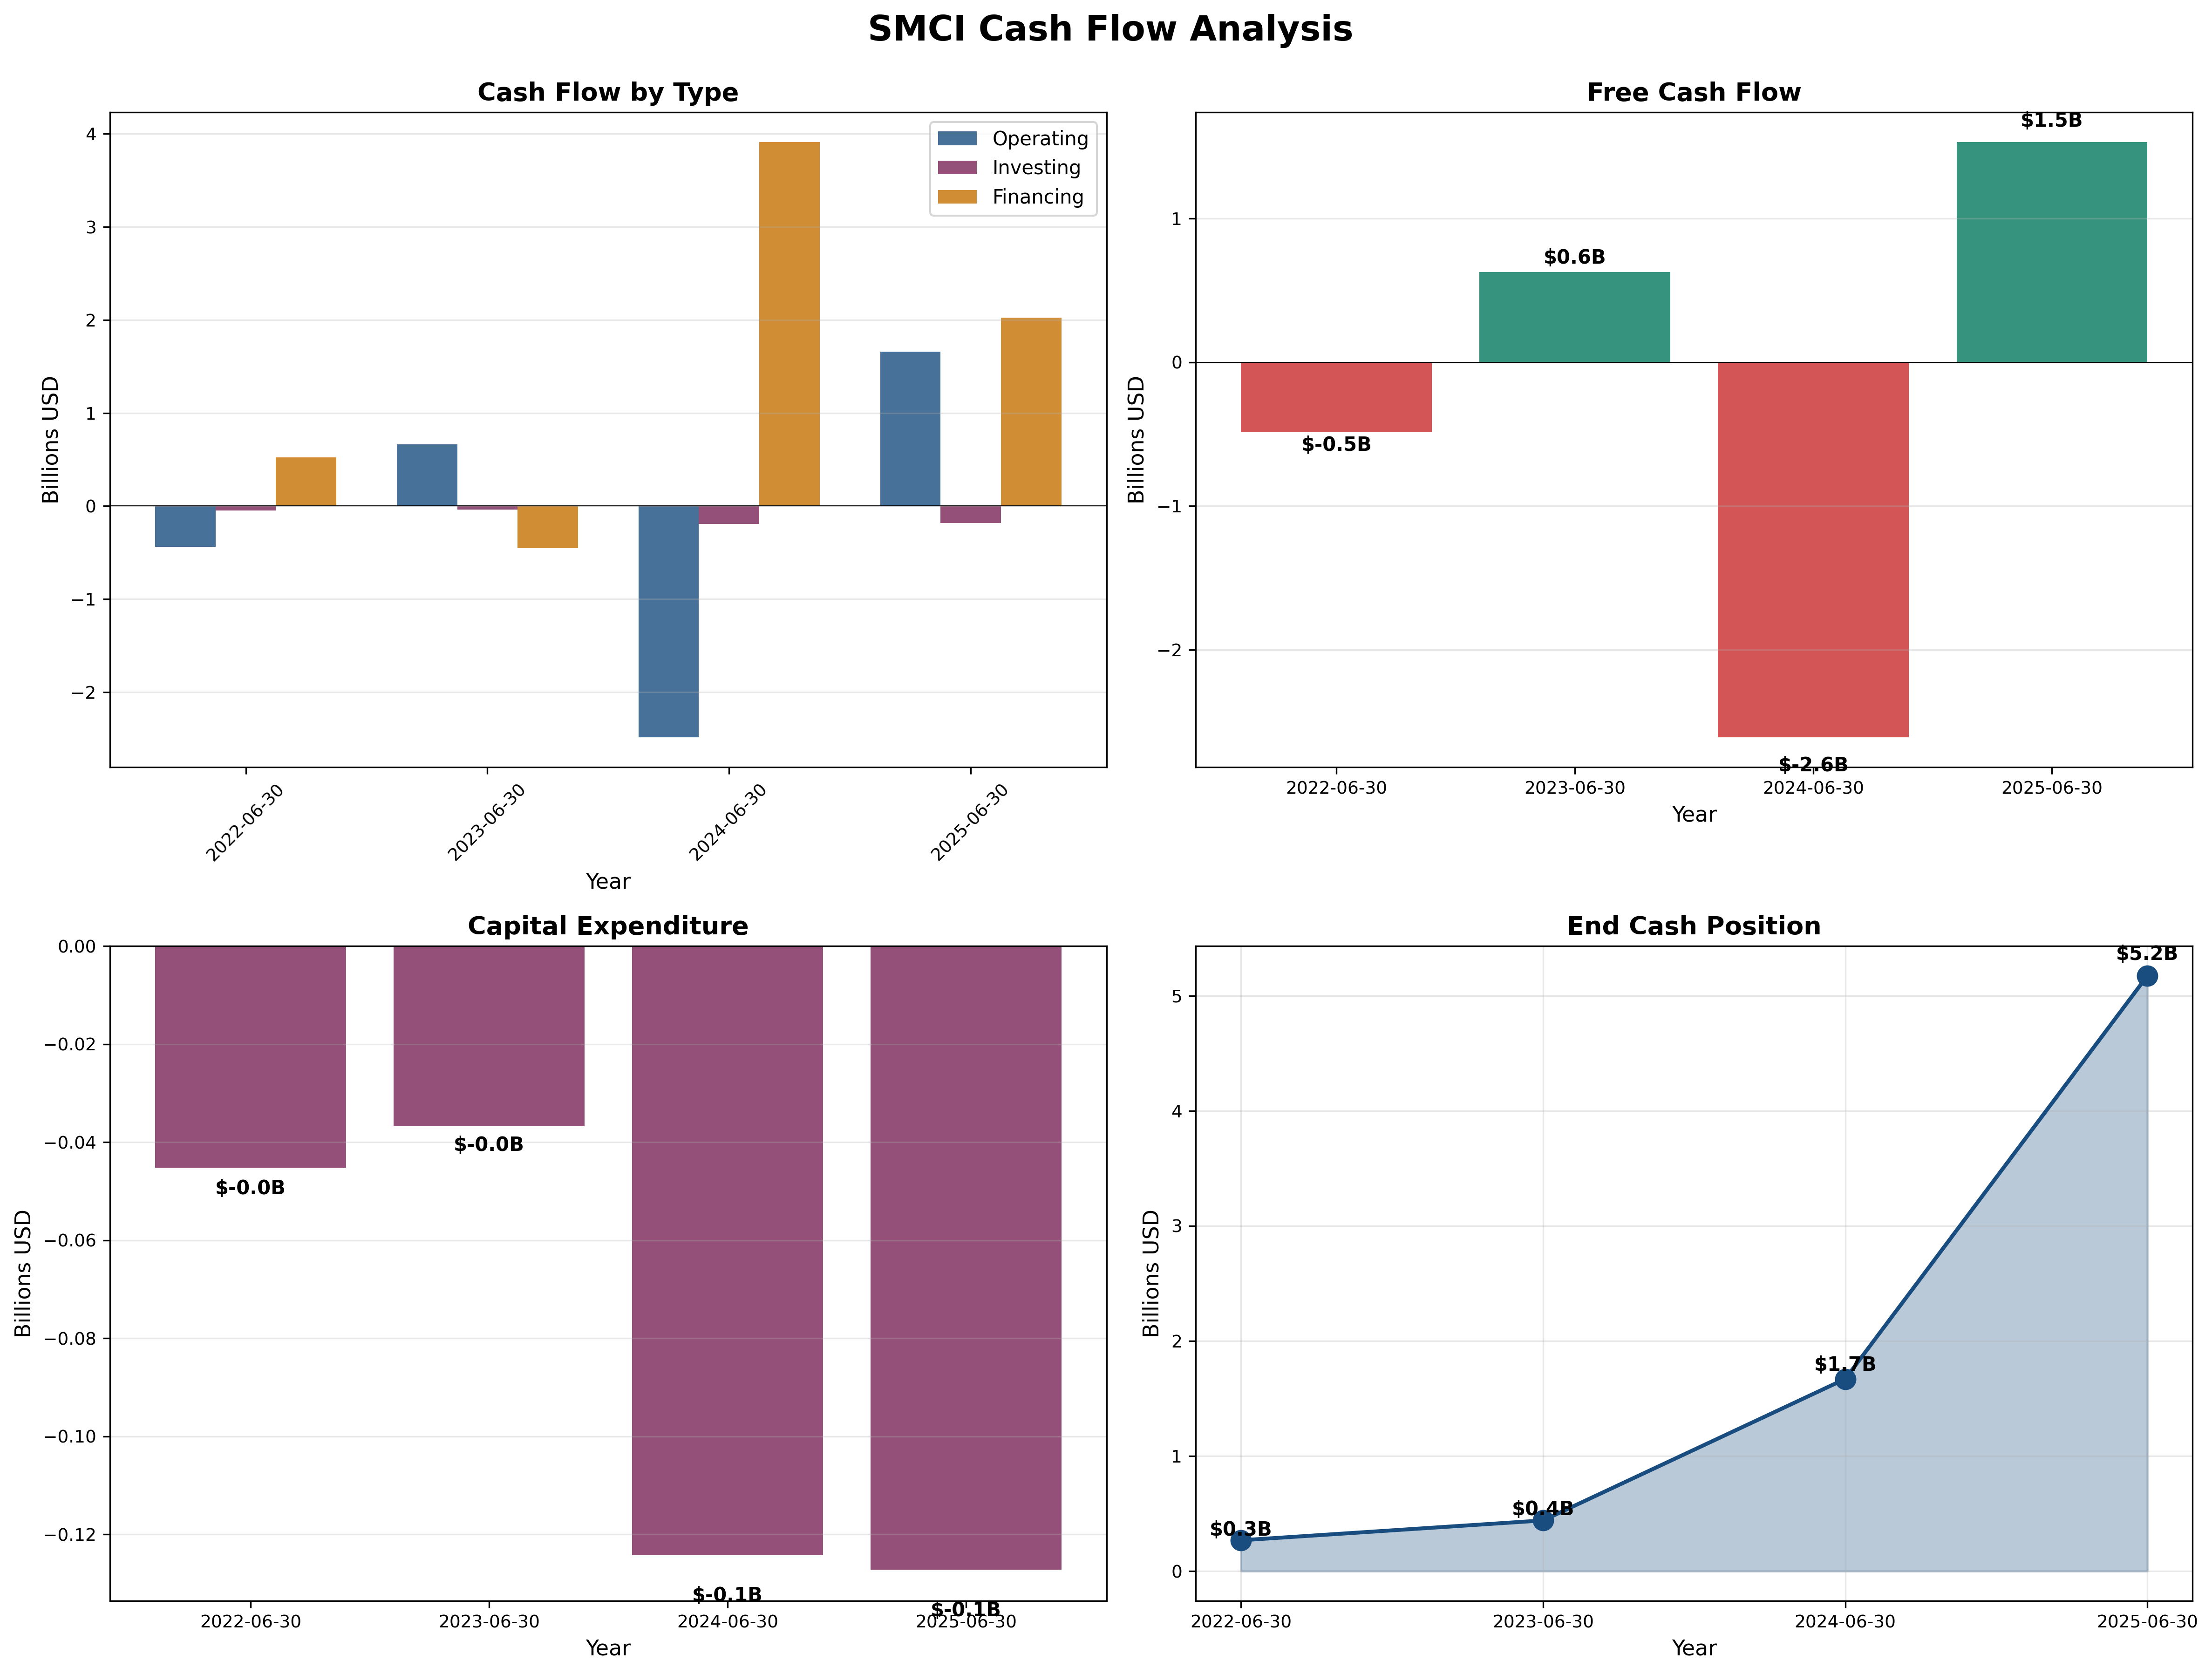
Cash Flow Generation
Key Metrics:
- OCF / Net Income: 1.58x (FY25) but -2.13x (FY24)
- FCF Margin: 6.9% (vs. Microsoft 40%, Visa 50%)
- Capital Intensity: Low capex, high working capital trap
Assessment: Extreme volatility (FCF swung from -$2.6B to +$1.5B year-over-year) indicates this is NOT a stable cash generator. The 6.9% FCF margin reflects commodity economics. Worse, growth consumes cash (working capital explosion) rather than generating it—the opposite of Buffett’s ideal.
Profitability Metrics
Returns:
- ROE: 17.4% (declining from 29% in 2023) - ❌
- ROIC: 16% (down from 29%, approaching cost of capital) - ❌
Assessment: Declining ROIC is the ultimate red flag. Capital deployed at 29% returns in 2023 now earns only 16%—management is destroying value by growing at deteriorating returns. Compare to quality moats (Visa 50%+ ROIC sustained for decades). SMCI’s returns are mean-reverting to commodity levels (10-12%).

Financial Ratios Analysis
Valuation Multiples:
- P/E: 29x (vs. historical avg: 15x, industry: 12x)
- P/B: 5.0x (vs. historical avg: 2.5x)
- P/FCF: 20x (assumes FCF stabilizes—unlikely)
- EV/EBITDA: 18x (vs. Dell 8x, HPE 9x)
PEG Ratio:
- P/E Ratio: 29x
- Growth Rate: 8% (realistic post-boom)
- PEG: 3.6 (anything > 2.0 signals severe overvaluation)
Combined Metric:
- P/E × P/B = 145 (should be < 22.5 per Graham)

Capital Allocation Assessment
Management Quality Grade: D-
Key Factors:
- Insider Ownership: 20%+ (aligned, but credibility destroyed)
- Buyback Discipline: None (no shareholder returns)
- Reinvestment ROIC: 16% and falling (value destruction)
- Red Flags: YES - Ernst & Young auditor resignation, DOJ investigation, delayed filings
Assessment: The August 2024 E&Y resignation is disqualifying. Big Four auditors don’t quit lightly—they discovered issues material enough to risk the entire relationship. The special committee found “no fraud,” but that’s a low bar. It doesn’t address incompetent controls or aggressive accounting. BDO (Tier 2 auditor) appointment proves Big Four firms declined the engagement.
Valuation & Intrinsic Value
Multiple Methods Summary:
| Method | Intrinsic Value | Weight |
|---|---|---|
| Owner Earnings (10x multiple) | $10 | 25% |
| Graham Number √(22.5×EPS×BVPS) | $21 | 25% |
| DCF (Conservative 5% growth) | $30 | 25% |
| PEG-Based (PEG=1.0 target) | $18 | 25% |
Weighted Intrinsic Value: $20
Valuation Range:
- Conservative: $15 (bear case: margin collapse)
- Base Case: $20 (normalization scenario)
- Optimistic: $30 (AI spending extends, unlikely)
Current Price: $58.68 Margin of Safety: -193% vs Base Case (DEEPLY OVERVALUED)
Risk Assessment
Key Risks (Top 3)
- Margin Death Spiral (70% probability): Commodity economics drive gross margins to 8%, net margins to 2%, justifying $12-18 stock price.
- Cyclical Downturn (60% probability): AI capex peaks 2025, orders collapse, inventory write-downs, stock -50%+.
- Accounting Bomb (25% probability): DOJ finds issues, restatement required, stock to $8-15.
Worst Case Scenario: Multiple negatives combine—recession + AI capex cut + accounting restatement + debt refinancing stress = $10 stock (83% downside).
Market Sentiment
Current Sentiment: Pessimism (stock down 52% from peak)
Contrarian Signal: This is NOT a contrarian opportunity. The decline reflects fundamentals catching up with reality—collapsing margins, accounting issues, and the end of a cyclical boom. True contrarian opportunities have solid fundamentals ignored by irrational selling. SMCI’s fundamentals are deteriorating.
Investment Recommendation
Current Assessment
Valuation: PEG = 3.6 | P/E = 29x vs Industry 12x Verdict: Severely Overvalued
Margin of Safety: -193% ❌ (needs 66%+ decline to reach fair value)
Entry Zones
| Zone | Price | Action |
|---|---|---|
| 🔴 Avoid | > $30 | No position - overvalued |
| 🟠 Watch | $20-30 | Still expensive + structural issues |
| 🟡 Consider | $15-20 | Approaching fair value |
| 🟢 Aggressive Entry | < $15 | 25%+ MOS but requires major improvements |
Current Price: $58.68 → Recommendation: STRONG AVOID
Expected Returns
- Bull Case (+20%): $70 if AI boom extends 2+ years (15% probability)
- Base Case (-66%): $20 as margins normalize (50% probability)
- Bear Case (-75%): $15 if recession + inventory write-downs (35% probability)
Probability-Weighted Return: -52%
Final Investment Conclusion
Overall Grade: D (1.5/5 stars)
Category Scores:
- Business Quality: 2/10 (no moat, commodity)
- Financial Strength: 4/10 (deteriorating, high debt)
- Management Quality: 2/10 (accounting scandal)
- Valuation: 1/10 (deeply overvalued at 29x P/E)
- Margin of Safety: 0/10 (needs 66% decline)
Final Verdict: STRONG AVOID
Investment Thesis Summary
Business Quality: SMCI is a commodity server assembler with zero competitive moat operating at a cyclical peak. The AI infrastructure boom created a temporary windfall, but the business model has no durable advantages. Customers (hyperscalers) have immense leverage and can switch vendors freely. Gross margins collapsed from 18% to 11% as supply normalized—proof SMCI is a price-taker, not a price-maker.
Valuation: At $58.68 (29x P/E, 5.0x P/B), SMCI is priced for perfection despite deteriorating fundamentals. Graham’s formula suggests $20 fair value (66% overvaluation). The stock offers negative margin of safety—the opposite of disciplined value investing. Even Dell, a direct competitor with better margins and no accounting issues, trades at just 10x P/E.
Risks: Three fatal flaws disqualify SMCI: (1) E&Y auditor resignation + DOJ investigation destroys credibility permanently; (2) collapsing ROIC (29% → 16%) proves management is destroying value through growth; (3) debt explosion ($0.4B → $4.8B) creates financial fragility heading into a cyclical downturn. Expected return is -52% with asymmetric downside.
Catalysts: No positive catalysts. Likely negative catalysts include AI capex moderation (Meta/Microsoft signaling), continued margin pressure, potential accounting restatement, and hyperscalers shifting to direct ODM purchases. Best-case scenario (AI boom extends) offers 20% upside vs. 75% downside in bear case—terrible risk/reward.
Framework Checklist
- ❌ Quantitative: No margin of safety; 2/8 Graham criteria met; P/E × P/B = 145 vs. limit of 22.5
- ❌ Moat: Zero competitive advantage; commodity business with declining returns on capital
- ❌ Management: E&Y resignation, DOJ investigation, value-destructive capital allocation
- ❌ Contrarian: Decline reflects deteriorating fundamentals, not irrational pessimism
- ❌ Simplicity: Business is simple to understand, which makes it easy to see why it should be avoided
Would I hold this for 10+ years if the market closed tomorrow? Absolutely not. Buffett says only own stocks you’d be happy holding if the market shut for a decade. SMCI would likely see margins compress to 3-5%, ROIC decline to 10%, and the stock trade at 8-10x P/E (fair multiple for commodity hardware). That implies a fair value of $12-18 in 10 years—devastating value destruction from current $58.68.
The Bottom Line: SMCI is a speculation on an unsustainable AI boom, not an investment in a durable business. Every principle of value investing—margin of safety, competitive moat, quality management, stable cash flows—screams “avoid.” There are 4,000+ stocks to choose from. Why take accounting risk in a commodity business at a cyclical peak trading at 29x earnings? Better alternatives include Microsoft (moat + management), Dell (3x cheaper), or simply cash at 4.5% risk-free. Pass decisively and wait for genuine value opportunities.
“Price is what you pay; value is what you get.” — Warren Buffett
At $58.68, you’re paying a premium price for a deteriorating commodity business with unresolved accounting issues. That’s not value investing—it’s speculation.
Analysis Date: November 3, 2025
Analyst Framework: Benjamin Graham / Warren Buffett Value Investing
Disclosure: Educational analysis, not investment advice. Conduct your own due diligence and consult licensed advisors.