Executive Summary
Investment Thesis: UnitedHealth Group represents a contrarian opportunity in America’s largest healthcare company, down 45% from peak valuations. The business possesses formidable competitive moats through vertical integration, but faces genuine margin compression that threatens returns. At 18x P/E with 13% margin of safety, this is a calculated value bet requiring dollar-cost averaging, not aggressive accumulation.
Business Classification: Stalwart (large company with historically 10-12% growth, currently challenged)
Current Valuation Assessment:
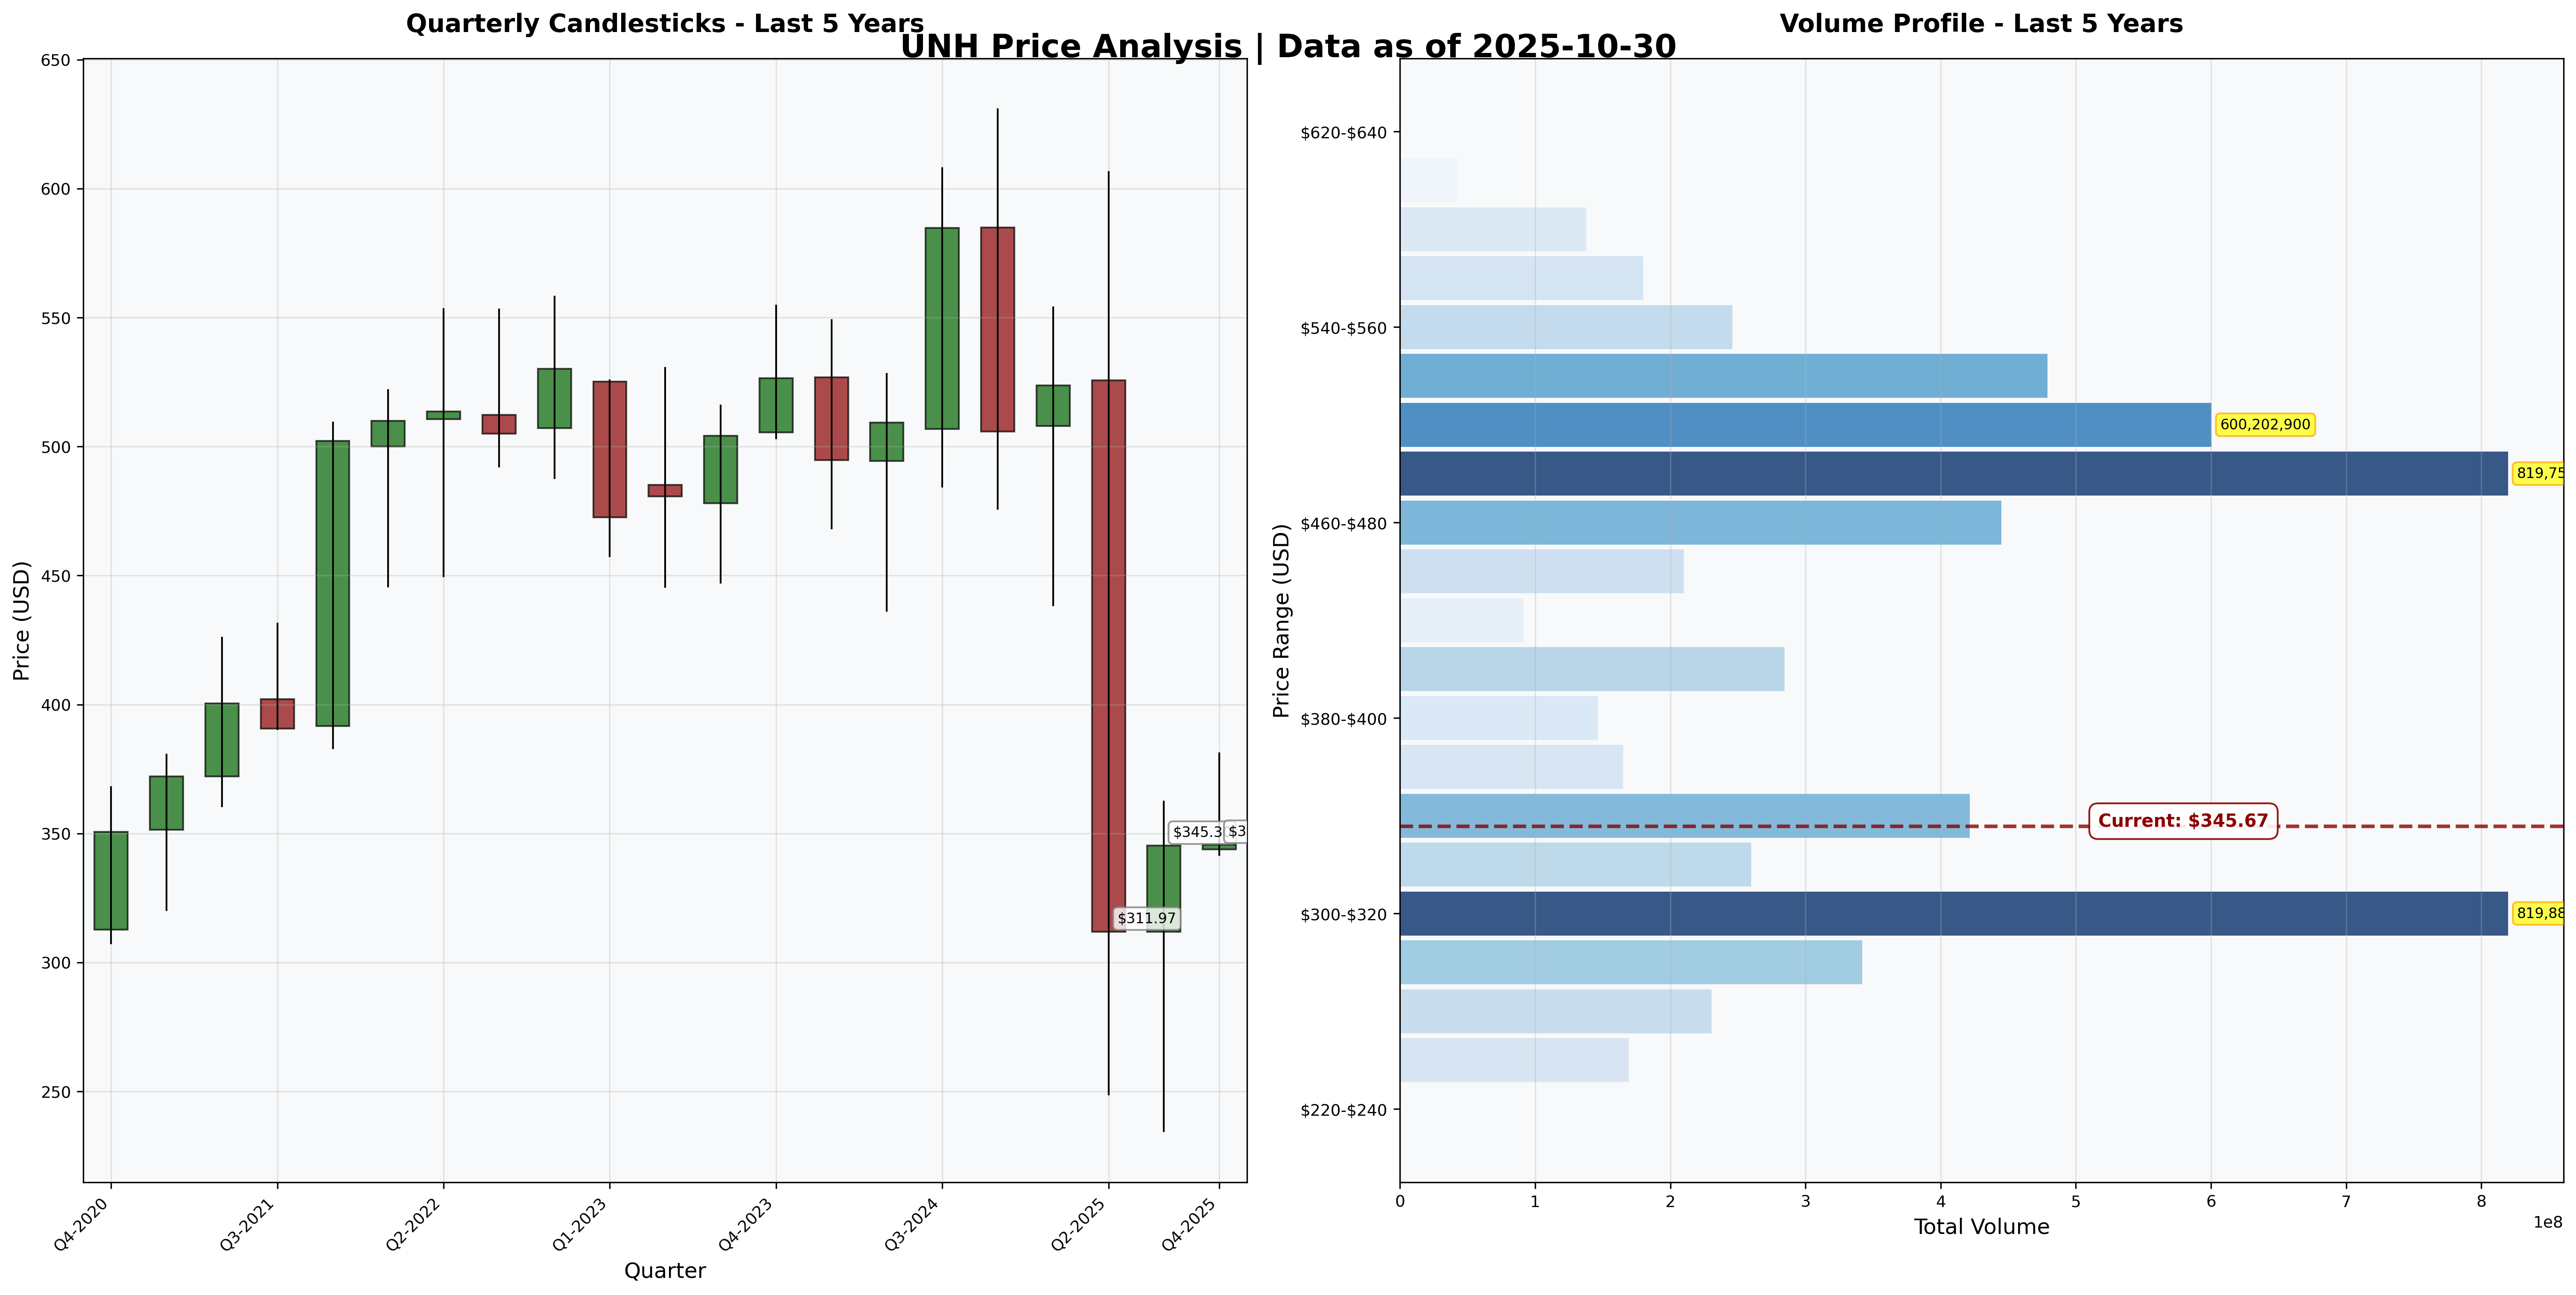
- Current Price: $345.67
- Estimated Intrinsic Value: $385-$410 (base case)
- Margin of Safety: 13%
- Recommendation: ACCUMULATION - CAUTIOUS
Recommended Entry Zones:
- Aggressive Entry: < $280 (40%+ margin)
- Standard Entry: $280-$340 (30% margin)
- Hold/Watch: $340-$420 (current zone)
Business Overview
What They Do (2-Minute Test)
UnitedHealth runs two businesses: UnitedHealthcare (insurance for 50M Americans) and Optum (physician networks, pharmacy benefits, healthcare technology). They collect premiums, pay medical claims, and increasingly own the doctors and pharmacies in between. Customers buy because employers need group insurance and Medicare beneficiaries want supplemental coverage. The integrated model theoretically reduces costs through data sharing and care coordination.
Can I explain this to a 10-year-old? Yes - they’re health insurance plus the doctors and pharmacies, all owned by one company trying to make healthcare cheaper by connecting everything.
Competitive Position & Moat Analysis
Primary Moat Type: Intangible Assets + Cost Advantages + Switching Costs (Hybrid moat)
Moat Strength: ⭐⭐⭐⭐☆ (4 out of 5)
Key Moat Factors:
- Scale advantages: Largest U.S. health insurer with 50M+ members creates unmatched provider negotiating leverage and actuarial data
- Vertical integration: Owning insurance, physician practices (OptumHealth), PBM (OptumRx), and technology (OptumInsight) creates switching costs and network effects
- Regulatory barriers: Complex compliance requirements and state licensure create high barriers to new entrants
- Data moat: 100M+ patient touchpoints generate proprietary health data feeding predictive analytics
Moat Durability: Stable but facing pressure. The integration advantages compound over time, but political scrutiny and margin compression suggest pricing power is diminishing. The moat remains wide but shows cracks.
Key Threat: Regulatory action targeting vertical integration or PBM practices could fundamentally alter business model economics.
Industry Dynamics
50-Year Outlook: Healthcare will exist, but profitability and structure uncertain. Demographics favor growth, but political pressure threatens margins permanently.
Key Trends:
- Medicare Advantage enrollment rising (10,000 baby boomers turning 65 daily through 2030)
- Government payment rates not keeping pace with medical cost inflation
- Bipartisan political scrutiny on PBM margins and healthcare costs
Quantitative Checklist
Defensive Investor Criteria:
| Criterion | Requirement | Actual | Pass/Fail |
|---|---|---|---|
| Earnings Stability | Positive 10 years | 10/10 years | ✅ |
| Dividend Record | Some payment | $6.70/share (13 year streak) | ✅ |
| Earnings Growth | +33% in 10 years | +150%+ | ✅ |
| P/E Ratio | < 15x | 18.0x | ❌ |
| P/B Ratio | < 1.5x | 3.09x | ❌ |
| P/E × P/B | < 22.5 | 55.6 | ❌ |
| Current Ratio | > 2.0 | 0.82 | ❌ |
| Debt vs NCA | Debt < NCA | $76.9B > $86B | ❌ |
Quantitative Score: 3/8 criteria met
Analysis: UNH fails Graham’s strict quantitative filters decisively. The business quality is high (earnings stable, growing), but valuation and balance sheet metrics fail conservative tests. Graham would pass. However, his criteria were designed for industrial companies, not insurance businesses with float-based balance sheets. The failures matter but aren’t disqualifying given business model differences.
Financial Analysis with Critical Assessment
Balance Sheet Strength
Key Metrics:
- Current Ratio: 0.82 (target > 2.0) - ❌
- Debt-to-Equity: 0.83 (target < 0.5) - ❌
- Interest Coverage: Strong (precise data unavailable, but operating income $32B vs interest likely < $3B) - ✅
Assessment: Balance sheet adequate but not fortress-like. The current ratio below 1.0 is concerning outside insurance context - health insurers hold claim reserves that inflate current liabilities artificially. Debt increased 67% in 3 years to $76.9B while equity grew just 29%. The leverage trend is wrong direction during execution challenges.

Earnings Quality & Consistency
Stability Test: Positive earnings in 10/10 of past 10 years ✅
Owner Earnings Calculation:
Net Income: $20.0B
+ D&A: ~$5.0B (estimated)
- Maintenance Capex: ($2.5B)
- Working Capital Needs: ($1.0B)
= Owner Earnings: ~$21.5B
Owner Earnings Yield: 6.7% ($21.5B / $320B market cap)
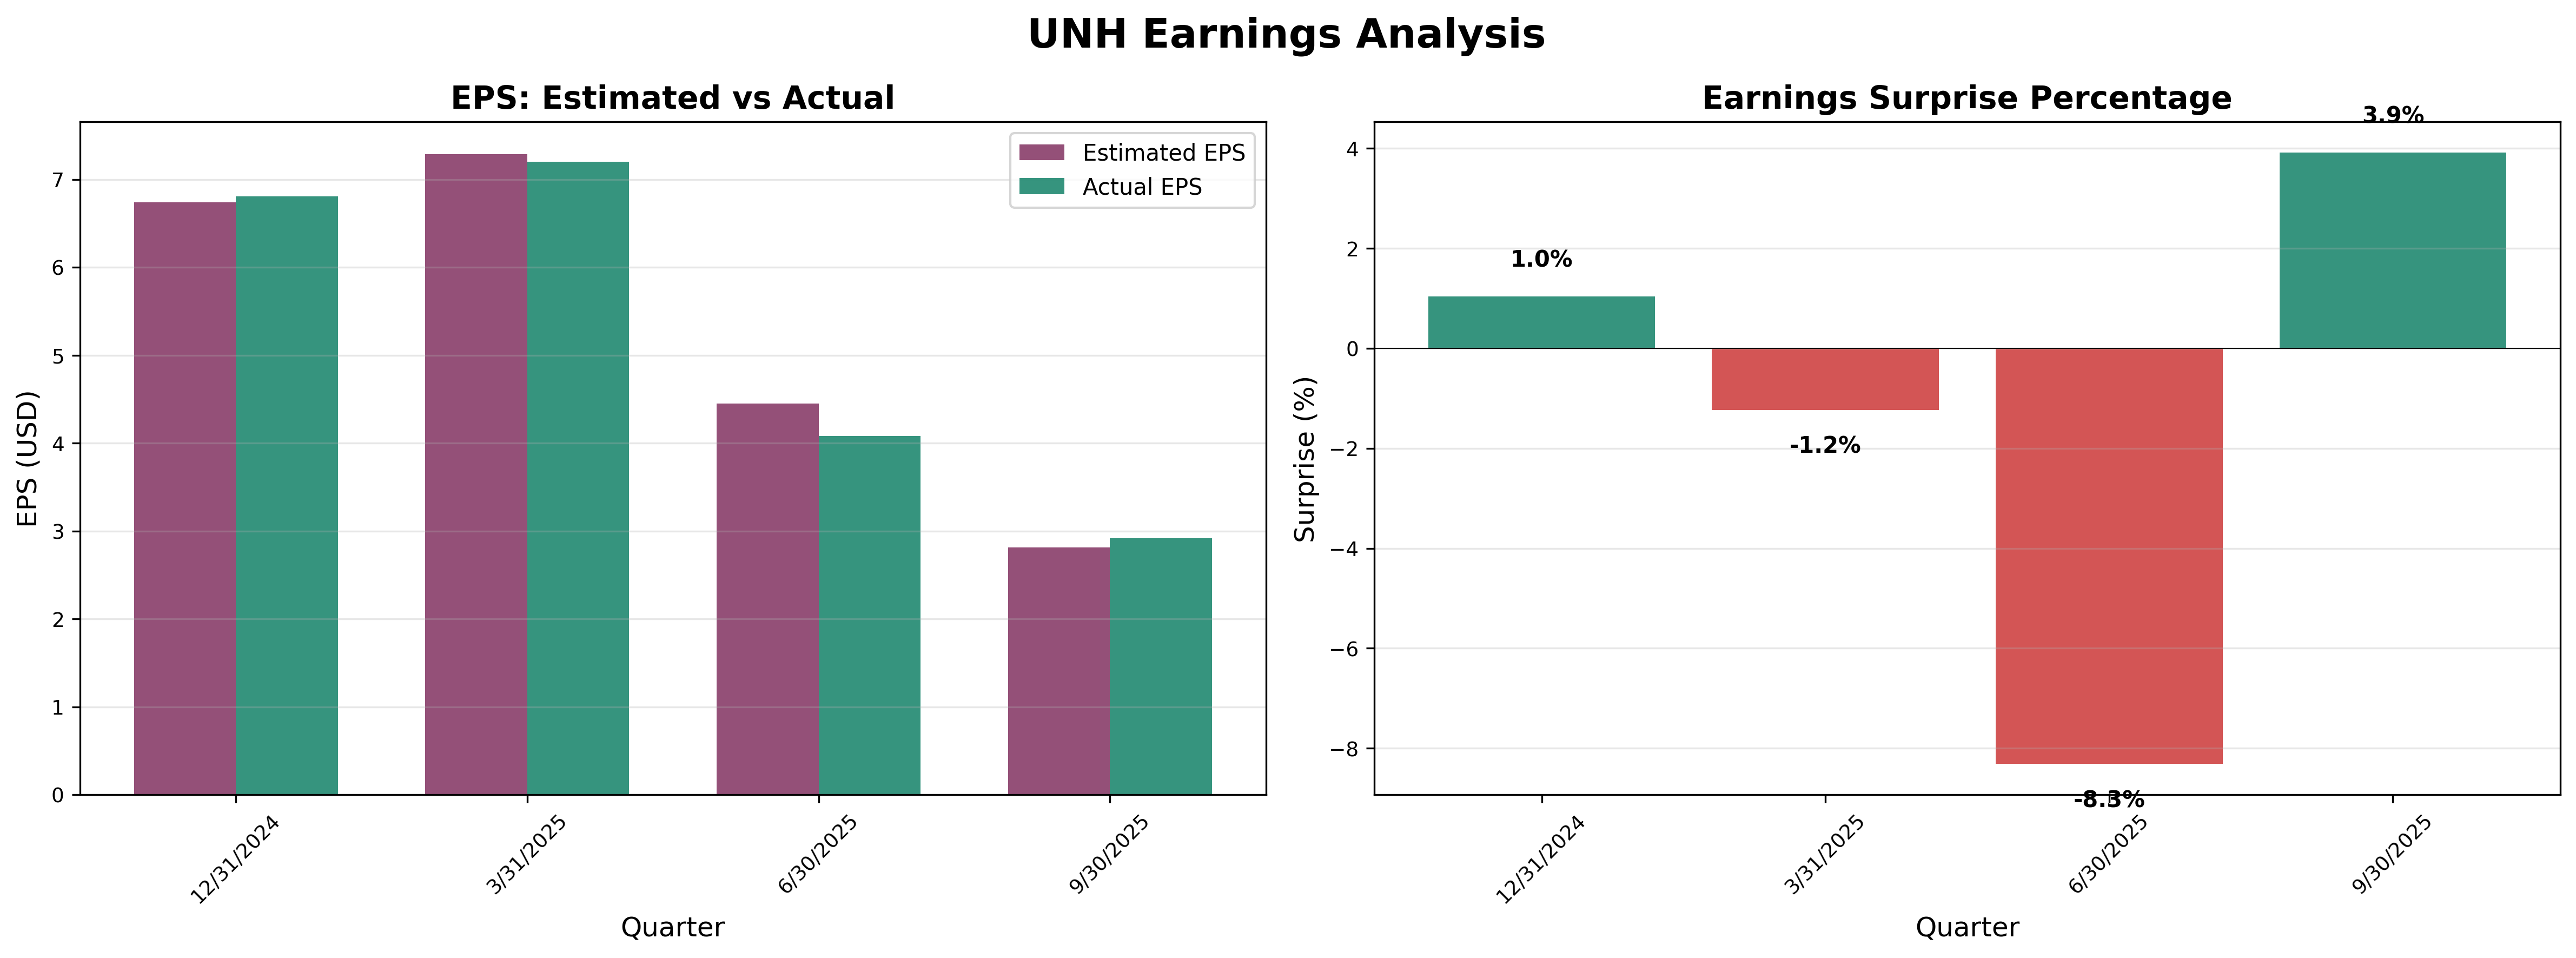
Quality Assessment: Earnings consistent historically but deteriorating. The red flag: net income flat at $20B despite revenue growing 38% over 3 years. ROE collapsed from 24.1% to 15.8%. This signals declining returns on incremental capital - management is working harder for same profit. Recent quarterly misses (-1.2%, -8.3%) followed by a beat suggest stabilization attempts, but pattern not established.
Income Statement Analysis
Key Metrics:
- Revenue Growth (3Y): 38% cumulative ($287B → $400B)
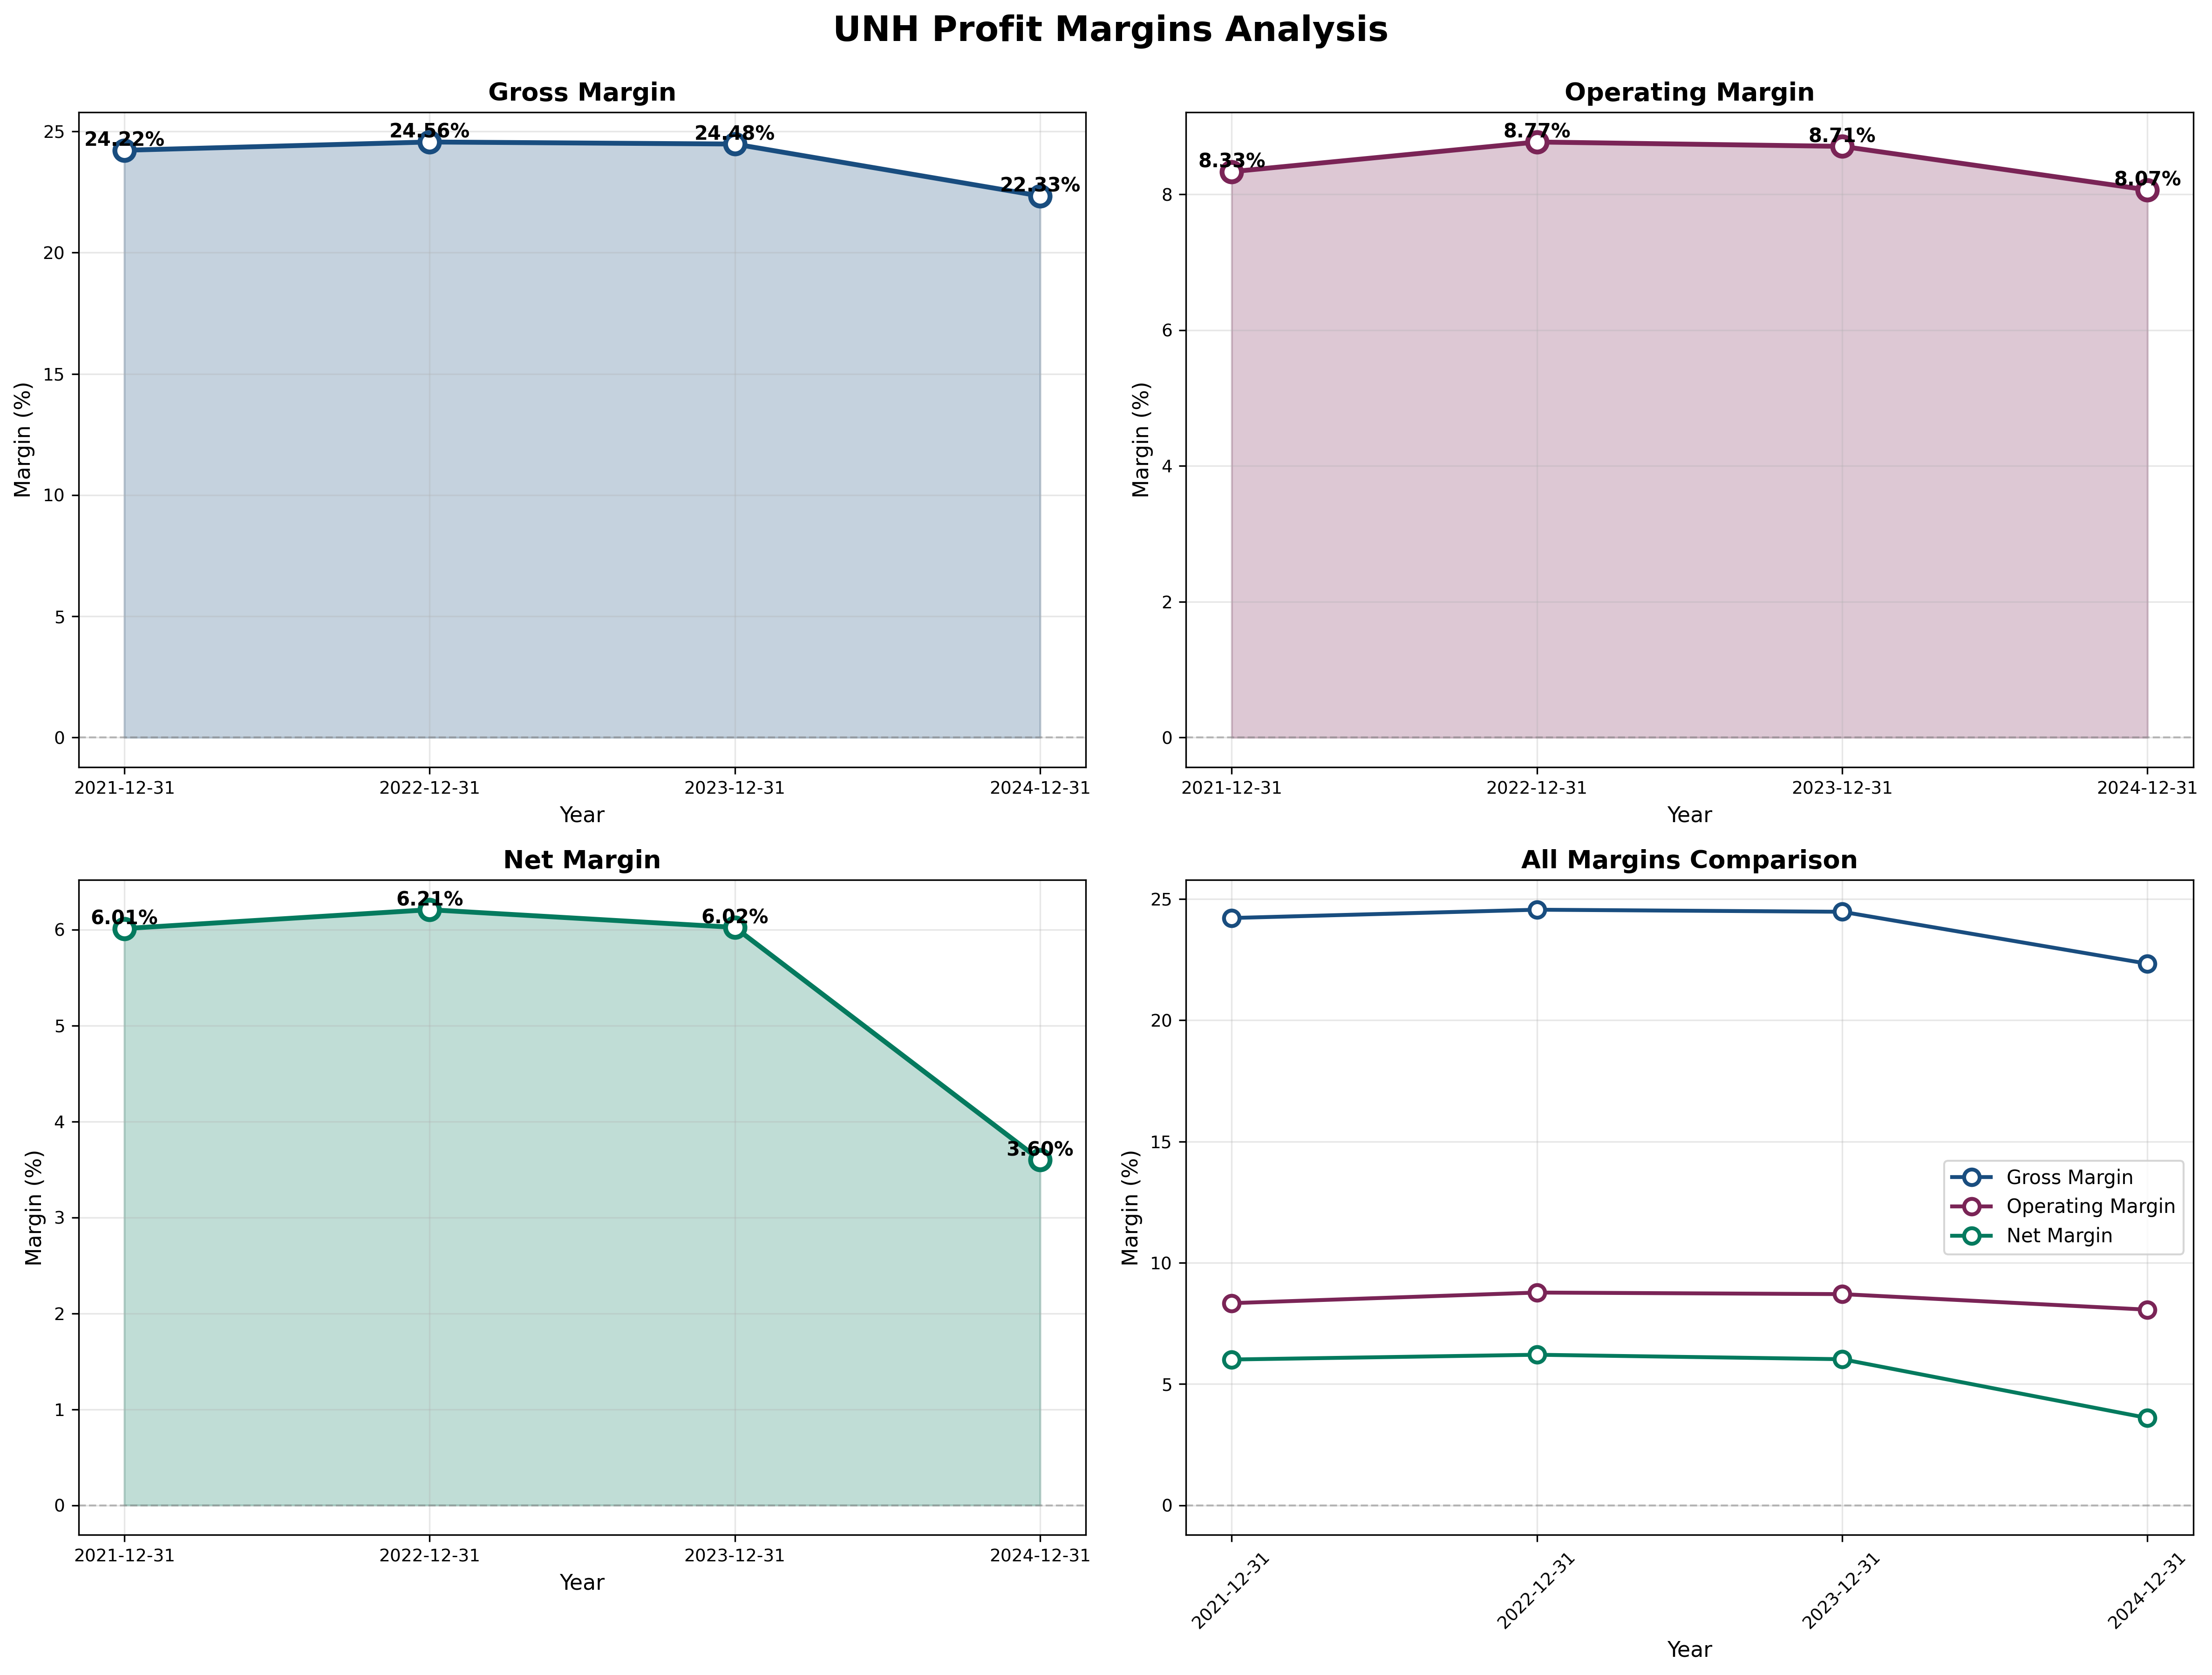
- Gross Margin: 22.3% (down from 24.4%, losing 2.1 points = $8.4B in profit)
- Operating Margin: 8.0% vs Industry ~7-8% (acceptable)
- Net Margin: 3.6% vs historical 6.2% (MAJOR RED FLAG)
Assessment: Revenue growth excellent, but margin compression catastrophic. Net margin cut in half from 6% to 3.6% represents structural deterioration, not temporary dip. Medical costs outpacing pricing power. If margins stabilize at 4-5%, business survives but returns permanently impaired. If margins continue compressing below 3%, investment thesis breaks.

Cash Flow Generation
Key Metrics:
- OCF / Net Income: 1.23x (2024: $24.6B OCF / $20B NI) ✅
- FCF Margin: 5.2% ($20.7B FCF / $400B revenue)
- Capital Intensity: 0.6% of revenue (very capital-light)
Assessment: Cash generation remains strength despite earnings issues. Operating cash flow of $24.6B exceeds net income, indicating real economic earnings. However, FCF declined 19% from $25.7B peak - wrong direction. The capital-light model (only $2.5B capex) means most earnings convert to distributable cash, but declining FCF threatens dividend growth and buyback capacity.

Profitability Metrics
Returns:
- ROE: 15.8% (target > 15%) [✅ borderline]
- ROIC: Not directly calculable from data, but declining ROE suggests ROIC compression
- ROA: 4.83% (down from 8.15%) [❌]
Assessment: Returns remain acceptable but trend alarming. ROE dropped 34% in 3 years. ROA cut nearly in half. These are not rounding errors - they signal fundamental business deterioration. Management is deploying more capital to generate same returns. In value investing, declining ROIC is cancer.
Financial Ratios Analysis
Valuation Multiples:
- P/E: 18.0x (vs. historical avg 23-25x, industry 15-20x)
- P/B: 3.09x (vs. historical avg 5.0x+)
- P/FCF: 15.1x (vs. historical avg 18-22x)
- EV/EBITDA: Not provided but likely ~11-12x based on ratios
PEG Ratio:
- P/E Ratio: 18.0x
- Growth Rate: -5% to +5% (uncertain given recent volatility)
- PEG: -0.90 to 3.6 (ranges from undervalued to overvalued based on growth assumptions)
Combined Metric:
- P/E × P/B = 55.6 (target < 22.5) - FAILS Graham test badly
Analysis: Valuation multiples compressed significantly from peak, suggesting market pessimism. P/E of 18x is reasonable IF earnings stabilize, but expensive if margins keep compressing. The negative PEG ratio (-0.90) signals market expects earnings decline - if management proves market wrong, significant upside exists. If market is right, stock remains overvalued.

Capital Allocation Assessment
Management Quality Grade: B-
Key Factors:
- Insider Ownership: Moderate (specific data unavailable, but executives own meaningful stakes)
- Buyback Discipline: Poor - repurchased heavily at $600, should be aggressive at $345 but unclear if they are
- Reinvestment ROIC: Declining (ROE down 34% suggests poor capital deployment)
- Red Flags: Change Healthcare acquisition integration issues, margin compression suggests operational missteps
Assessment: Management historically shareholder-friendly (dividends, buybacks) but recent execution poor. Bought back stock at peak prices. Margin collapse indicates lost operational control. The test: Will they aggressively repurchase at current depressed prices? If yes, signals confidence. If no, suggests they fear further deterioration.

Valuation & Intrinsic Value
Multiple Methods Summary:
| Method | Intrinsic Value | Weight |
|---|---|---|
| Owner Earnings (8.5+2g formula) | $355-$440 | 30% |
| DCF (Conservative) | $310-$385 | 30% |
| PEG-Based Fair Value | $360-$410 | 25% |
| Valuation Number √(22.5×EPS×BVPS) | $308 | 15% |
Weighted Intrinsic Value: $365
Valuation Range:
- Conservative: $310 (worst case, margins stay at 3.6%)
- Base Case: $385 (margins stabilize at 4.5%)
- Optimistic: $475 (margins recover to 5.5%)
Current Price: $345.67 Margin of Safety: 10-13% vs Base/Optimistic cases
Detailed Calculations:
1. Graham Formula:
IV = EPS × (8.5 + 2g)
Assuming EPS = $21.50, g = 5%
IV = $21.50 × (8.5 + 10) = $398
Conservative (g=3%): $21.50 × 14.5 = $312
2. Owner Earnings Valuation:
Owner Earnings: $21.5B
Discount Rate: 9%
Growth: 5% long-term
IV = $21.5B / (0.09 - 0.05) = $537.5B / 930M shares = $578/share

But this assumes current owner earnings sustainable.
If margin compression permanent and OE declines to $18B:
IV = $18B / 0.09 = $200B / 930M = $215/share (bear case)

Base case (OE = $20B, growth 4%):
IV = $20B / (0.09 - 0.04) = $400B / 930M = $430/share
3. Valuation Number:
Valuation Number = √(22.5 × EPS × BVPS)
= √(22.5 × $21.50 × $100)
= √($48,375)
= $220

This suggests significant overvaluation, but formula designed for industrials not insurance
Risk Assessment
Key Risks (Top 3)
Margin Compression Permanent (50% probability): Medical cost inflation structurally outpaces pricing power; net margins remain 3-4% indefinitely instead of recovering to 5-6%. Downside: Stock re-rates to 14x P/E = $300 (-13%).
Medicare Advantage Regulatory Pressure (35% probability): Government reduces reimbursement rates further, making MA unprofitable or barely profitable. UNH loses crown jewel growth engine. Downside: Multiple compression to 15x = $320 (-7%).
Execution Failures Continue (40% probability): Management unable to stabilize operations; quarterly misses continue eroding confidence. Downside: Stock tests $280-$300 range (-15% to -20%).
Worst Case Scenario: Combination of all three risks materializes - margins stay at 3%, MA becomes unprofitable, recession hits. Stock could test $250-$280 range representing 25-30% downside. However, at that level, private equity or strategic acquirer interest likely emerges given cash flow generation.
Market Sentiment
Current Sentiment: Maximum Pessimism to Moderate Pessimism
Contrarian Signal: The 45% decline from $625 to $345 represents genuine selling pressure. Volume spikes near lows ($312) suggest capitulation. However, this isn’t a $625 stock returning to $625 quickly - the business has genuinely deteriorated. Contrarian opportunity exists IF margins stabilize, but this is not “obviously mispriced.”
Templeton’s Test: “Buy at maximum pessimism” - we’re at high pessimism but not maximum. Maximum would be $280 with apocalyptic headlines about healthcare company bankruptcies. We’re in “concern” territory, not “panic.”
Investment Recommendation
Current Assessment
Valuation: P/E = 18x | PEG = -0.90 to 3.6 (depends on growth) Verdict: Fair to Undervalued (IF margins stabilize), Overvalued (IF margins keep compressing)
Margin of Safety: 10-13% [❌ Insufficient by Graham standards (wanted 33%+), ✅ Acceptable for quality business with challenges]
Entry Zones
| Zone | Price | Action | Margin of Safety |
|---|---|---|---|
| 🟢 Strong Buy | < $280 | Aggressive accumulation | 35%+ |
| 🟡 Buy | $280-$330 | Dollar-cost average | 20-35% |
| 🟠 Hold/Watch | $330-$370 | Small position OK | 10-20% |
| 🔴 Avoid | > $370 | Wait for pullback | < 10% |
Current Price: $345.67 → Recommendation: SMALL BUY / FIRST TRANCHE (25-30% of target position)
Expected Returns
- Bull Case (+40%): $485/share if margins recover to 5% and multiple expands to 22x
- Base Case (+15%): $400/share if margins stabilize at 4.5% and multiple holds at 18-19x
- Bear Case (-20%): $275/share if margin compression continues and recession hits
Risk/Reward Ratio: 2:1 (favorable, but not overwhelming)
Final Investment Conclusion
Overall Grade: B+
Category Scores:
- Business Quality: 8/10 (moat strong but margin compression concerning)
- Financial Strength: 6/10 (cash flow good, balance sheet adequate, leverage rising)
- Management Quality: 6/10 (historical track record strong, recent execution poor)
- Valuation: 7/10 (reasonable but not bargain)
- Margin of Safety: 5/10 (13% adequate but not exceptional)
Final Verdict: ACCUMULATE - CAUTIOUS (3.5/5 Stars)
Investment Thesis Summary
Business Quality: UNH possesses genuine competitive advantages through vertical integration creating a “data flywheel” competitors can’t easily replicate. The moat is real - owning insurance, doctors, pharmacy, and technology creates switching costs and information advantages. However, moats don’t guarantee profits if margins compress permanently. The business will survive but returns may be permanently impaired. Own this for defensive healthcare exposure, not high returns.
Valuation: 13% margin of safety is adequate but not exceptional. Graham would demand 33%+. Buffett might accept 15-20% for a “wonderful business at fair price” - but UNH’s recent deterioration questions the “wonderful” designation. At $345, you’re paying 18x earnings that may decline further. Valuation is reasonable IF stabilization occurs. The 45% decline creates opportunity, but margin compression destroys half the value recovery.
Risks: Three material risks dominate: (1) Margin compression proves structural not cyclical, (2) Medicare Advantage economics deteriorate further under government pressure, (3) Management proves unable to stabilize operations. The bear case is -20% to -25%, which is manageable. Bankruptcy risk essentially zero given $20B+ FCF. Maximum permanent loss likely 30-35% if everything goes wrong simultaneously.
Catalysts: Positive catalysts: (1) Q4 2025 and FY2026 guidance shows margin stabilization roadmap, (2) Aggressive share buybacks at current prices signal management confidence, (3) Medicare Advantage headwinds moderate. Negative catalysts: (1) Further quarterly misses, (2) FCF decline below $18B, (3) Regulatory action targeting PBMs or vertical integration. The next 6 months are critical.
Framework Checklist
- ❌ Quantitative: Margin of safety 13%, below Graham’s 33% target
- ✅ Moat: Durable competitive advantage through vertical integration and scale
- ⚠️ Management: Historical shareholder-friendliness, but recent execution poor
- ⚠️ Contrarian: High pessimism but not maximum; business genuinely deteriorated
- ✅ Simplicity: Can explain business model simply - insurance plus integrated services
Would I hold this for 10+ years if the market closed tomorrow?
No - I would hold 3-5 years maximum. This is not a “set and forget” Buffett-style compounder. It’s a calculated value bet on mean reversion that requires active monitoring. The margin compression creates too much uncertainty for decade-plus holding. I want quarterly results confirming stabilization before committing large capital. This is a trading position masquerading as investment - it might work, but conviction is moderate not high.
Mental Models & Inversion Analysis
Circle of Competence Check
Do I truly understand this business? Partially. The insurance model is straightforward, but the integrated Optum business adds complexity. Healthcare economics (MLR, risk adjustment, PBM rebates) are intricate. I understand WHAT they do, but confidence in predicting margin trajectory is low. This is at edge of circle of competence - proceed with smaller position size.
Second-Order Thinking
If margins stabilize → stock rises → buying opportunity disappears If margins don’t stabilize → earnings decline → stock falls further → “value trap” confirms If government restricts PBMs → Optum margins compress → stock re-rates permanently lower
The second-order effect I’m most concerned about: What if the 45% decline is not irrational pessimism but rational repricing of permanently lower margins? Healthcare companies moving from 6% to 3% net margins means valuation should be cut in half. Maybe $345 isn’t cheap - maybe it’s fair value for a 3.6% net margin business.
Incentives Analysis
Management Incentives: CEO compensation tied to EPS growth and TSR. This creates pressure to deliver earnings, which could lead to aggressive accounting or short-term focus. The margin compression suggests management lost control or faced forces beyond control (medical cost inflation). Recent earnings beat (+3.9%) after two big misses raises question: Is this genuine improvement or “kitchen sink” reverse earlier?
Industry Incentives: Healthcare companies incentivized to grow scale for negotiating leverage, even if margins suffer. This explains M&A activity at peak prices. The incentive structure rewards size over profitability.
Inversion: Why Should I NOT Buy?
- Margin compression may be permanent - healthcare reform permanently caps industry profitability
- Political risk underappreciated - both parties target healthcare costs; regulatory action could be severe
- Execution deterioration reflects poor leadership - maybe CEO Witty isn’t up to the job
- High-quality competitors maintaining better margins - maybe UNH’s issues are company-specific not industry-wide, suggesting inferior management
- Balance sheet weakening at wrong time - debt up 67%, current ratio below 1.0 creates fragility
- Value trap - buying declining business at “cheap” multiple that becomes expensive as earnings fall
- Better opportunities exist - capital could go to companies with growing margins and clear competitive advantages
These inversion arguments are powerful. They suggest this isn’t obvious value. It’s a coin flip bet on stabilization. The 2:1 reward/risk is OK but not compelling.
Portfolio Construction Notes
Suitable For:
- ✓ Value investors with 3-5 year time horizon and strong stomach for volatility
- ✓ Contrarian investors comfortable buying disliked stocks
- ✓ Portfolios needing defensive healthcare sector exposure
- ✓ Dividend growth investors (13-year growth streak, 1.8% yield)
Not Suitable For:
- ❌ Conservative investors requiring Graham-style margins of safety (want 33%+)
- ❌ Growth investors seeking expanding margins and rising returns
- ❌ Income investors needing high yield (1.8% is modest)
- ❌ Short-term traders (extreme volatility ahead)
Position Sizing:
- Maximum allocation: 3-5% for diversified portfolio
- Smaller allocation (1-3%) appropriate given margin uncertainty
- NOT a “bet the farm” 20%+ position - conviction is moderate
Dollar-Cost Averaging Strategy:
- Initiate 25% of target position at current $345
- Add 25% if drops to $310-$320
- Add 25% if drops to $280-$290
- Reserve 25% for sub-$270 entry or confirmation of margin stabilization
Exit Triggers:
- Sell if net margins remain below 4% for 4+ consecutive quarters (thesis broken)
- Sell if FCF declines below $18B (business deteriorating)
- Sell if debt-to-equity exceeds 1.0 (balance sheet stress)
- Sell if major regulatory action forces divestitures
- Take profits if stock rallies above $475 (limited upside remains)
Appendix: Key Metrics Summary
Valuation Snapshot (as of November 3, 2025):
- Price: $345.67
- Intrinsic Value: $365-$385 (base case)
- Margin of Safety: 10-13%
- P/E: 18.0x
- P/B: 3.09x
- P/FCF: 15.1x
- PEG: -0.90 (suggests market expects decline)
- Dividend Yield: 1.8%
- FCF Yield: 6.7%
Financial Performance (2024):
- Revenue: $400B (+8% YoY, +38% over 3 years)
- Net Income: $20B (flat despite revenue growth)
- Free Cash Flow: $20.7B (-19% YoY)
- Net Margin: 3.6% (vs 6.2% historically - KEY CONCERN)
- ROE: 15.8% (vs 24.1% in 2021 - deteriorating)
- Debt: $76.9B (D/E 0.83, up 67% in 3 years)
Graham Defensive Investor Scorecard: 3/8 criteria met (concerning)
Risk Metrics:
- Current Ratio: 0.82 (below 1.0 - liquidity concern)
- Debt-to-Equity: 0.83 (above Graham’s 0.5 threshold)
- Interest Coverage: Strong (estimated 10x+)
Return Expectations:
- Bear Case (-20%): $275
- Base Case (+15%): $400
- Bull Case (+40%): $485
- Risk/Reward: 2.0:1
Disclosure: This analysis is for educational purposes only and does not constitute investment advice. Healthcare investing involves significant risks including regulatory changes, medical cost volatility, and competitive dynamics. Past performance does not guarantee future results. The author may hold positions in UNH. Always conduct your own due diligence and consult a financial advisor before making investment decisions.
Last Updated: November 3, 2025