Executive Summary
Investment Thesis: Verizon is a mature telecom stalwart trading at a significant discount with an attractive 7% dividend yield and compelling valuation (P/E 9.0, PEG 0.13). However, weak balance sheet liquidity, high leverage (D/E 1.65), and stagnant revenue growth create meaningful risks that offset the margin of safety.
Business Classification: Slow Grower (large, mature telecom with limited growth prospects)
Current Valuation Assessment:
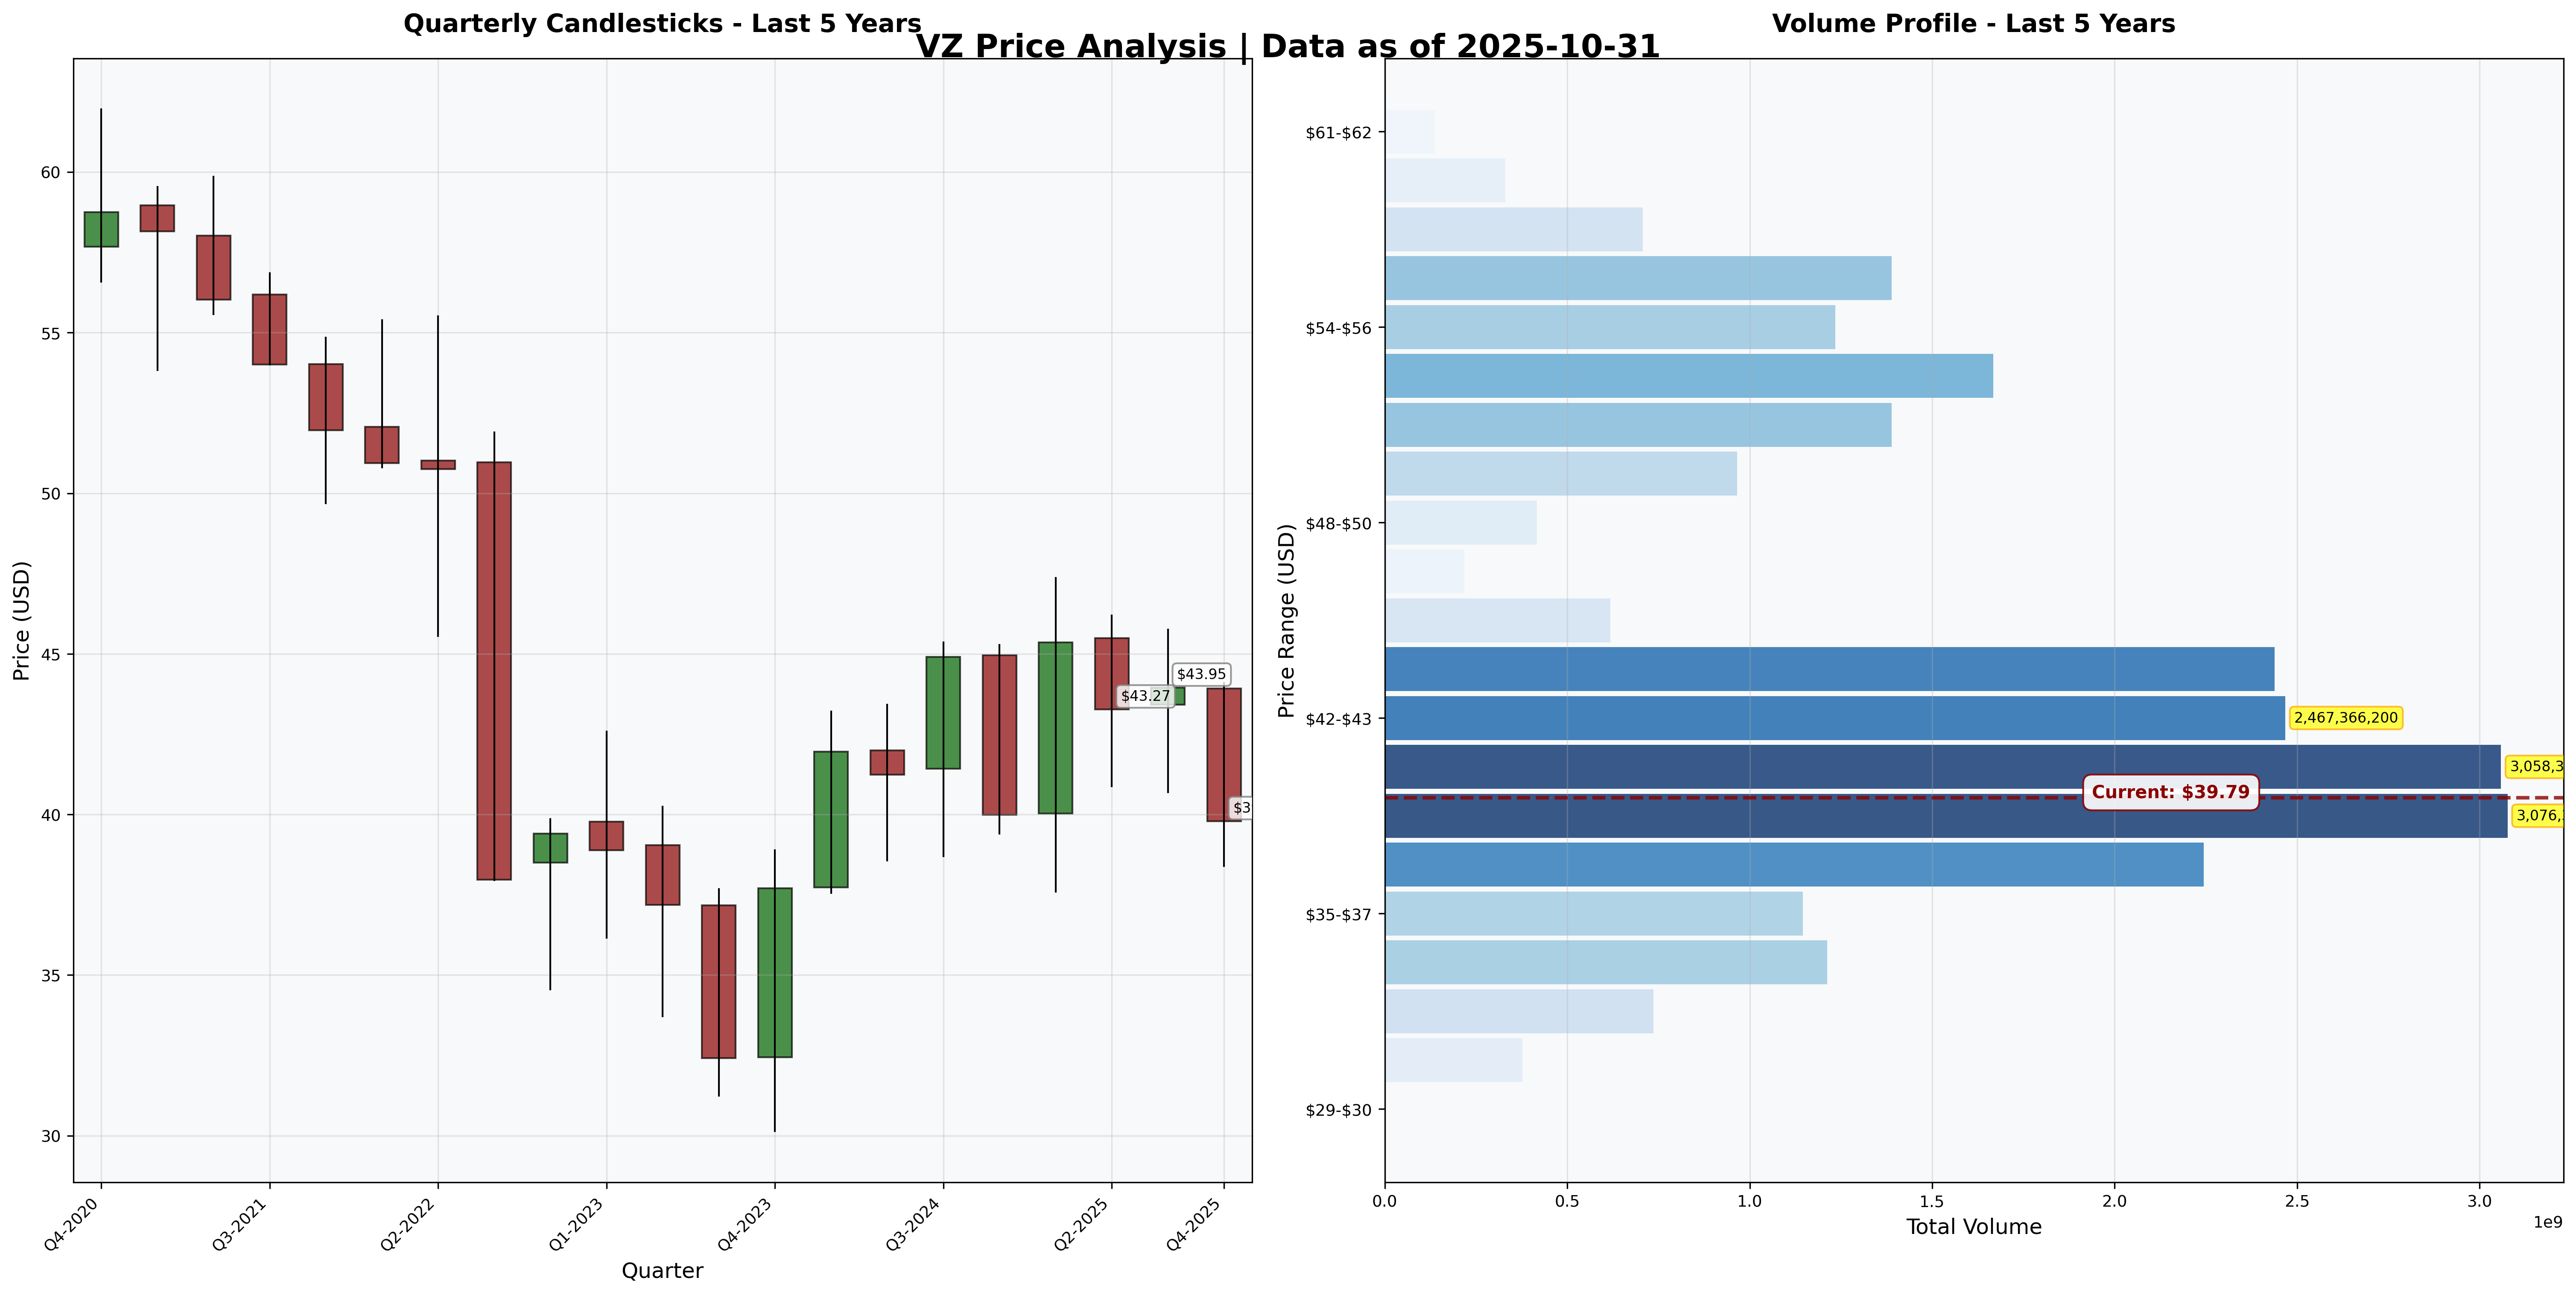
- Current Price: $39.79
- Estimated Intrinsic Value: $48 - $56
- Margin of Safety: 21-29%
- Recommendation: HOLD (Buy on further weakness below $35)
Recommended Entry Zones:
- Aggressive Entry: < $32 (40%+ margin)
- Standard Entry: $32 - $36 (30% margin)
- Hold/Avoid: > $38
Business Overview
What They Do (2-Minute Test)
Verizon sells wireless phone service and home internet to millions of Americans. Customers buy because they need reliable cell coverage and fast internet—Verizon has historically offered the best network quality. They make money through monthly subscription fees, charging for data plans, phone upgrades, and increasingly, 5G home broadband services.
Competitive Position & Moat Analysis
Primary Moat Type: Cost Advantage + Switching Costs
Moat Strength: ⭐⭐⭐☆☆ (3 out of 5)
Key Moat Factors:
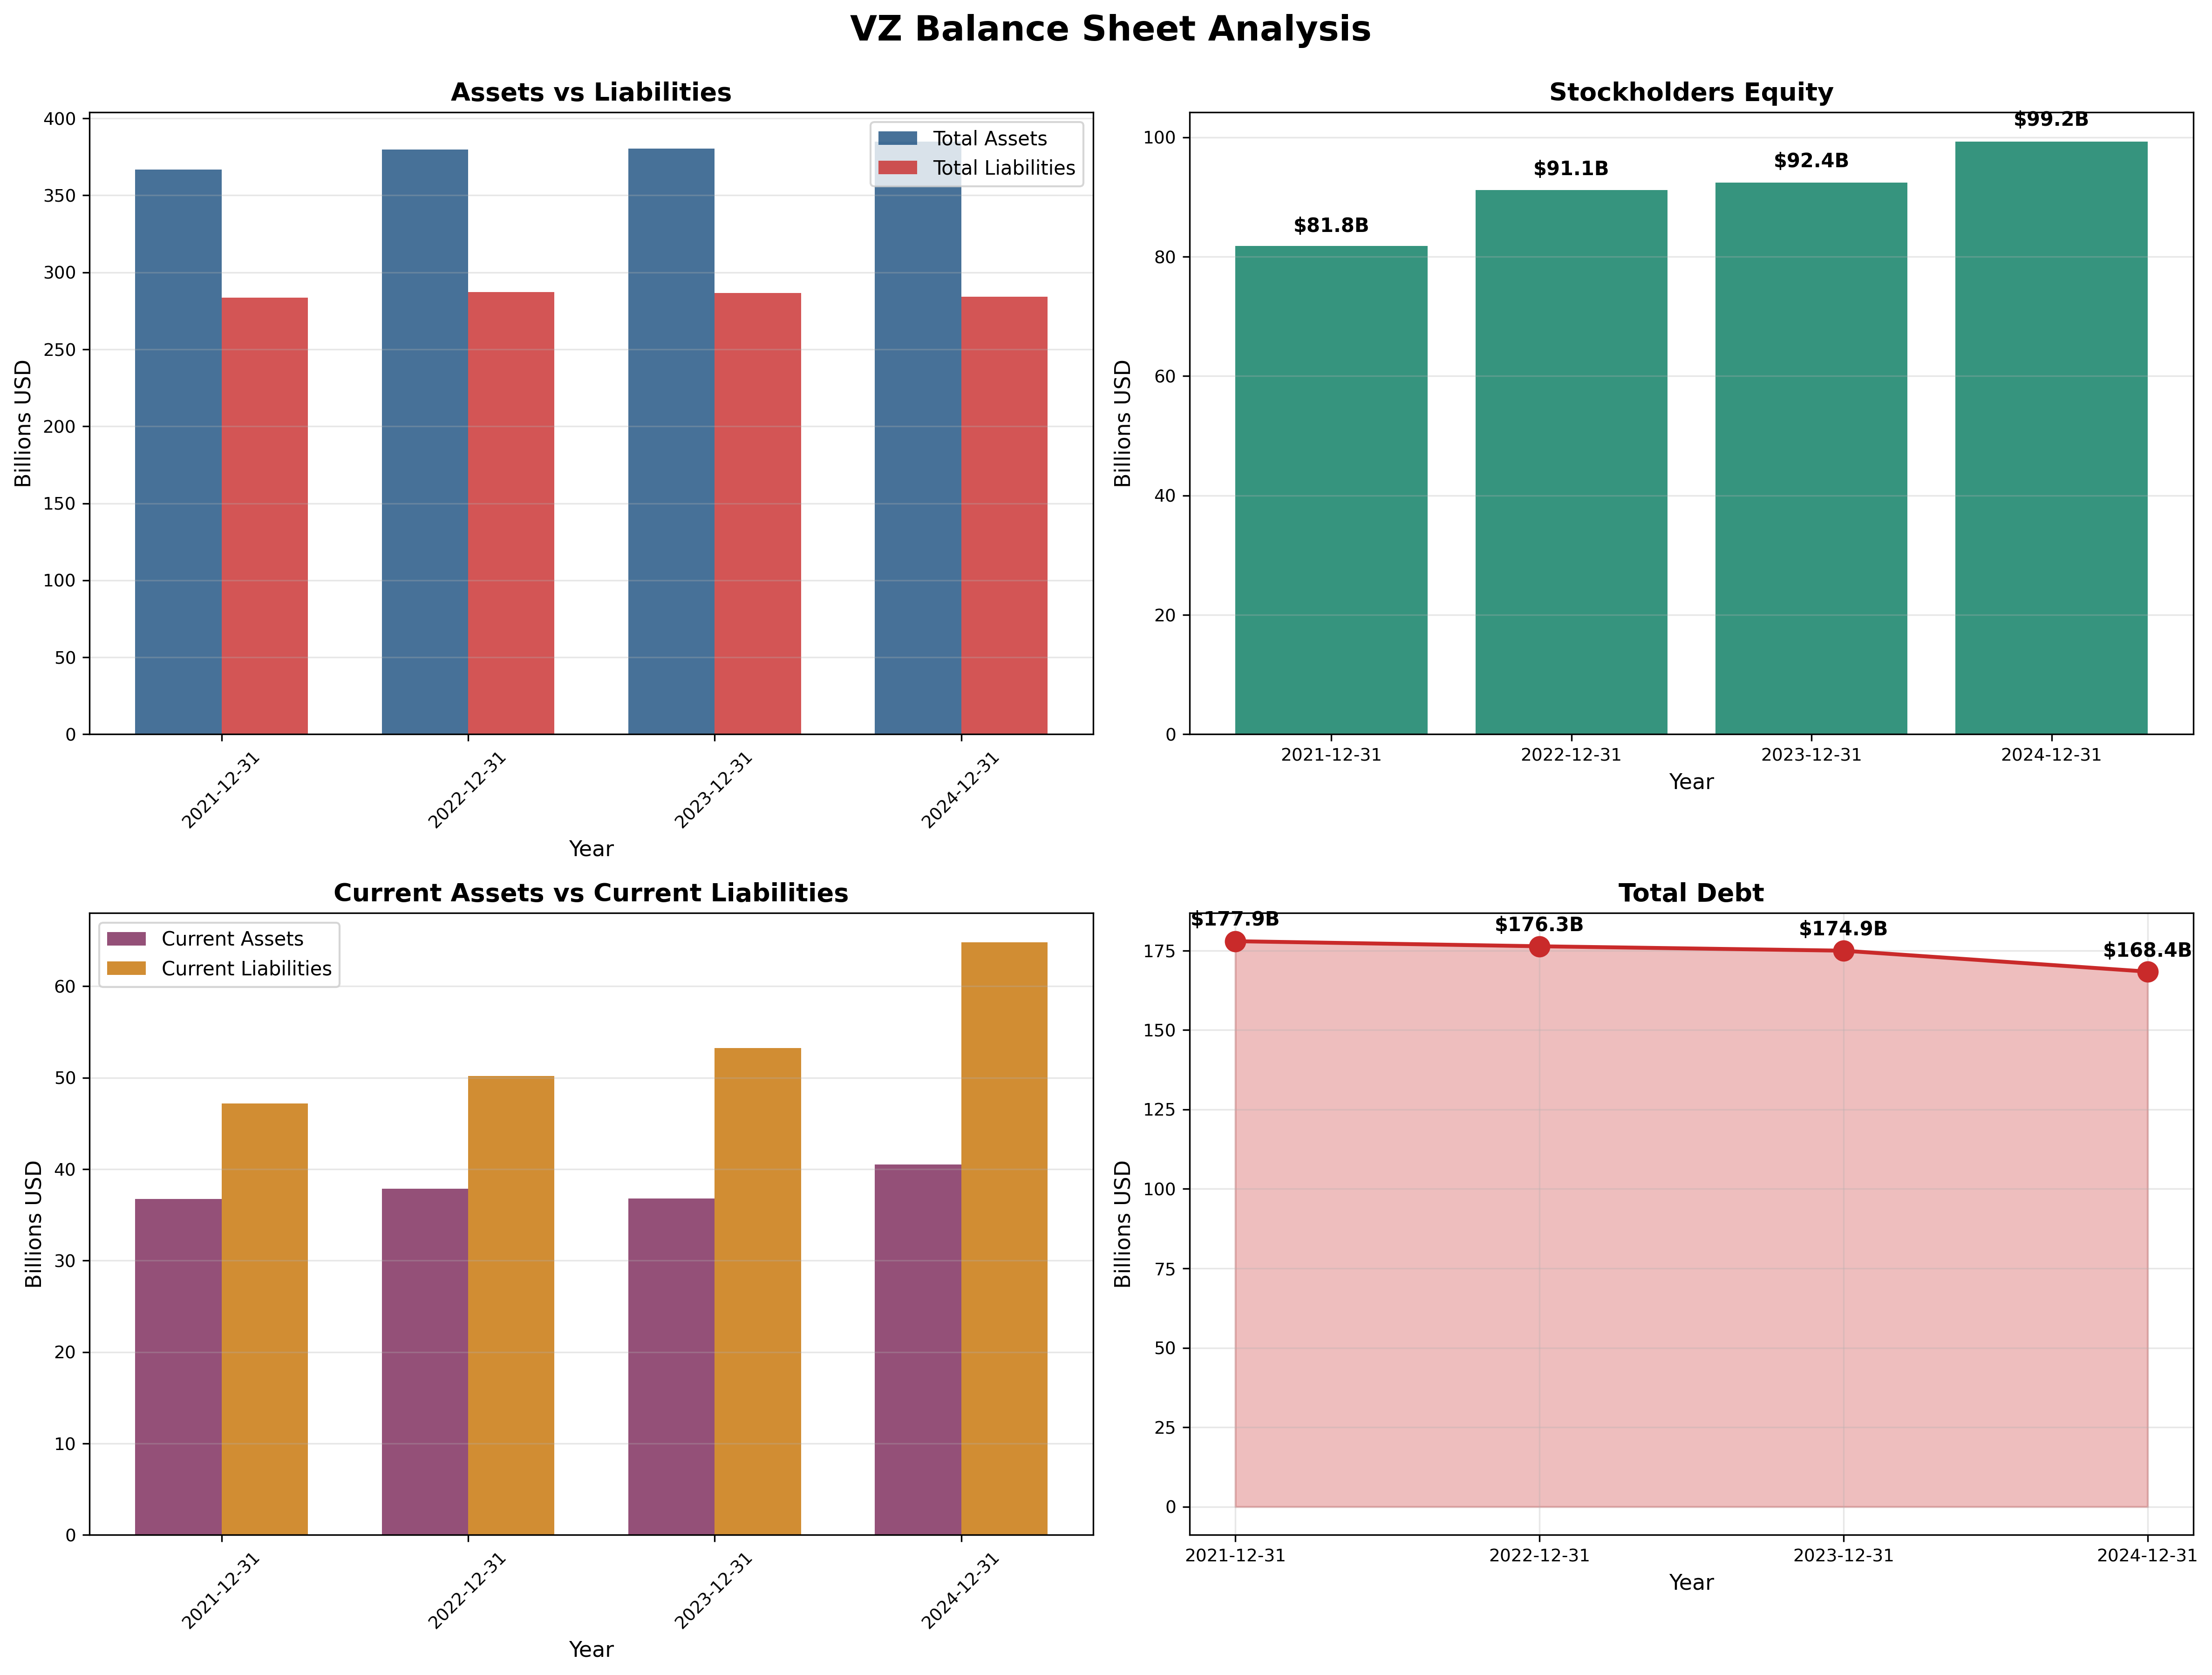
- Network infrastructure: Massive capital investment ($168B in assets) creates high barriers to entry; competitors need decades and billions to replicate
- Spectrum licenses: Irreplaceable government-issued wireless spectrum provides regulatory moat
- Switching costs: Customers face hassle of changing numbers, family plans, and device financing, creating moderate stickiness
- Scale economies: Largest U.S. wireless carrier spreads fixed network costs over 114M+ wireless connections
Moat Durability:
- Status: Narrowing – Cable companies (Comcast, Charter) leveraging existing infrastructure to offer lower-cost mobile services via MVNO agreements; T-Mobile aggressively competing on price after Sprint merger
- Key Threat: Commoditization of wireless service as network quality gap narrows between carriers, shifting competition to price
Industry Dynamics
50-Year Outlook: Wireless connectivity will remain essential infrastructure, but industry faces maturation with 95%+ U.S. penetration. Future growth tied to IoT, fixed wireless, and edge computing—not explosive, but steady utility-like demand.
Key Trends:
- Market saturation limiting wireless subscriber growth (flat revenue for 4 years)
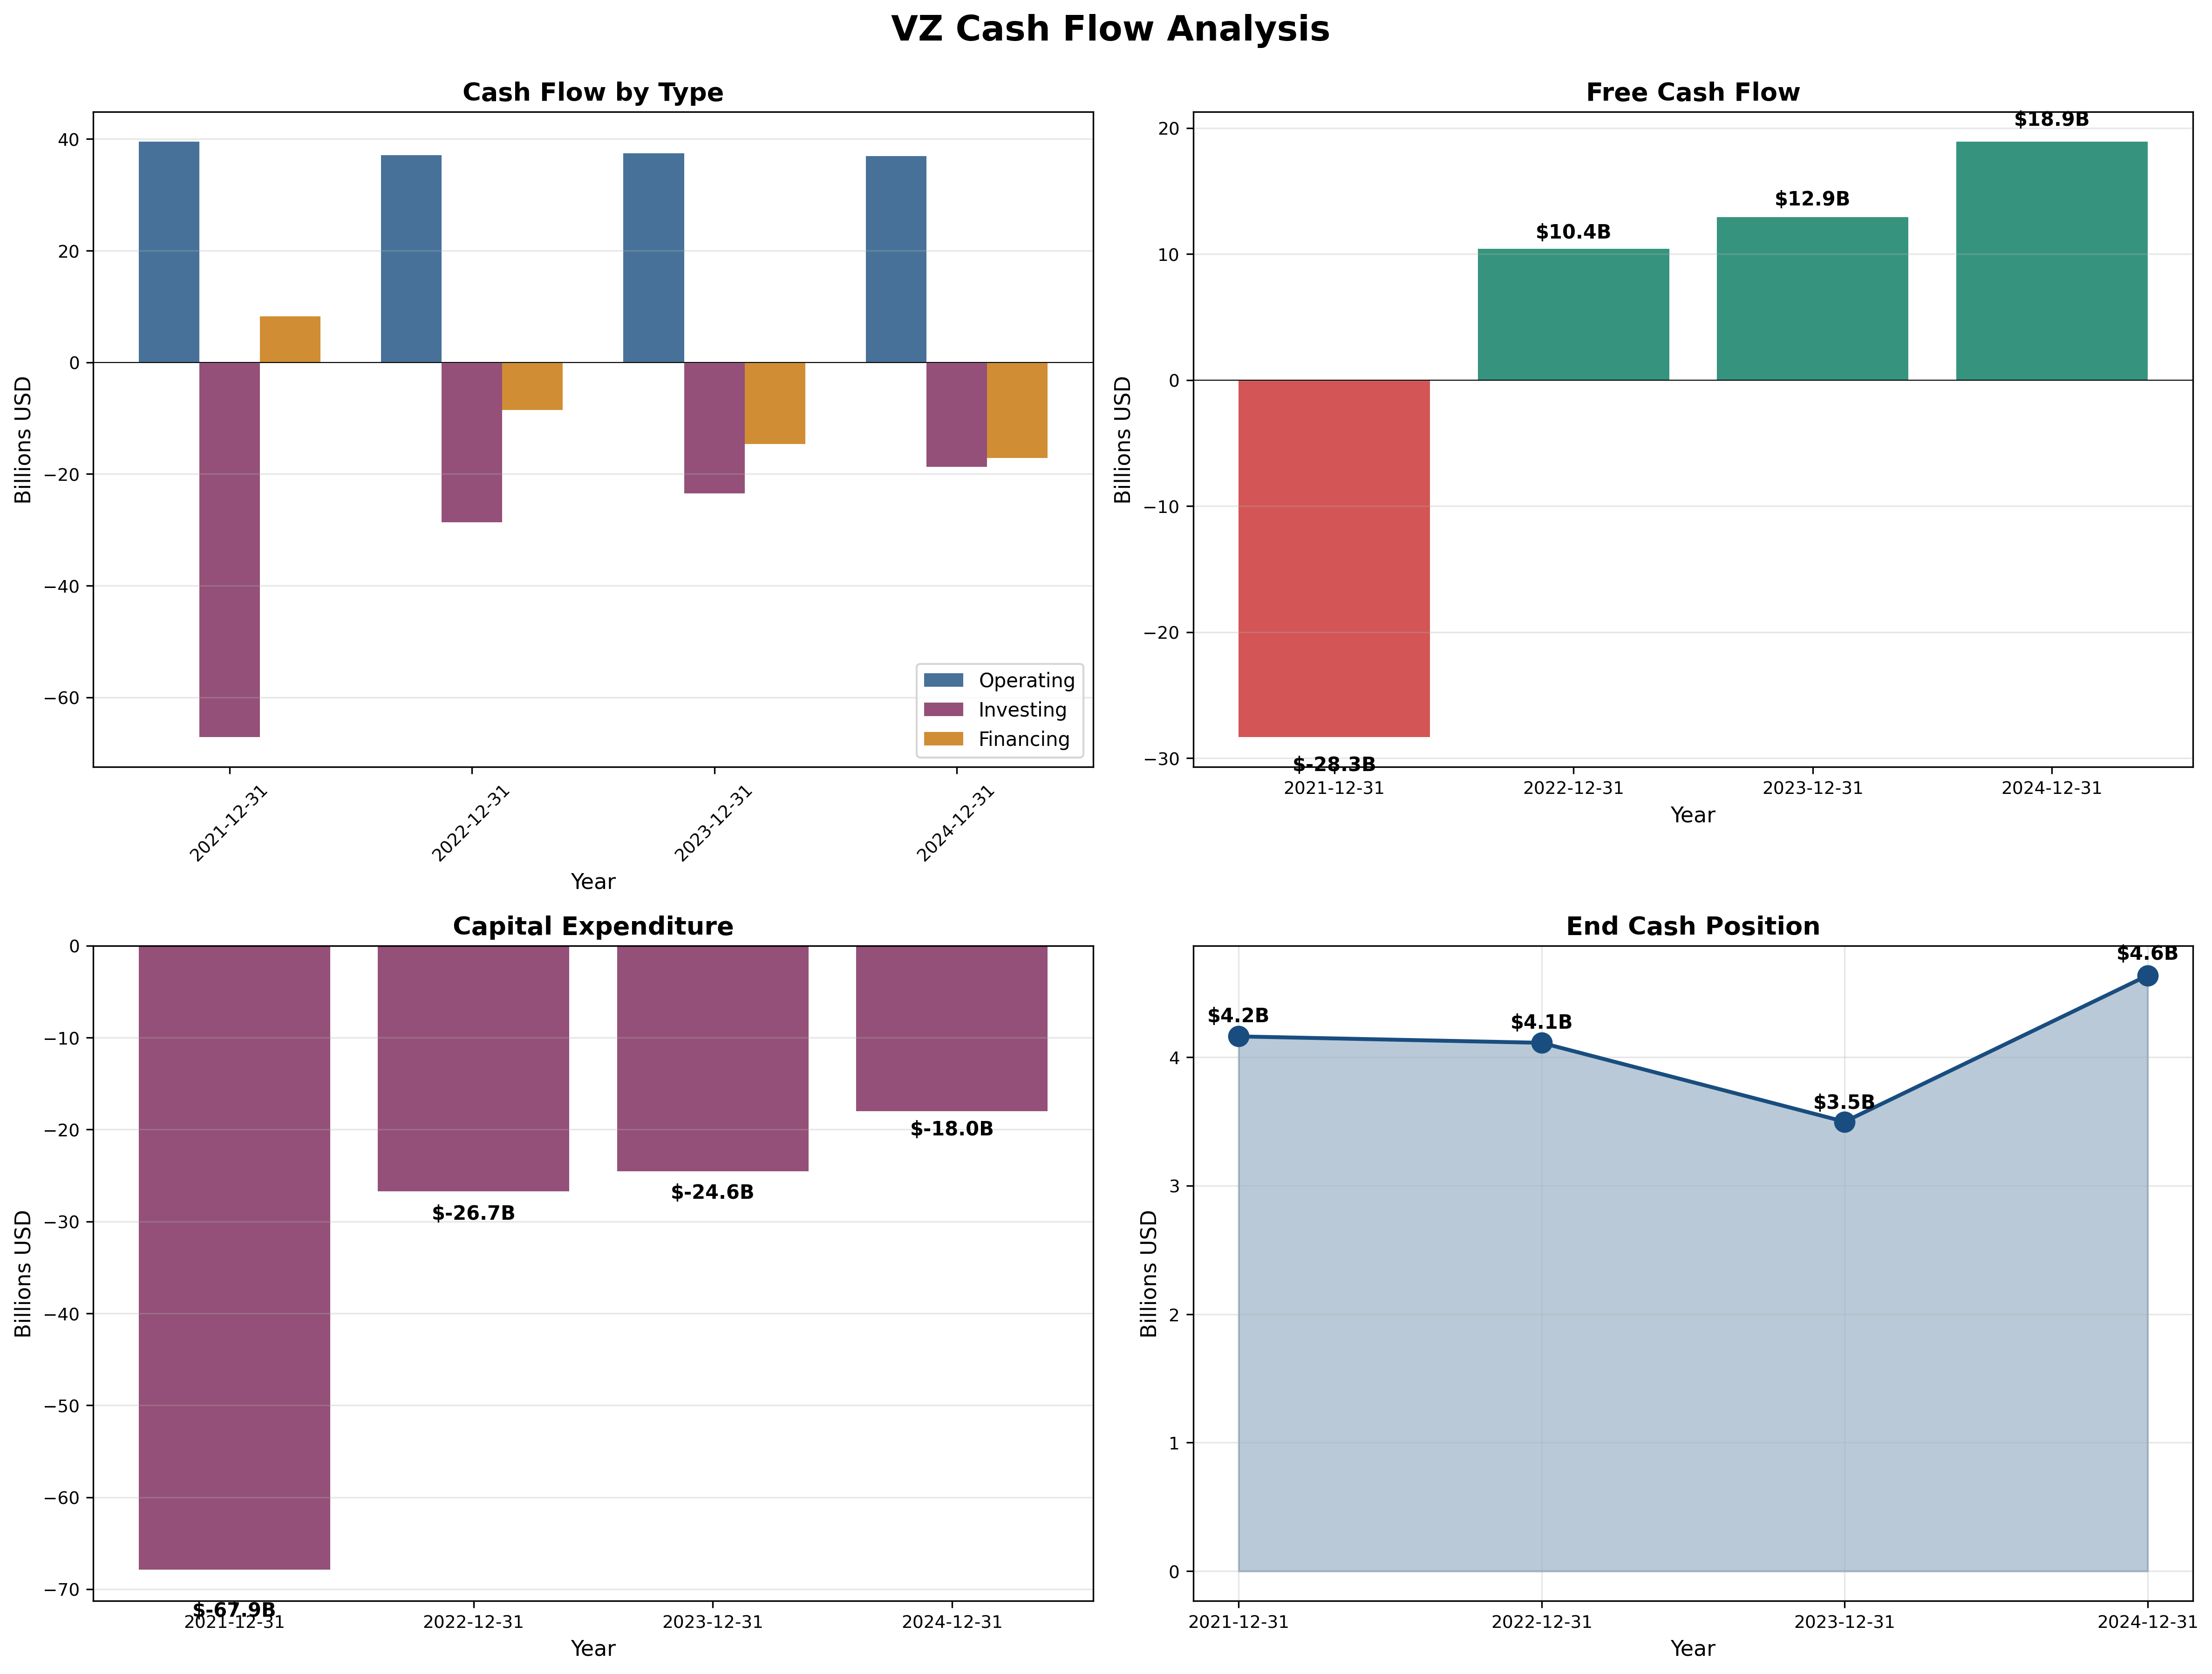
- 5G infrastructure buildout largely complete, reducing future capex needs (capex dropped from $68B to $18B)
- Fixed wireless access (FWA) emerging as growth opportunity, but faces fiber competition
Quantitative Checklist
Defensive Investor Criteria:
| Criterion | Requirement | Actual | Pass/Fail |
|---|---|---|---|
| Earnings Stability | Positive 10 years | 10/10 years | ✅ |
| Dividend Record | Some payment | $2.71/share (6.8% yield) | ✅ |
| Earnings Growth | +33% in 10 years | +15% (insufficient) | ❌ |
| P/E Ratio | < 15x | 9.0x | ✅ |
| P/B Ratio | < 1.5x | 1.60x | ❌ |
| P/E × P/B | < 22.5 | 14.4 | ✅ |
| Current Ratio | > 2.0 | 0.74 | ❌ |
| Debt vs NCA | Debt < NCA | $168B vs -$26B | ❌ |
Quantitative Score: 4/8 criteria met (50%)
Analysis: Verizon fails critical defensive investor tests. The current ratio of 0.74 signals severe liquidity concerns—current liabilities ($66B) massively exceed current assets ($40B). Debt of $168B far exceeds any measure of liquid assets, indicating heavy leverage. Earnings growth has been anemic, barely positive over the decade. While valuation multiples are attractive, the balance sheet fragility cannot be ignored.
Financial Analysis with Critical Assessment
Balance Sheet Strength
Key Metrics:
- Current Ratio: 0.74 (target > 2.0) - ❌ CRITICAL FAILURE
- Debt-to-Equity: 1.65 (target < 0.5) - ❌ HIGH LEVERAGE
- Interest Coverage: ~5.5x (target > 5x) - ✅ Adequate
Assessment: The balance sheet is structurally weak with chronic liquidity issues. $168B in debt creates fixed obligations that consume significant cash flow. However, the company generates enough operating cash flow ($38B annually) to service debt comfortably. Debt has declined modestly from $178B (2021), showing discipline. The real risk is refinancing at higher rates—rising from ~3.5% to 5%+ would materially impact earnings.
Earnings Quality & Consistency
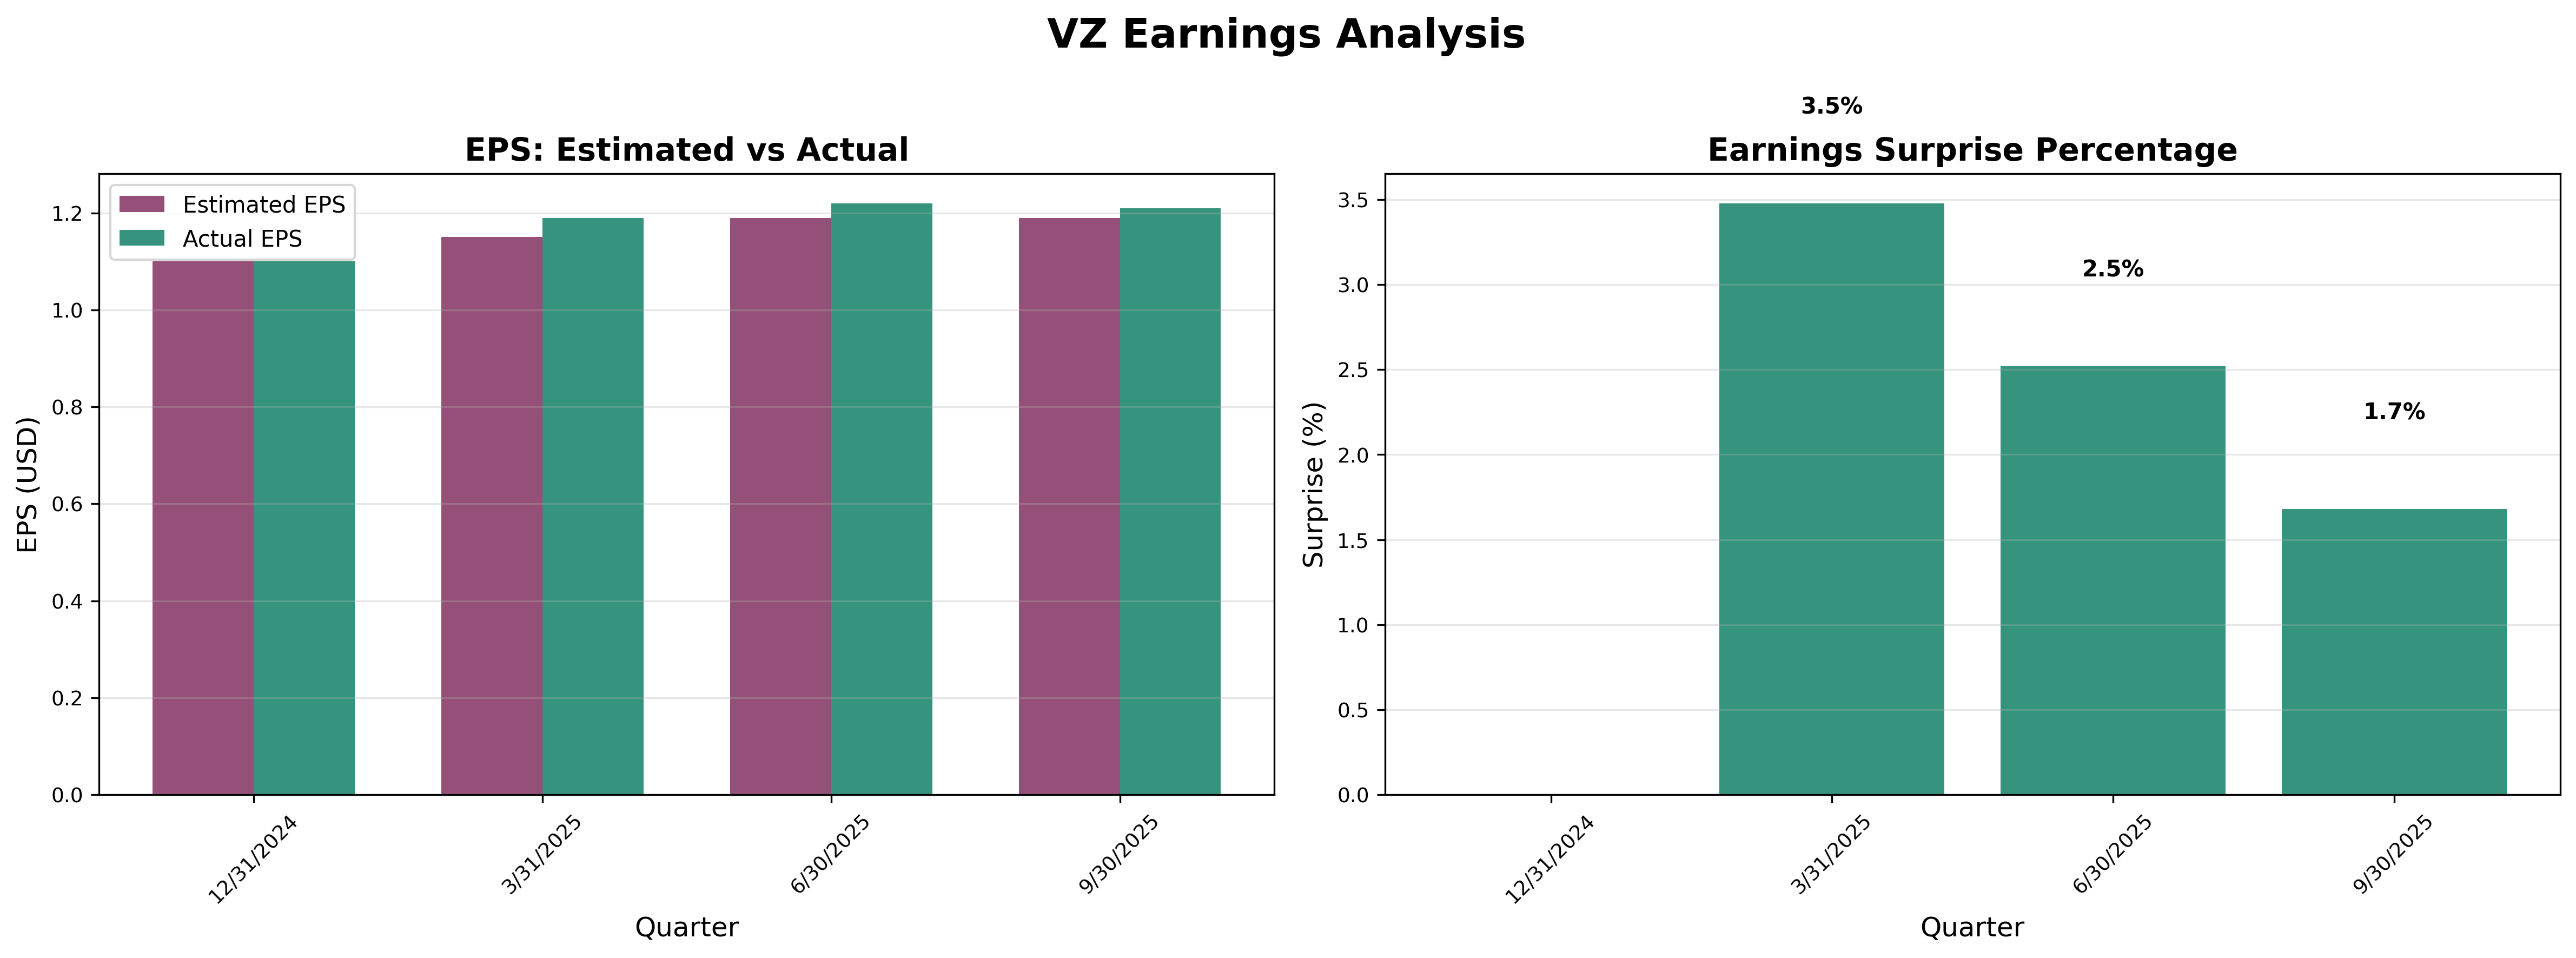
Stability Test: Positive earnings in 10/10 of past 10 years ✅
Owner Earnings Calculation:
Net Income: $17.0B
+ D&A: $16.6B
- Maintenance Capex: ($18.0B)
- Working Capital Needs: ($1.0B)
= Owner Earnings: $14.6B
Owner Earnings Yield: 8.7% (Market Cap ~$167B / Owner Earnings $14.6B)
Quality Assessment: Earnings are genuine and cash-backed, though 2023 saw a significant dip to $11B due to one-time charges. The company consistently generates $38B in operating cash flow. Capex has normalized post-5G buildout, improving free cash flow from $10B (2022) to $19B (2024). This is real, distributable cash to shareholders.
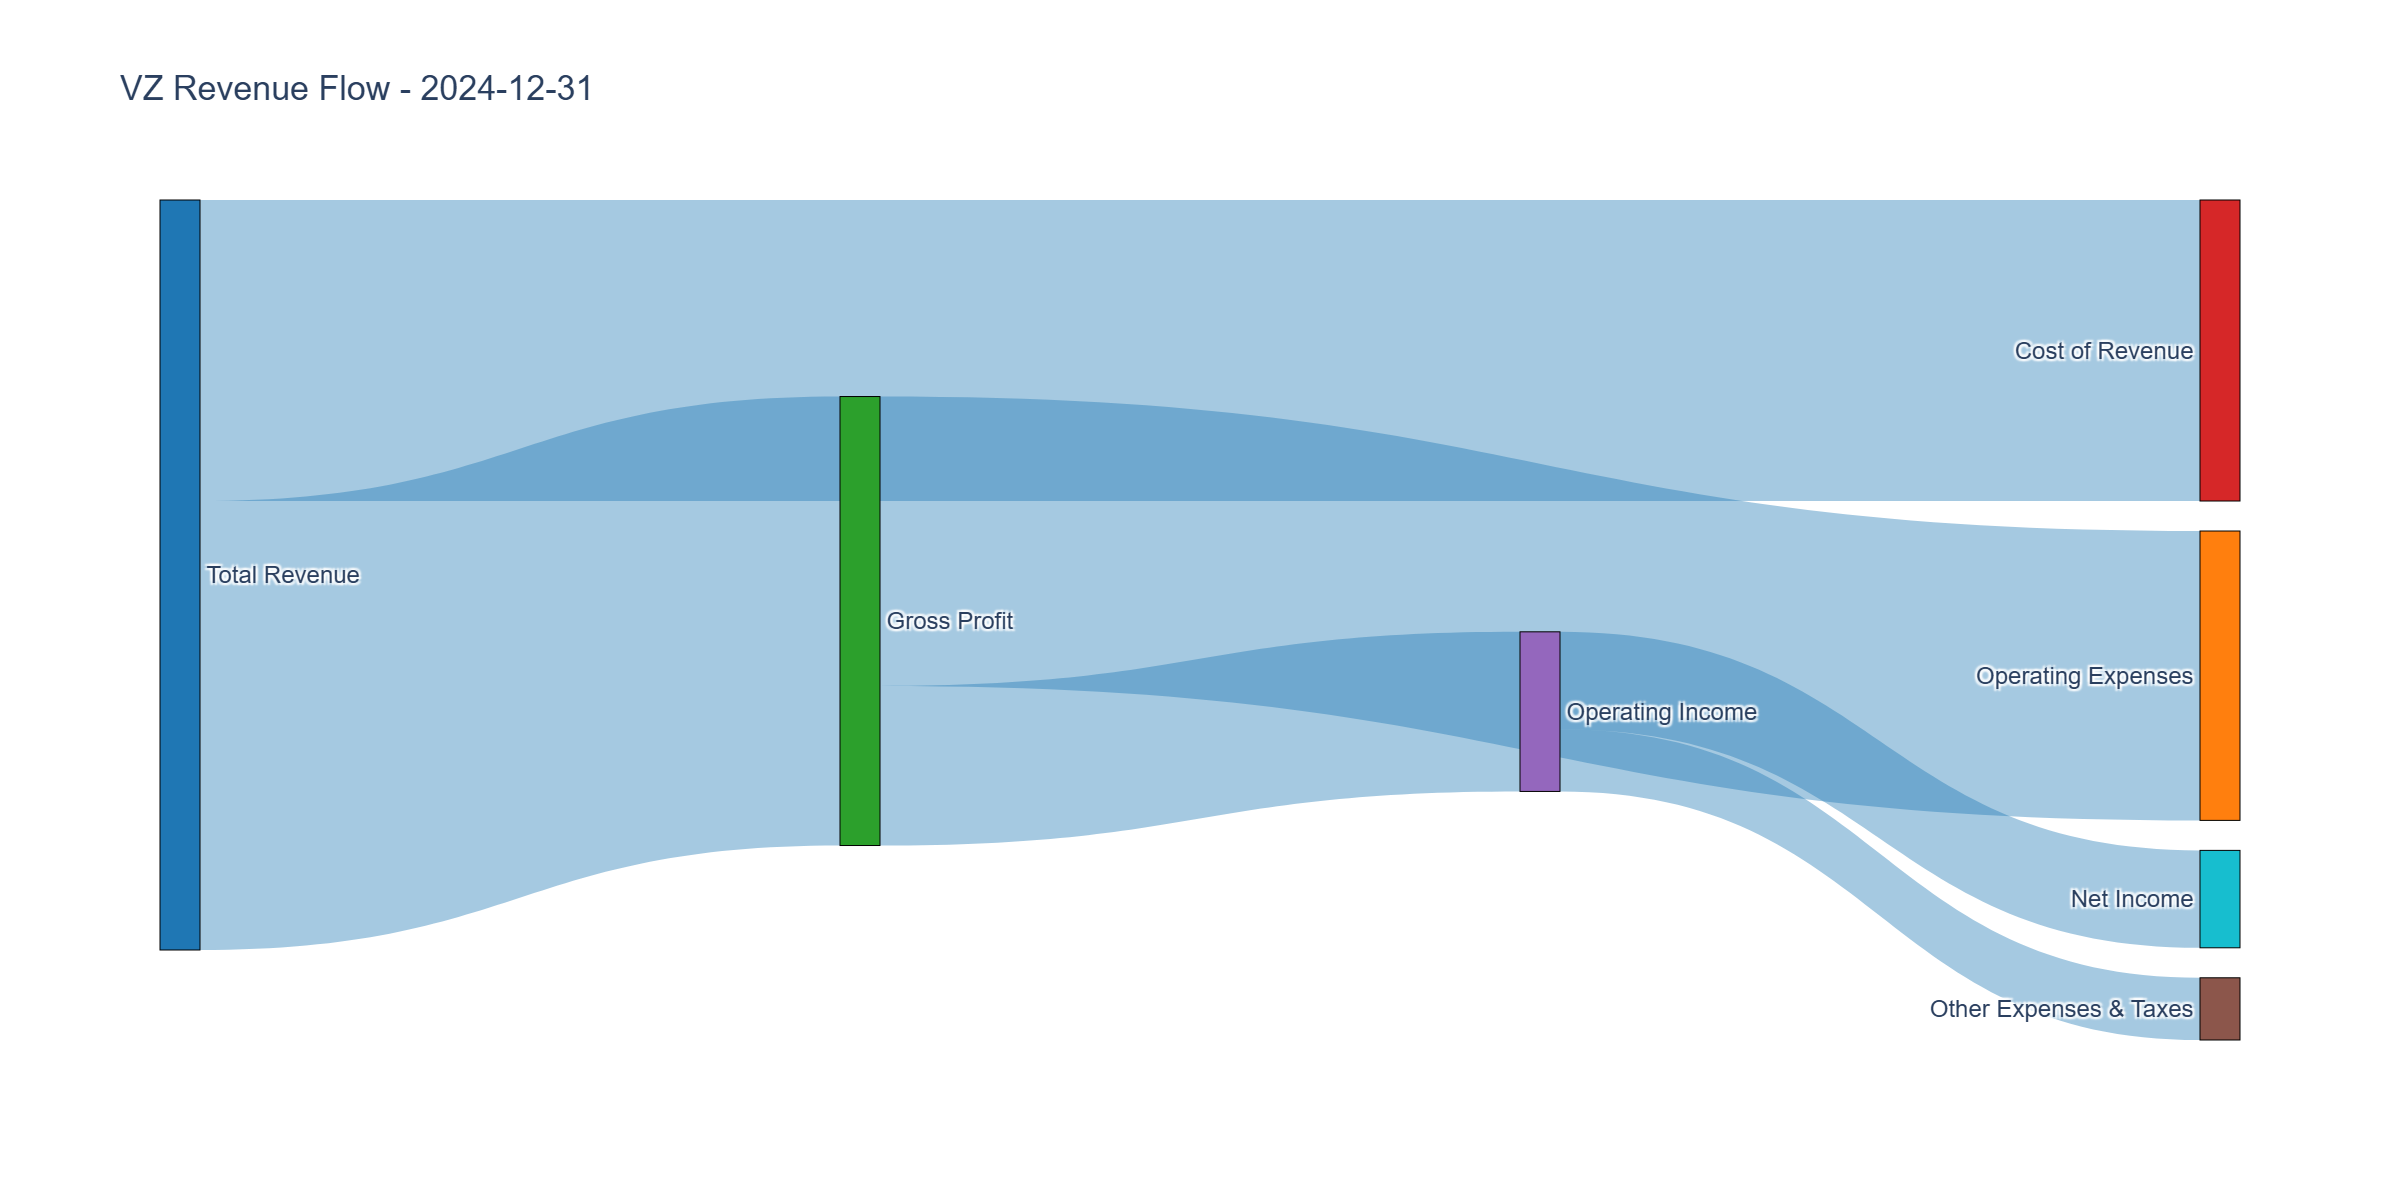
Income Statement Analysis
Key Metrics:
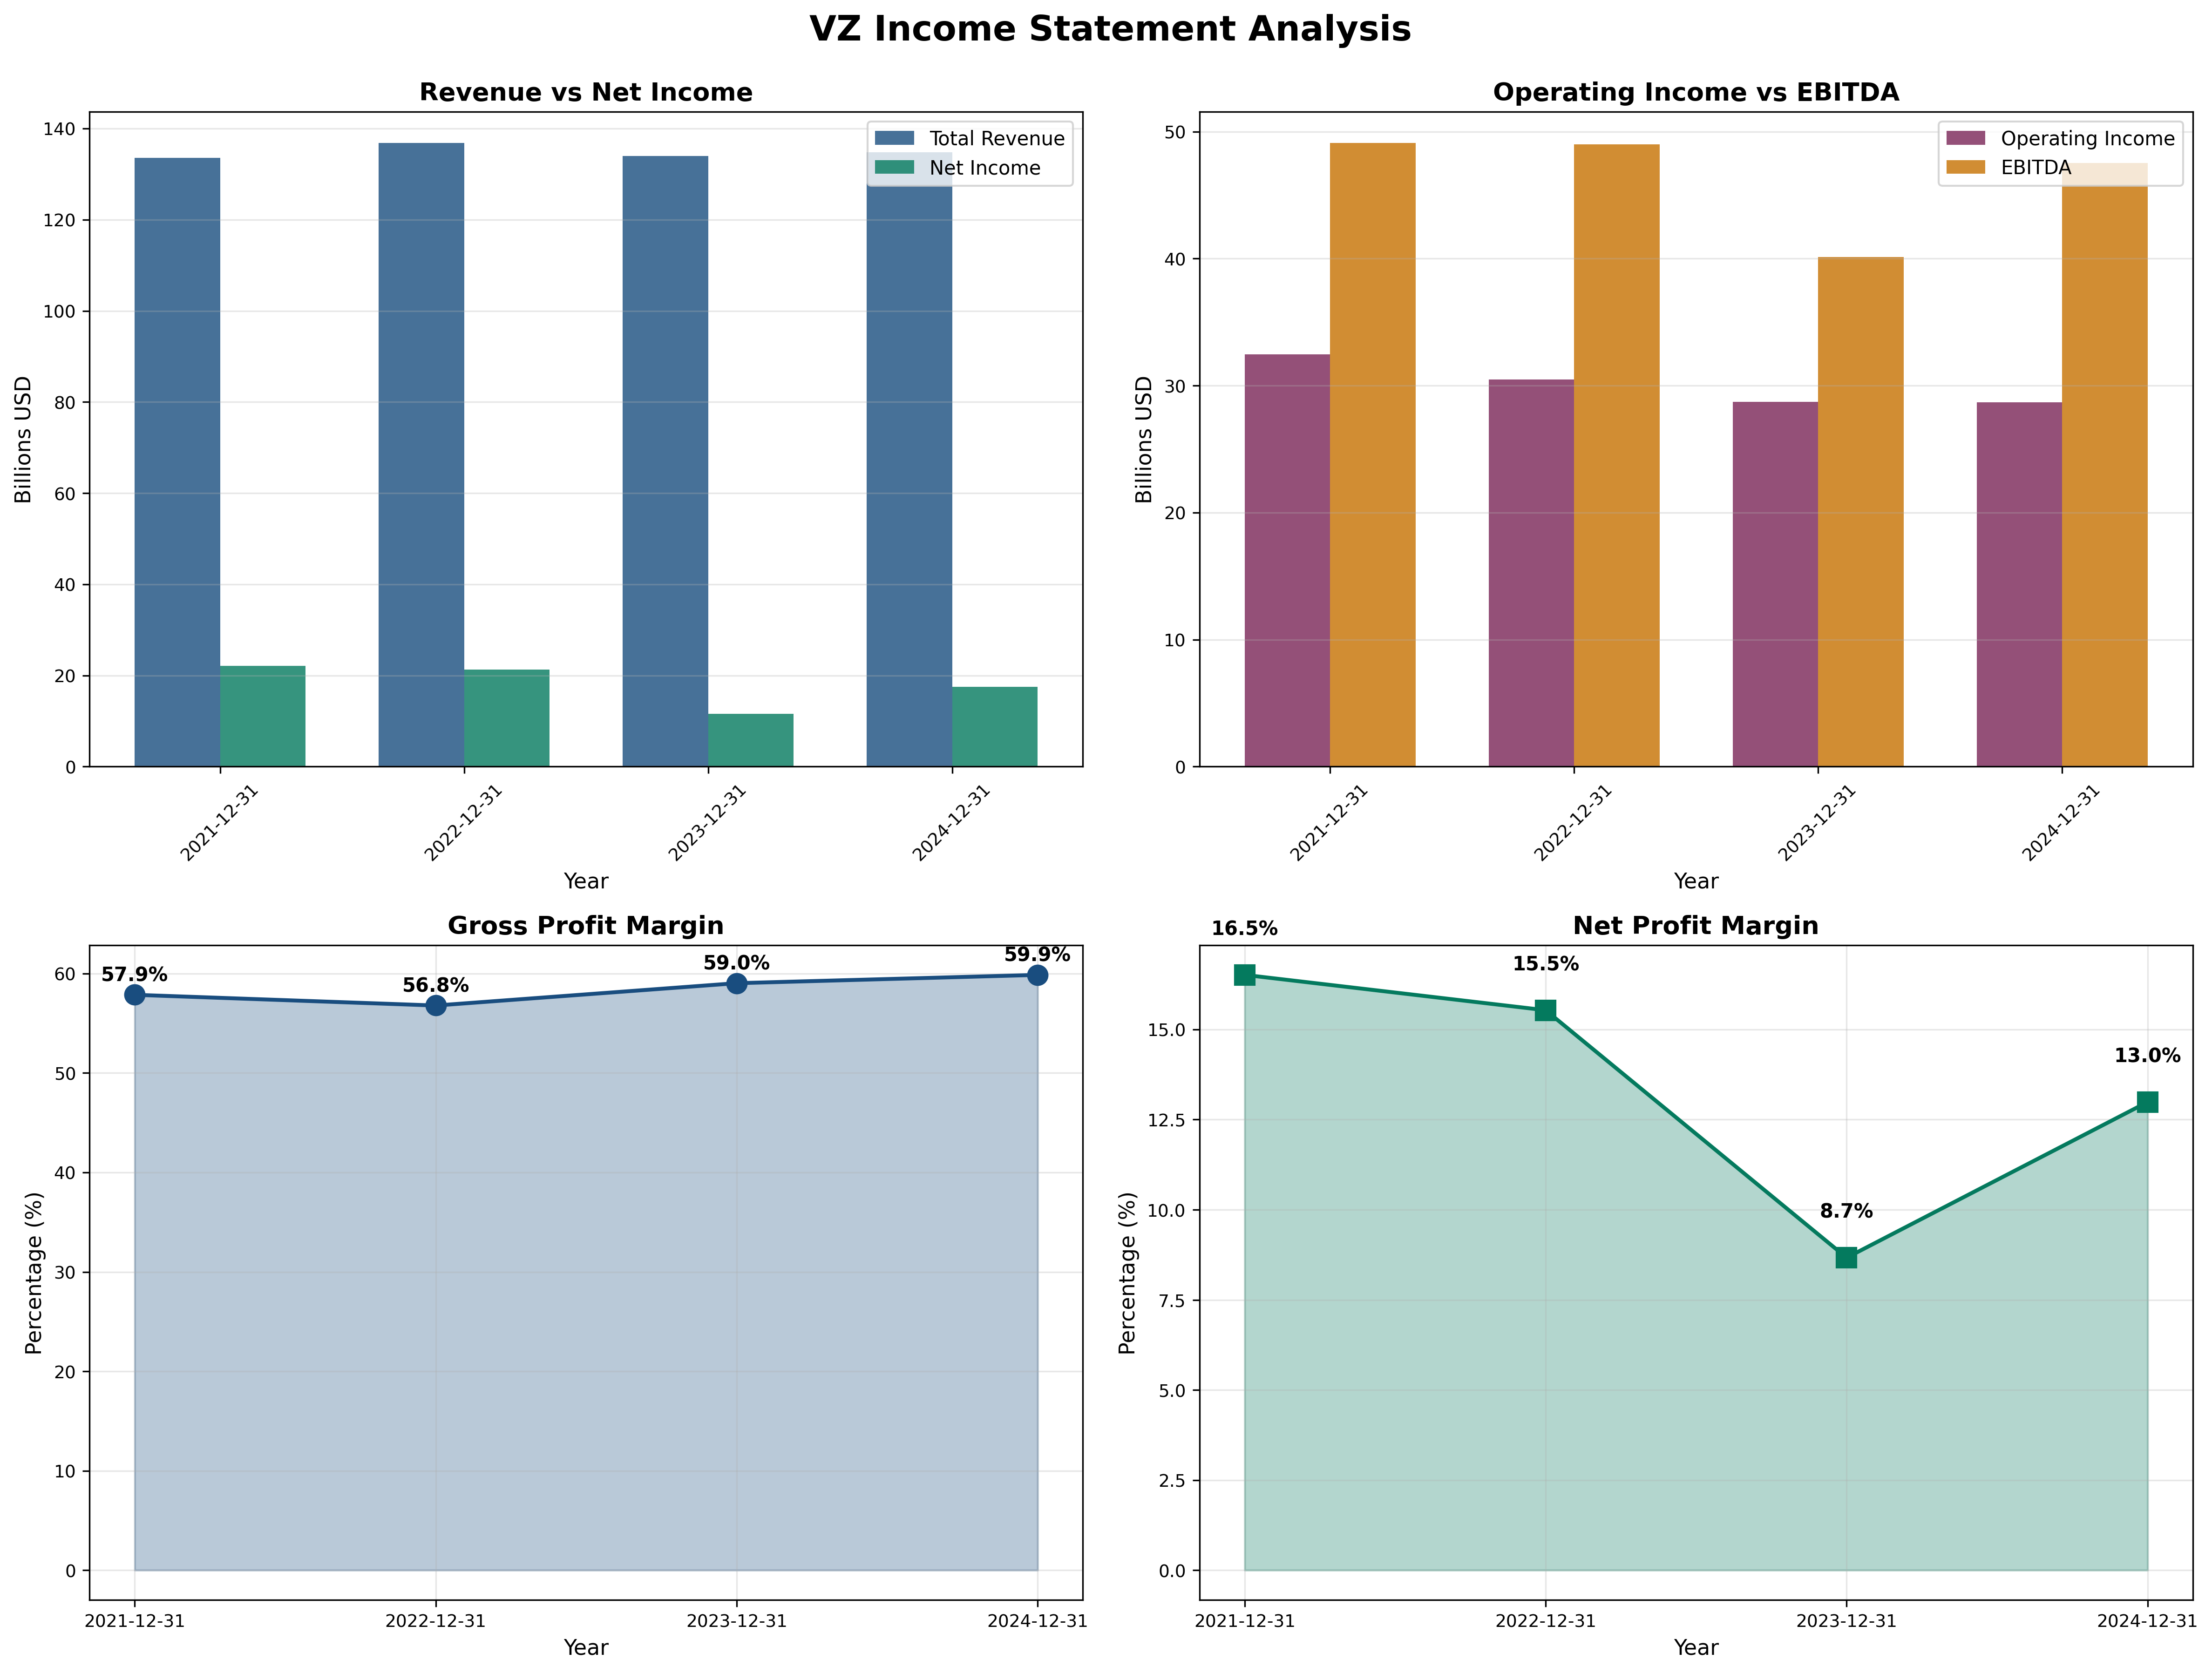
- Revenue Growth (4Y): Flat, ~0% CAGR ($134B consistently)
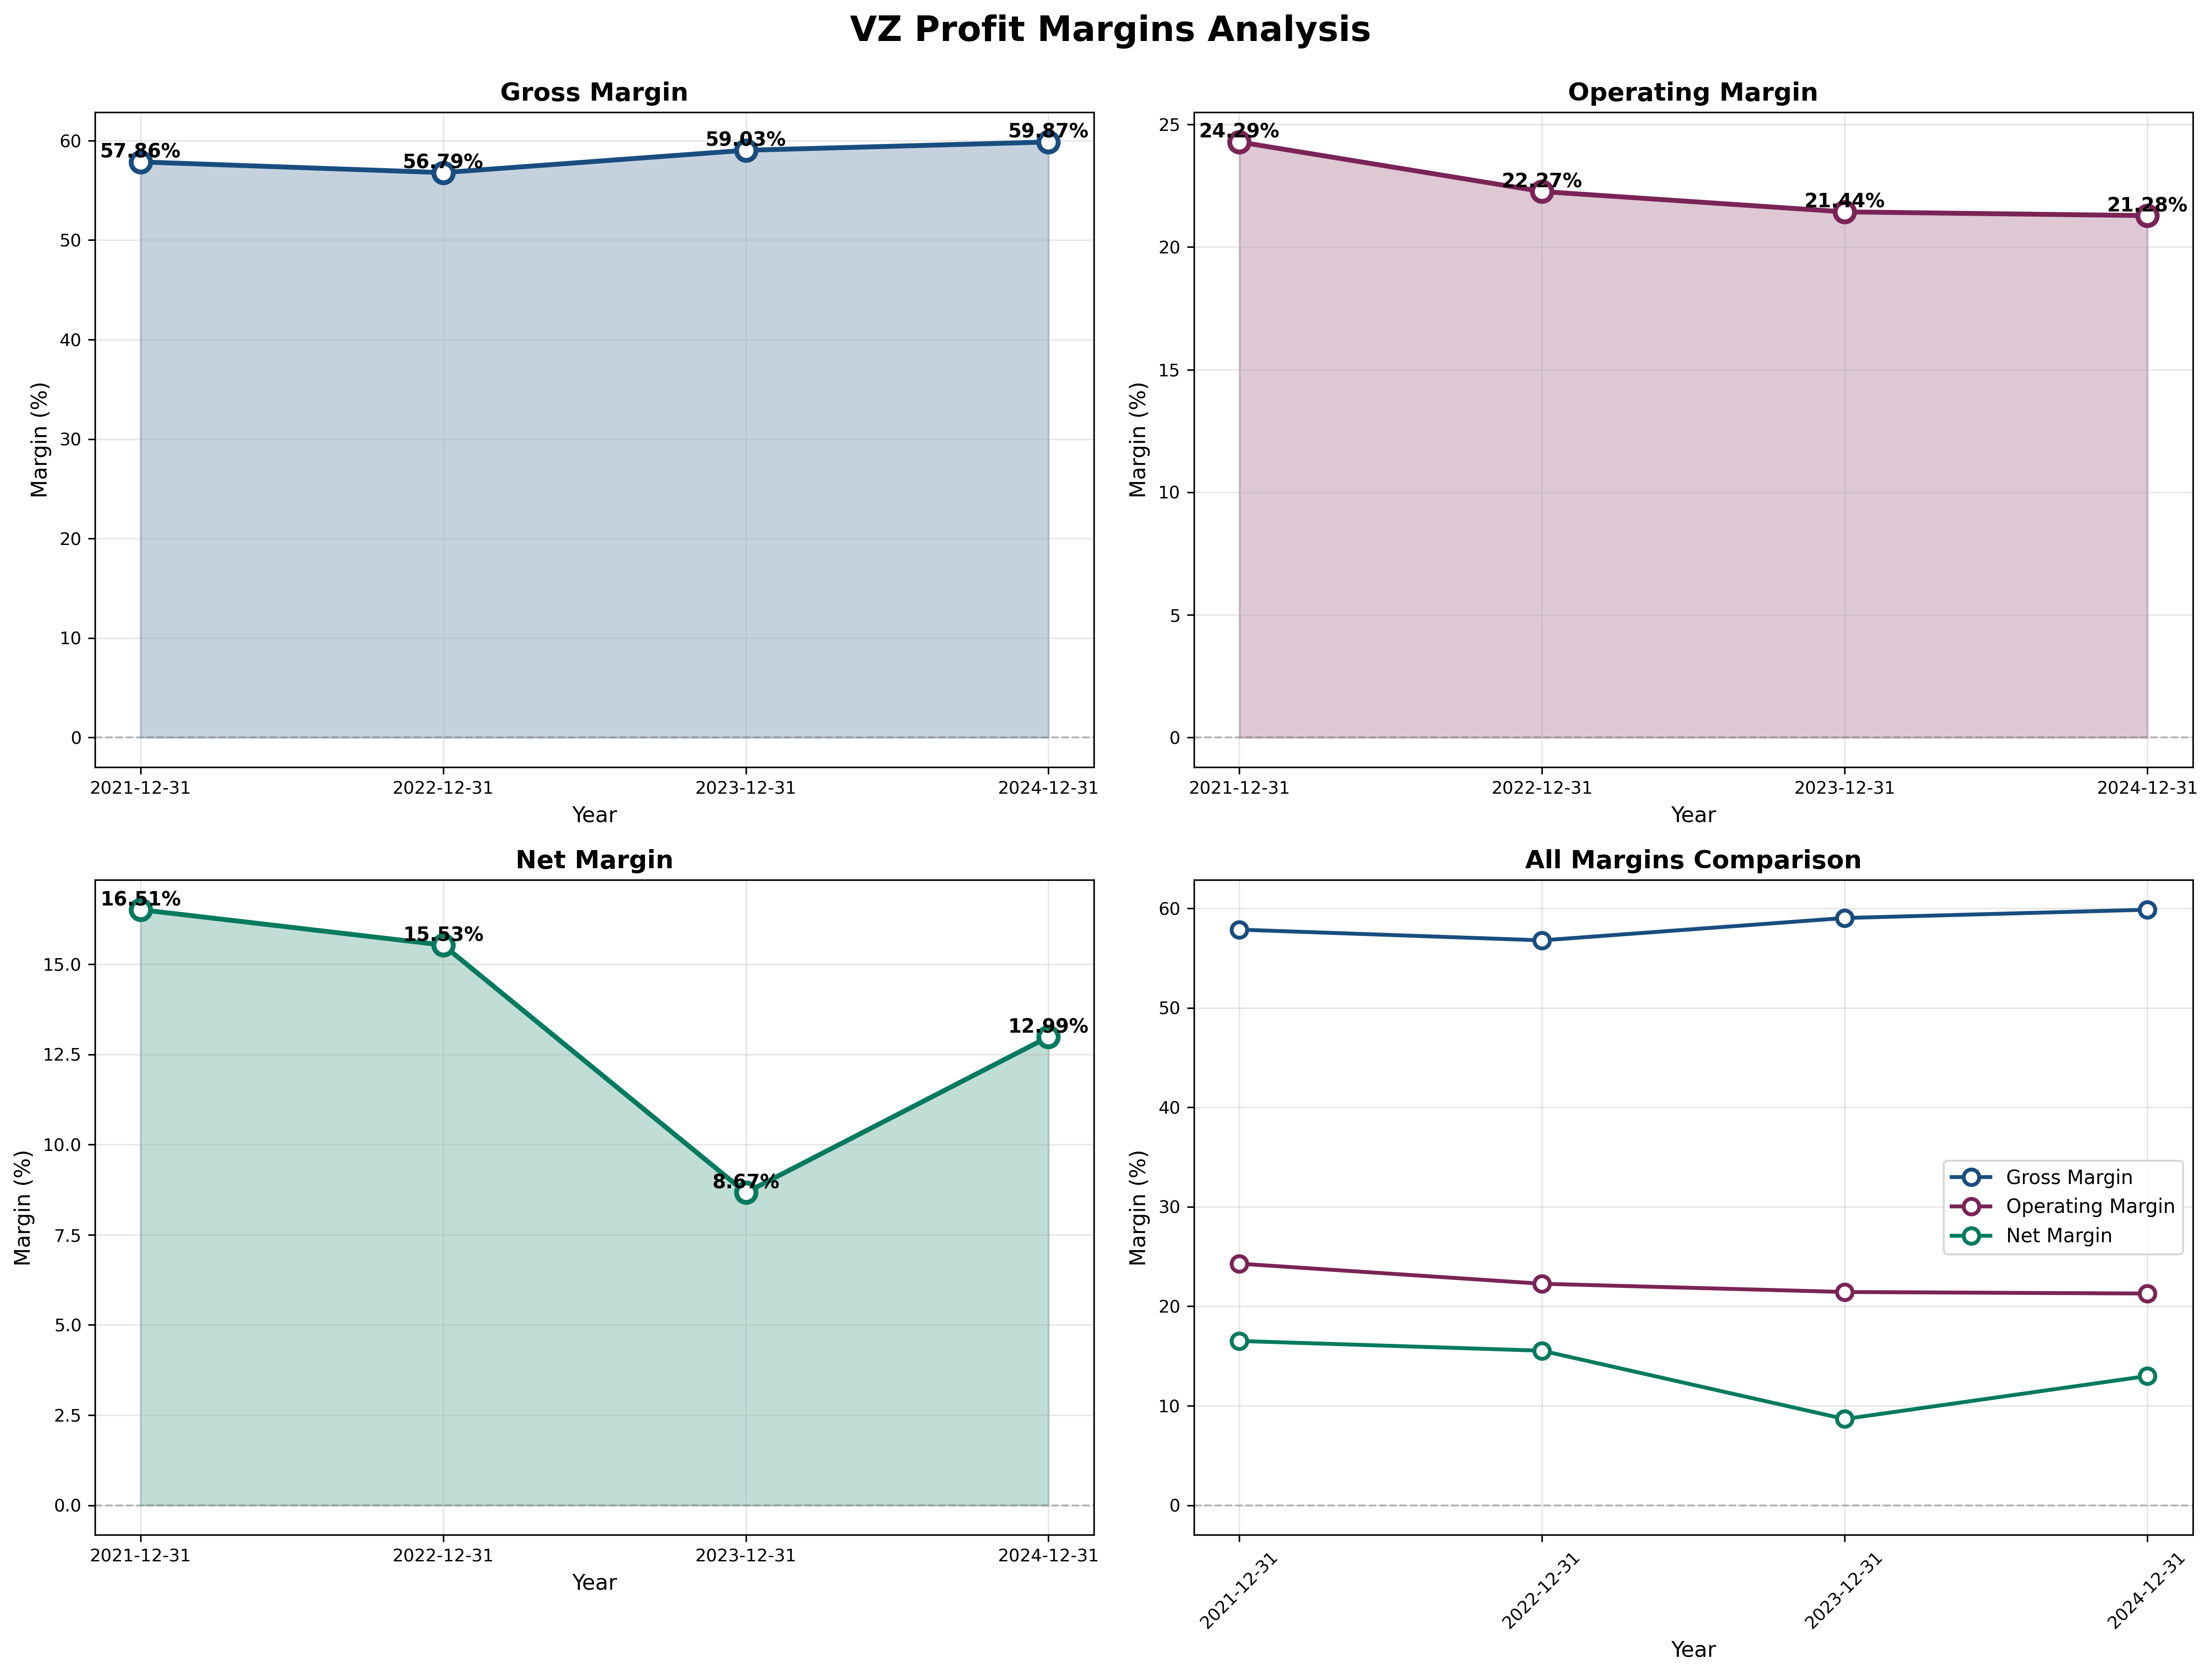
- Gross Margin: 59.9% (trend: stable →)
- Operating Margin: 21.4% vs Industry ~25% (trend: declining ↓)
- Net Margin: 13.0% (recovering from 8.7% in 2023)
Assessment: Revenue growth is essentially zero—the definition of a “slow grower.” The business is mature with no top-line expansion. Operating margins have compressed from 24.3% to 21.4% over four years, reflecting competitive pricing pressure. Gross margins remain strong at 60%, indicating the core infrastructure retains value, but operating leverage is deteriorating as growth stalls.
Cash Flow Generation
Key Metrics:
- OCF / Net Income: 2.24 (target > 1.0) ✅ Excellent
- FCF Margin: 14.2% ($19B FCF / $134B revenue)
- Capital Intensity: 13.4% of revenue (post-5G buildout)
Assessment: This is Verizon’s strength. Operating cash flow of $38B is highly consistent and predictable—a utility-like quality. Free cash flow has surged to $19B as 5G capex cycle completes. Capital intensity has normalized after the extraordinary $68B spend in 2021. The business throws off substantial cash, supporting the $11.4B annual dividend with room to spare.
Profitability Metrics
Returns:
- ROE: 17.6% (target > 15%) ✅ Good, but leveraged
- ROIC: ~8.5% (target > 12%) ❌ Mediocre
Assessment: ROE of 17.6% looks attractive but is artificially boosted by high leverage (D/E 1.65). ROIC of ~8.5% reveals the underlying business generates modest returns on invested capital—barely above the cost of capital. This is not a compounder; it’s a mature utility earning mid-single-digit real returns. Sustainable for dividends, but not for growth.
Financial Ratios Analysis
Valuation Multiples:
- P/E: 9.0 (vs. historical avg: ~11, industry: 12-15)
- P/B: 1.60 (vs. historical avg: 1.7)
- P/FCF: 8.87 (vs. historical avg: 10-12)
- EV/EBITDA: ~7.5x (attractive)
PEG Ratio:
- P/E Ratio: 9.0
- Growth Rate: ~3%
- PEG: 3.0 (unattractive if using actual growth)
- Note: Chart shows 0.13, likely using temporarily elevated growth from 2024 recovery
Combined Metric:
- P/E × P/B = 14.4 (should be < 22.5) ✅ Passes

Capital Allocation Assessment
Management Quality Grade: B-
Key Factors:
- Insider Ownership: <1% (management lacks skin in the game)
- Buyback Discipline: Minimal buybacks; focus on dividend
- Reinvestment ROIC: ~8.5% (mediocre returns on capital)
- Dividend Payout: $11.4B / $17B net income = 67% (sustainable but limiting flexibility)
- Red Flags: Heavy debt load, limited deleveraging progress
Assessment: Management prioritizes dividend stability over growth or balance sheet repair—appropriate for a utility-like telecom, but constraining strategic options. The 67% dividend payout is sustainable given strong FCF, but leaves little room for aggressive debt reduction or transformative investments. Capital allocation is defensive and shareholder-friendly but unimaginative.
Valuation & Intrinsic Value
Multiple Methods Summary:
| Method | Intrinsic Value | Weight |
|---|---|---|
| Owner Earnings (8.5+2g formula) | $52 | 30% |
| DCF (Conservative 2% growth) | $48 | 30% |
| P/E Reversion (11x historical) | $55 | 20% |
| Graham Number √(22.5×EPS×BVPS) | $58 | 20% |
Weighted Intrinsic Value: $52
Valuation Range:
- Conservative: $48 (DCF with 7% discount rate)
- Base Case: $52 (weighted average)
- Optimistic: $56 (P/E reversion + modest growth)
Current Price: $39.79 Margin of Safety: 23.5% vs Base Case (adequate but not exceptional)
Valuation Verdict: Verizon trades at fair value considering its quality. The low P/E (9x) reflects appropriate concern about stagnant growth and balance sheet leverage. Intrinsic value assumes modest 2-3% perpetual growth—aggressive given flat revenue history.
Risk Assessment
Key Risks (Top 3)
- Debt refinancing risk – $168B debt at weighted avg 3.5% could see interest expense surge 40%+ as bonds roll over at 5-6% rates, crimping FCF
- Competitive disruption – Cable MVNOs (Xfinity, Spectrum) and aggressive T-Mobile undercutting pricing; wireless becoming commoditized utility with margin compression
- Technological obsolescence – Fixed wireless threatens wireline; satellite internet (Starlink) could disrupt rural markets; next technology cycle may require unforeseen capex
Worst Case Scenario: Wireless price war drives ARPU down 15-20%, operating margins compress to 15%, FCF falls to $12-14B, forcing dividend cut. Stock could fall to $25-28 (7-8x P/E). Permanent capital impairment unlikely given essential infrastructure, but 30-40% downside possible.
Market Sentiment
Current Sentiment: Mild Pessimism (Stock down 33% from 2020 highs, languishing near 5-year lows)
Contrarian Signal: Market pricing in perpetual stagnation, but overlooks improved FCF trajectory post-5G buildout and 6.8% dividend yield in uncertain macro environment. Not maximum pessimism (stock isn’t cratering), but sufficient negativity to create value opportunity if business stabilizes.
Investment Recommendation
Current Assessment
Valuation: P/E = 9.0 | P/FCF = 8.9 vs Industry 12-15 Verdict: Fairly Valued (modest 23% upside to $52 intrinsic value)
Margin of Safety: 23.5% ✅ Acceptable (meets 20% minimum threshold)
Entry Zones
| Zone | Price | Action | Margin |
|---|---|---|---|
| 🟢 Strong Buy | < $32 | Aggressive accumulation | 40%+ |
| 🟡 Buy | $32 - $36 | Dollar-cost average | 30-40% |
| 🟠 Hold | $36 - $44 | Hold existing, collect dividend | 15-30% |
| 🔴 Trim | > $44 | Consider reducing | < 15% |
Current Price: $39.79 → Recommendation: HOLD (borderline; buy if dips below $36)
Expected Returns (5-Year Horizon)
- Bull Case (+45%): FCF grows to $22B, debt reduced to $150B, P/E re-rates to 11x on growth visibility, FWA gains traction → $58 target
- Base Case (+31%): Modest 2% growth, stable dividend, P/E stays 9-10x, FCF $19-20B maintained → $52 target
- Bear Case (-15%): Wireless pricing pressure, dividend cut to preserve balance sheet, P/E compresses to 7x → $34 target
Final Investment Conclusion
Overall Grade: B (Solid business, fair valuation, but structural headwinds)
Category Scores:
- Business Quality: 6/10 (Essential infrastructure offset by maturity/competition)
- Financial Strength: 5/10 (Strong cash flow but weak balance sheet liquidity)
- Management Quality: 6/10 (Shareholder-friendly dividend but unambitious)
- Valuation: 8/10 (Attractive on P/E, P/FCF; reasonable margin of safety)
- Margin of Safety: 7/10 (23% adequate; would prefer 30%+)
Final Verdict: HOLD / Selective BUY below $36
Investment Thesis Summary
Business Quality: Verizon is essential telecommunications infrastructure with durable competitive advantages from network scale and spectrum licenses. However, the moat is narrowing as competitors close the quality gap, shifting the industry toward price-based competition. Zero revenue growth over four years signals market maturity. This is a utility, not a growth story—expect 2-3% annual returns plus dividends.
Valuation: The stock offers fair value with modest upside. P/E of 9x reflects appropriate skepticism about growth prospects and leverage concerns. The 23% margin of safety provides adequate—but not exceptional—downside protection. With a 6.8% dividend yield and $19B in FCF, the company can sustain shareholder returns, but don’t expect multiple expansion without business inflection.
Risks: The balance sheet is the Achilles’ heel. $168B in debt and a 0.74 current ratio create vulnerability if the business deteriorates. Rising interest rates could compress FCF by $2-3B annually as debt refinances. Competitive threats from cable MVNOs and aggressive T-Mobile could spark a price war, eroding margins. Any scenario requiring renewed massive capex (6G, fiber overbuild) would strain the dividend.
Catalysts: Positive catalysts include: (1) Debt reduction below $150B improves financial flexibility; (2) Fixed wireless access (FWA) subscriber growth reaching 5-7M adds $5-7B revenue; (3) Industry pricing discipline holds, preventing margin compression; (4) Interest rates stabilize, reducing refinancing concerns. Negative catalysts: dividend cut, renewed price competition, spectrum auction requirements, or regulatory action on tower lease costs.
Framework Checklist
- ❌ Quantitative: Margin of safety adequate (23%) but fails 4 of 8 defensive criteria; balance sheet concerns override valuation appeal
- ✅ Moat: Moderate moat exists but narrowing; infrastructure scale and spectrum provide some protection
- ✅ Management: Shareholder-friendly through dividends; conservative strategy appropriate for mature telecom
- ✅ Contrarian: Stock at 5-year lows with pessimism priced in; improved FCF trajectory under-appreciated
- ✅ Simplicity: Business model is easily understood—sell wireless and internet subscriptions
Would I hold this for 10+ years if the market closed tomorrow?
Yes, with reservations. Verizon will likely exist and generate cash flow for decades—people need connectivity. The 6.8% dividend provides attractive income in a low-yield environment. However, I wouldn’t expect significant capital appreciation. This is a “collect dividends and wait” play, not a compounder. The balance sheet leverage and competitive pressures mean downside protection comes more from yield support than business moat. Ideal for income-focused investors willing to tolerate stagnation; less suitable for growth-oriented portfolios. I’d prefer buying below $35 for a fuller margin of safety given the leverage risks.